

1. Questions
The value of travel time (VOTT) has been called “the most important number in transport economics” (Daly and Hess 2020), affecting both the quantity and mode of travel, as well as the estimated benefits of transportation infrastructure investments (U.S. Department of Transportation 2016). The effects of emerging (carsharing, ridehailing) and prospective (automated vehicles) transportation technologies on VOTT are key determinants of their impacts on travel demand and transportation infrastructure.
Prior work has shown that the ability to use information and communication technologies (Bounie et al. 2019) or to multitask during travel (Varghese and Jana 2018) reduces VOTT among transit riders. Relieving an automobile traveler of having to drive the car, whether by another human driver (e.g., when ridehailing) or by automation, may also reduce VOTT by allowing travelers to multitask. Numerous studies have estimated these VOTT effects using stated preference data (e.g., Yap, Correia, and van Arem 2016; de Looff et al. 2018; Steck et al. 2018; Gao, Ranjbari, and MacKenzie 2019) but few have done so with revealed preferences.
This paper applies revealed preference data on carsharing and ridehailing choices to answer the question: How does VOTT when driving oneself differ from VOTT when being driven by someone else?
2. Methods
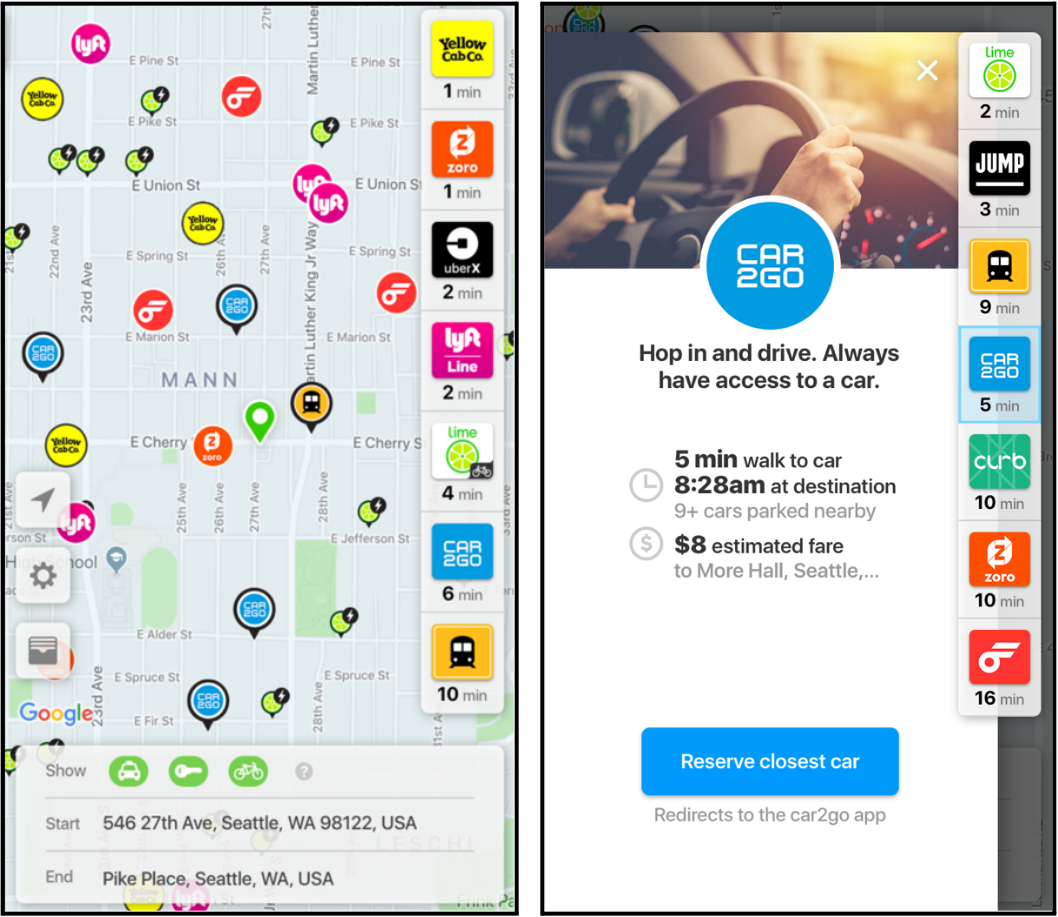
The data for this study were provided by Migo, a Seattle-based aggregator app, that presents travelers with a set of options, including solo ridehailing (UberX and Lyft) and free-float carsharing (car2go), displaying attributes like price, travel time, and other relevant information (Figure 1). The traveler may book services in the app (for ridehailing only) or link out to the booking page in the respective service provider’s app (for both ridehailing and carsharing). This revealed preference dataset is particularly valuable as it offers insights into the choices made by individuals when simultaneously presented with riding and driving alternatives.
.png)
For each presented travel option, the Migo app records the price, in-vehicle travel time (IVTT), walking time (for carsharing, to the closest vehicle available) and waiting time (for ridehailing) that were shown to the user at the time of booking. For carsharing, walking time at the end of the trip was not shown as users could park at a desired location close to their destination. Also, parking fees were not paid out of pocket by the user or priced into individual trips, so car2go pricing was based purely on time. The app also stores travelers’ anonymous IDs and locations, trip origin/destination locations, app opening time, service selection or link-out to service providers’ app, and time of booking/linking out. Migo did not provide any sociodemographic data on the app users.
We received a dataset of about 2080 observations gathered from 158 unique U.S. users from July 2018 to February 2019. For the analysis, we only considered observations for which both ridehailing (Uber and/or Lyft) and carsharing (car2go) options were available and the user selected (booked or linked out to the respective app) one of them. If car2go or both ridehailing alternatives were unavailable for the trip, the observation was removed. Moreover, to have a meaningful comparison, we only included data for travelers who had used both carsharing and ridehailing services at least once in their lifetime use of Migo. We also removed observations with critical missing data (e.g., ridehailing price, walk time, wait time) and those wherein the distance between the traveler’s current location and the entered trip origin was more than 1200 meters, assuming those to be curiosity searches or a booking for someone else. The cleaned dataset included 863 observations related to 103 users (Figure 2). Car2go was selected in 98 observations (52 users), Lyft in 308 (51 users), and UberX in 457 (60 users). Although all 103 users had used both carsharing and ridehailing services at least once in their Migo history, they did not necessarily use all three modes during the period represented in our dataset.
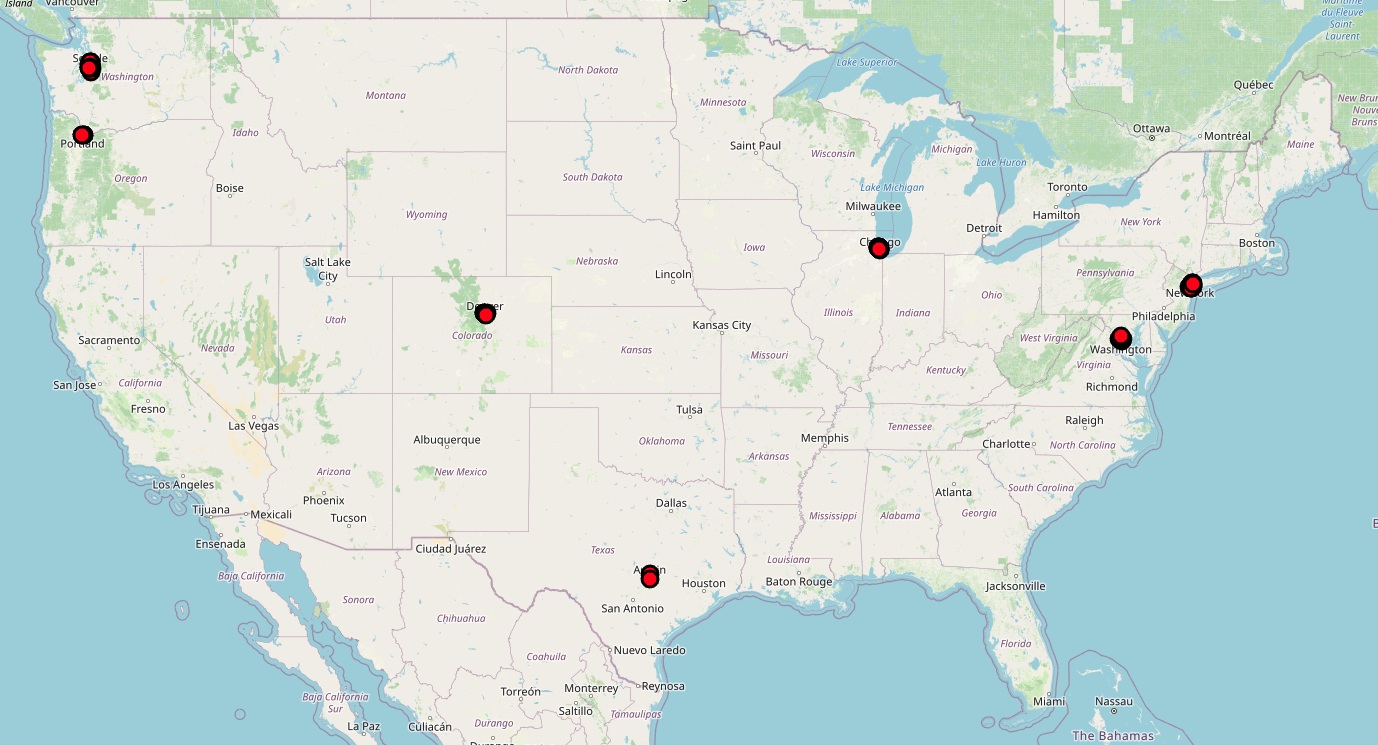
Table 1 shows the summary statistics for the time and cost variables in the cleaned dataset. For all services, the distributions appear to be within reasonable ranges; however, there is little-to-no variation in the estimated IVTT shown to the users for different modes. That is because when presenting alternatives to users at the time of booking, Migo calculated IVTT based on the user’s entered origin and destination addresses, resulting in the same estimated IVTT for the ridehailing and carsharing alternatives. Figure 3 shows the distributions for ridehailing wait time and carsharing walk time.

To analyze the data, we employed a mixed logit model (with error components) to estimate travel time’s marginal disutility in the carsharing and ridehailing modes, controlling for waiting time, walking time, and price. The mixed logit model captures random variations across individuals accounting for the panel effect of the data, and it provides a more general substitution pattern compared with multinomial/nested logit models. Since the IVTT shown to users did not vary across alternatives, we were unable to estimate mode-specific coefficients for IVTT. Instead, we treated IVTT as an attribute of the choice situation, with its effect on car2go (the reference alternative) utility fixed to zero and its effect on ridehailing modes utilities measured relative to that of the reference alternative (car2go). So, the IVTT parameter should be interpreted as the difference in utility between carsharing and ridehailing, per minute of travel time. The modeled utility functions are as follows, and we used the PandasBiogeme package in Python to estimate the model.
Where
Vjit: observable portion of the utility for mode j for individual i in choice situation t
ASCj: alternative-specific constant for mode j
Pjt: price of mode j in choice situation t
Tjt: in-vehicle travel time of mode j in choice situation t
WKjt: walk time from origin location to the nearest carsharing vehicle in choice situation t
WTjt: wait time for ridehailing service in choice situation t
: independently and identically distributed draw from a standard normal distribution
: standard deviation of the normal deviate that generates that error component
3. Findings
The modeling results are presented in Table 2. The model showed that IVTT had a positive and significant effect on choosing ridehailing over carsharing, and that the walking time associated with car2go significantly decreased its utility. The waiting time associated with ridehailing services was negative but statistically non-significant at the 95% confidence level. The error component for ridehailing is large and highly significant, indicating a strong correlation between the utilities of UberX and Lyft.
The VOTT can be estimated from the coefficients of travel time and price parameters. However, since the coefficient of travel time in our model only represents the effect of IVTT on the difference in utility of ridehailing relative to carsharing, we can only calculate the difference in VOTT of individuals when using ridehailing versus carsharing modes. This is, however, our principal objective. Using coefficients from the estimated model, we estimated a $23 per hour difference in VOTT between ridehailing and carsharing users:
ΔVOTT=βIVTTβprice ∗60=0.1230.318∗60=23.2 $/hr
Although our model does not directly support an inference of VOTT for driving (due to the lack of variation in the displayed IVTT values in the dataset), we can infer the difference in VOTT for driving and being driven based on the VOTT for walking. Using coefficients from the estimated model, the VOTT while walking is:
VOTTwalk=0.4160.318∗60=78.5 $/hr
Conventionally, VOTT for walking is valued at 100% of the traveler’s wage rate, while VOTT for driving is valued at half that amount for local personal travel (White 2016). Applying this ratio, the VOTT for driving in our sample would be approximately $39/hour, and thus the difference of $23/hour would constitute a 59% reduction in VOTT when being driven instead of driving.
This is higher than the range of 13-40% reduction in VOTT for traveling by ridehailing relative to driving a car that is reported in prior literature studying similar concepts (mainly stated preference studies) (de Looff et al. 2018; Gao, Ranjbari, and MacKenzie 2019; Kolarova, Steck, and Bahamonde-Birke 2019). This discrepancy could be due to the revealed preference setting of the present work versus stated preference in the prior literature. It might also be that VOTT when driving a shared vehicle (car2go) is higher than when driving a personal vehicle (e.g., due to less comfort and familiarity with the vehicle).
In summary, we found that the VOTT for car travelers drops by $23/hr (approximately 60%) when time spent driving is replaced by time spent being driven in a car, showing that there is a substantial time savings benefit in eliminating burden of driving for car travelers.