Loading [Contrib]/a11y/accessibility-menu.js
Skip to main content
null
Findings
  • Menu
  • Articles
    • Energy Findings
    • Resilience Findings
    • Safety Findings
    • Transport Findings
    • Urban Findings
    • All
  • For Authors
  • Editorial Board
  • About
  • Blog
  • covid-19
  • search

RSS Feed

Enter the URL below into your favorite RSS reader.

https://findingspress.org/feed
Urban Findings
March 02, 2024 AEST

How Do Neighborhood Attributes Relate to Life Satisfaction and Neighborhood Satisfaction Differently?

Xinyi Wu, Jason Cao, Yingling Fan, Anu Ramaswami,
Satisfactionneighborhoodnon-linear effectsubjective well-beinggradient boosting decision tree
Copyright Logoccby-sa-4.0 • https://doi.org/10.32866/001c.92769
Findings
Wu, Xinyi, Jason Cao, Yingling Fan, and Anu Ramaswami. 2024. “How Do Neighborhood Attributes Relate to Life Satisfaction and Neighborhood Satisfaction Differently?” Findings, March. https:/​/​doi.org/​10.32866/​001c.92769.
Save article as...▾
Download all (2)
  • Figure 1. Locations of Selected Neighborhoods
    Download
  • Supplement Information
    Download

Sorry, something went wrong. Please try again.

If this problem reoccurs, please contact Scholastica Support

Error message:

undefined

View more stats

Abstract

Neighborhood attributes may have different relationships with neighborhood satisfaction and life satisfaction. However, few studies have compared linkages between the neighborhood environment and these two satisfaction outcomes. This study fills this gap by illustrating how the same neighborhood attributes relate to neighborhood satisfaction and life satisfaction differently. Results indicate that the neighborhood environment has a stronger association with neighborhood satisfaction than with life satisfaction. Moreover, attributes pertinent to neighborhood appearance and basic features have the strongest connection with neighborhood satisfaction, whereas attributes regarding leisure activities and social cohesion show more substantial correlations with life satisfaction than other neighborhood attributes.

1. Questions

Many studies have explored the relationships between neighborhood attributes and residents’ satisfaction with the neighborhood and with life (Mouratidis and Yiannakou 2022; Cao 2016; Pfeiffer et al. 2020). However, few have examined the essential constituents of neighborhood satisfaction and life satisfaction simultaneously and illustrated the potentially different correlations with the same attributes. If true, a consequence is that when emphasizing only one satisfaction outcome, planners may devalue neighborhood attributes that affect the other.

We fill this research gap by answering the following research questions:

  1. Which neighborhood attributes are critical to neighborhood satisfaction and life satisfaction, respectively?

  2. How are neighborhood attributes associated differently with neighborhood satisfaction and life satisfaction?

2. Methods

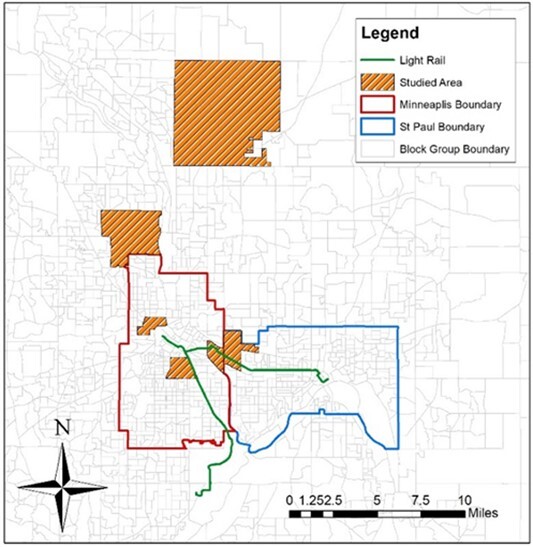
This study uses survey data collected in six neighborhoods in the Twin Cities, USA (Figure 1), including 360 valid observations. In the survey, life satisfaction was measured using the Satisfaction with Life Scale (SWLS) developed by Diener et al. (1985), and the neighborhood was listed as one of the life domains for participants to evaluate (Table 1). We gauged neighborhood attributes by asking respondents to indicate their satisfaction with 31 attributes in five categories on a five-point Likert scale (See Table S1 in the supplement file). The sampling plan and survey administration can be found in Wu et al. (2019).

Figure 1
Figure 1.Locations of Selected Neighborhoods
Table 1.Survey Items
Survey Items Questions/Statements Scale
Life Satisfaction In most ways my life is close to my ideal A seven-point scale from “strongly agree” to “strongly disagree”
The conditions of my life are excellent
I am satisfied with my life
So far I have gotten the important things I want in life
If I could live my life over, I would change almost nothing
Overall Neighborhood Satisfaction How satisfied or dissatisfied are you with your neighborhood? A five-point Likert scale from “very dissatisfied” to “very satisfied”

We employed the gradient boosting decision trees (GBDT) approach to analyze the correlations of neighborhood attributes with neighborhood satisfaction and life satisfaction. GBDT combines the results of multiple individual decision trees and reduces errors in the final model by correcting and learning from errors in each round of iterations. We carry out this algorithm using the “gbm” package in R (Ridgeway 2007). The main output of the GBDT models used in this study is relative influence, which refers to the increase in the squared error when an independent variable is excluded, relative to other predictors. It measures the relative contribution/importance of the independent variable to predict the dependent variable.

We built two GBDT models with neighborhood satisfaction and life satisfaction as dependent variables, respectively. In both models, independent variables included satisfaction with neighborhood attributes as well as socio-demographic variables (see Tables S2 and S3 in the supplement file).

3. Findings

In the neighborhood satisfaction model (Table 2), satisfaction with neighborhood attributes jointly accounts for almost 80% of the predictive power. Among the individual neighborhood attributes, the look of neighborhoods is the most impactful, with a relative influence of 17.83%. All the top four influential correlates of neighborhood satisfaction, “the look or design of the neighborhood”, “safety from crime in the neighborhood”, “neighborhood cleanliness”, and “noise in the neighborhood”, belong to the category of neighborhood characteristics in the survey. These influential variables describe the physical attributes of the neighborhood itself instead of the characteristics beyond the scope of the neighborhood (such as city services and availability of transportation options). This suggests that neighborhood satisfaction is predominantly associated with the features within the neighborhood, especially its appearance (look and design) and basic features (safety, cleanliness, and noise).

Table 2.Relative influences of attributes on neighborhood satisfaction
Model Statistics
The number of iterations 2,761
Squared Error Loss 0.24
R2 0.66
Collective Relative Influences (%)
Neighborhood Attributes (Total) 79.65
Socio-demographic Characteristics (Total) 20.35
Important Attributes (with a relative influence larger than 2%)
Important Neighborhood Attributes Relative influence (%)
The look or design of the neighborhood 17.83
Safety from crime in your neighborhood 12.78
Neighborhood cleanliness 10.38
Noise in the neighborhood 9.86
All accessibility-related variablesa 8.60
Relations with residents of your neighborhood 4.46
Street cleaning in your neighborhood 2.58
Air quality in the neighborhood 2.52
Ability to participate in neighborhood decisions that impact you/your family 2.25
Important Socio-demographic Characteristics Relative influence (%)
Years living in the neighborhood 6.28

a This variable summarizes the relative influences of all the eleven accessibility-related variables in the survey.

In the life satisfaction model, all the neighborhood attributes contributes to 52% of the power of predicting life satisfaction (Table 3). Individually, no attribute shows a dominant correlation with life satisfaction. When added together, accessibility-related variables show the strongest correlation (13.09%), followed by two individual attributes: the “ability to participate in neighborhood decisions that impact you/your family” and “parks and playgrounds in your neighborhood.” These correlates are related to the need for accessibility, social interaction, and leisure activities. Life satisfaction has substantial associations with a few socio-demographic variables. Income (19.7%), vehicle ownership (6.0%), and being white or not (8.5%) show considerable influences on life satisfaction.

Table 3.Relative influences of attributes on life satisfaction
Model Statistics
The number of iterations 3,447
Squared Error Loss 84.99
R2 0.54
Collective Relative Influences (%)
Neighborhood Attributes (Total) 51.98
Socio-demographic Characteristics (Total) 48.02
Important Attributes (with a relative influence larger than 2%)
Important Neighborhood Attributes Relative influence (%)
All accessibility-related variables 13.09
Ability to participate in neighborhood decisions that impact you/your family 5.54
Parks and playgrounds in your neighborhood 5.36
Drainage in your neighborhood 3.97
Bike trail/paths in your neighborhood 3.29
Relations with residents of your neighborhood 3.18
The number of friends you have in your neighborhood 3.02
Noise in the neighborhood 2.44
Sidewalks in your neighborhood 2.42
Important Socio-demographic Characteristics Relative influence (%)
Income 19.7
Race Being White 8.5
Vehicle Ownership 6.0

The finding is consistent with the existing knowledge that life satisfaction is a complex construct affected by many domains of satisfaction besides the neighborhood, such as job satisfaction and marital satisfaction (Pavot and Diener 2008). With more factors coming into play, the effect of a single domain is limited[1]. The neighborhood is only one of the many aspects of people’s daily lives, thus having only a limited connection with life satisfaction. On the other hand, neighborhood satisfaction specifically evaluates the physical condition of the neighborhood, so it is highly correlated with neighborhood-related attributes. Socio-demographic characteristics also follow the same pattern. The most strongly-correlated socio-demographic variable in the neighborhood satisfaction mode is “years living in the neighborhood”, which is also highly correlated with residents’ experiences with the neighborhood itself. As for life satisfaction, the socio-demographic variables with the strongest correlations are income, vehicle ownership, and race. All three are less related to the neighborhood and more to personal wealth and defining characteristics.

Our findings substantiate the hypothesis implied by literature: life satisfaction and specific domain satisfactions react differently to the same environmental correlates. Because of the divergence, examining a single satisfaction outcome tells only part of a story. In particular, this study shows that investigating only neighborhood satisfaction will understate the role of attributes related to social interactions, leisure activities, and cognition in generating life satisfaction. By contrast, emphasizing only life satisfaction will regard basic features of residential neighborhoods as fruitless. In fact, all these attributes are important to residents’ subjective well-being. Therefore, future research should cover multiple satisfaction domains to illustrate the influences of neighborhood attributes in a holistic way.


  1. Our previous findings show that the neighborhood as a whole contributes about 12.91% to life satisfaction after controlling for other domain satisfaction and socio-demographic variables.

Submitted: August 19, 2023 AEST

Accepted: January 31, 2024 AEST

References

Cao, Xinyu Jason. 2016. “How Does Neighborhood Design Affect Life Satisfaction? Evidence from Twin Cities.” Travel Behaviour and Society 5 (September):68–76. https:/​/​doi.org/​10.1016/​j.tbs.2015.07.001.
Google Scholar
Diener, Ed, Robert A. Emmons, Randy J. Larsen, and Sharon Griffin. 1985. “The Satisfaction with Life Scale.” Journal of Personality Assessment 49 (1): 71–75. https:/​/​doi.org/​10.1207/​s15327752jpa4901_13.
Google Scholar
Mouratidis, Kostas, and Athena Yiannakou. 2022. “What Makes Cities Livable? Determinants of Neighborhood Satisfaction and Neighborhood Happiness in Different Contexts.” Land Use Policy 112 (January):105855. https:/​/​doi.org/​10.1016/​j.landusepol.2021.105855.
Google ScholarPubMed CentralPubMed
Pavot, William, and Ed Diener. 2008. “The Satisfaction with Life Scale and the Emerging Construct of Life Satisfaction.” The Journal of Positive Psychology 3 (2): 137–52. https:/​/​doi.org/​10.1080/​17439760701756946.
Google Scholar
Pfeiffer, Deirdre, Meagan M. Ehlenz, Riley Andrade, Scott Cloutier, and Kelli L. Larson. 2020. “Do Neighborhood Walkability, Transit, and Parks Relate to Residents’ Life Satisfaction?” Journal of the American Planning Association 86 (2): 171–87. https:/​/​doi.org/​10.1080/​01944363.2020.1715824.
Google Scholar
Ridgeway, G. 2007. “Generalized Boosted Models: A Guide to the Gbm Package.” Update 1 (1).
Google Scholar
Wu, Xinyi, Tao Tao, Jason Cao, Yingling Fan, and Anu Ramaswami. 2019. “Examining Threshold Effects of Built Environment Elements on Travel-Related Carbon-Dioxide Emissions.” Transportation Research Part D: Transport and Environment 75 (October):1–12. https:/​/​doi.org/​10.1016/​j.trd.2019.08.018.
Google Scholar

This website uses cookies

We use cookies to enhance your experience and support COUNTER Metrics for transparent reporting of readership statistics. Cookie data is not sold to third parties or used for marketing purposes.

Powered by Scholastica, the modern academic journal management system