1. QUESTIONS
In 2007, the city of Stockholm established congestion charges for the purpose of increasing accessibility and improving air quality (Karlström and Franklin 2009). The scheme consisted of a time-varying cordon toll, with peaks in the morning (7:30-8:30 am) and in the afternoon (4:00-5:30 pm) (Table S1). Over an introductory period, green vehicles (GVs) were exempt from charges to incentivize their purchase, while conventional vehicles (CVs) were subject to tolls. (Here, GVs are defined as vehicles following the description of “clean vehicles” in Hugosson and Algers (2011) regarding fuel type.) Nevertheless, following a rapid increase in GV sales and a concern that the congestion reductions could be undermined, the exemption was phased out on January 1st, 2009, for newly registered GVs, and on July 1st, 2012, for GVs registered prior to January 1st, 2009. Consequently, in 2012, older GVs faced a toll price increase while CVs and newer GVs saw no toll price change.
Seeing the temporary exemption for a subset of the fleet as a natural experiment, the objective of the current study is to investigate whether GVs changed their cordon-crossing behavior after the termination of the exemption. In this assessment, CVs constitute the control group. Specifically, the research questions are:
-
Was there a reduction in the number of cordon crossings (i.e. number of times that vehicles crossed toll stations)?
-
Focusing on cars that traveled both years, was there a shift in cordon crossing times (i.e. time of the day that a vehicle crossed the toll station), in terms of mean and variance?
-
Did the number of crossings in the peak toll period decrease?
2. METHODS
2.1. Data
The Swedish Transport Agency operates Sweden’s congestion pricing systems, billing vehicle owners monthly through the use of automated number plate recognition. During tolling periods, such data are collected continuously, and then linked to vehicle registry data and archived for billing and reporting. For the current study, the agency provided a set of anonymized records for all detected GVs and a random sample of CVs. While the vehicle identification numbers were encrypted, a recycled encryption key allowed matching between similar 2-week periods in 2012 and 2013 records so that changes in crossing patterns for the same vehicle could be measured. Data were collected in 2012 and 2013 on working days between May and June from 6:30 am to 6:30 pm.
2.2. Study samples
We select a sample of vehicles, based on the anonymized encrypted vehicle ID numbers, with relatively consistent behavior and define them as morning commuters, namely cars that crossed the toll cordon in 2012 and 2013 on at least three different days, before 12:00, on each year’s 2-week study period.
2.3. Statistical analyses
The empirical analyses were grounded in various statistical tests, as listed in Table 1. Essentially, we compare cordon crossing events in 2012 and 2013 for both GVs and CVs (control), focusing on morning trips (6:30 am – 12:00 am). As the data was not normal, all tests are non-parametric. Primarily, we examine whether there was a change in the number of trips after the introduction of the toll. Here, we account for cars present in the data set in either year.
Then, we investigate the change in prevailing crossing time, focusing on vehicles in the data set that travel both years. To compare crossing times in the presence of different numbers of trips by the same vehicle, we analysed all pairwise comparisons between the study years for the vehicle; for instance, if a vehicle has three observations in 2012 and two in 2013, we create six pairs.
Lastly, we study peak-toll behavior by comparing the number of crossings in the peak toll interval both years, as well as the share of peak-toll crossings to other crossings.
3. FINDINGS
The analyses suggested three key findings:
-
For GVs, but not for CVs, the number cordon crossings decreased substantially between 2012 and 2013, from 69,563 to 46,764 (32.8%) (Table 2). A whole-sample comparison of the distributions of the number of crossings per car each year confirmed that there was a significant difference for GVs, with p = 1.7E-11 in a two-sided Wilcoxon test, but not for CVs (p = 0.08). A one-sided Wilcoxon test confirmed that the number of trips for GVs was reduced in 2013 (p = 8.6E-12).
-
The ending of the toll exemption seems to have resulted in a slight shift towards later travel times for GVs. In a comparison of the average crossing time per vehicle in 2012 vs. 2013 (two-sided Wilcoxon tests), we found significant shifts for GVs (p = 4.3E-6), but not for CVs. One-sided tests revealed that this shift was towards later times for GVs (p = 2.2E-6). However, analyses per car showed that the tendency to shift crossing time between 2012 and 2013 was similar for GVs and CVs (Table S1).
-
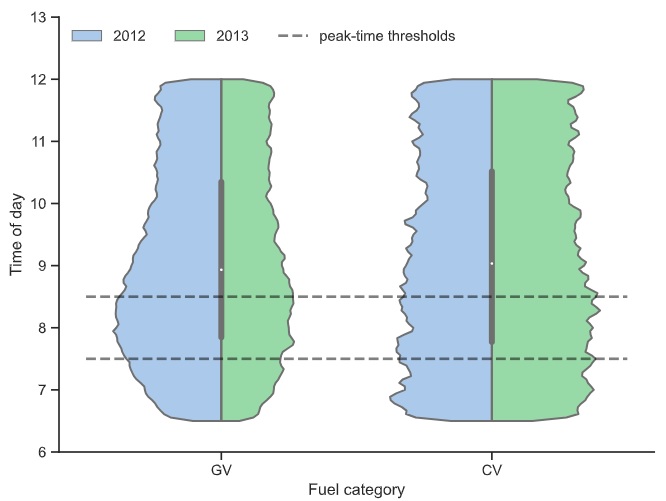
The omission of the toll exemption resulted in a reduction of traffic in the peak-toll period (7:30-8:30 am) in 2013 vs. 2012, as illustrated in Figure 1. Statistical tests that compare the number of cordon crossings during this time interval show a significant difference between 2012 and 2013 for GVs (p = 3.5E-4), but not for CVs (Table 3). A one-sided test confirmed that there was a significant decrease in the number of peak crossings for GVs in 2013 (p = 1.7E-4). Consistently, the ratio of peak-toll crossings to crossings at other times in the morning was different for GVs, but not for CVs (Table 3). Further, the variance was different in 2013 vs. 2012 for GVs (Levene test of variance p = 7.2E-3), but not for CVs.

In conclusion, the results indicate that the termination of the toll exemption for GVs had a considerable effect on the number of morning crossings, in particular on the number of crossings in the peak-toll period. There is also some, albeit limited, evidence that remaining trips shifted towards later morning crossing times. Note that we lacked information regarding which vehicles were exempted from payment, which suggests our findings to be an underestimate of the true behavioral impact of the toll.