Loading [Contrib]/a11y/accessibility-menu.js
Skip to main content
null
Findings
  • Menu
  • Articles
    • Energy Findings
    • Resilience Findings
    • Safety Findings
    • Transport Findings
    • Urban Findings
    • All
  • For Authors
  • Editorial Board
  • About
  • Blog
  • covid-19
  • search

RSS Feed

Enter the URL below into your favorite RSS reader.

http://localhost:5959/feed
Transport Findings
June 07, 2023 AEST

The Impact of 2020 Low Traffic Neighbourhoods on Levels of Car/Van Driving among Residents: Findings from Lambeth, London, UK

Anna Goodman, Anthony A. Laverty, Jamie Furlong, Rachel Aldred,
motor traffic reductionlow traffic neighbourhoodmodal filtercar drivingmotor vehicle driving
Copyright Logoccby-sa-4.0 • https://doi.org/10.32866/001c.75470
Findings
Goodman, Anna, Anthony A. Laverty, Jamie Furlong, and Rachel Aldred. 2023. “The Impact of 2020 Low Traffic Neighbourhoods on Levels of Car/Van Driving among Residents: Findings from Lambeth, London, UK.” Findings, June. https:/​/​doi.org/​10.32866/​001c.75470.
Save article as...▾
Download all (6)
  • Figure 1. Map of the four LTNs introduced in Lambeth in 2020 and in scope for the present study
    Download
  • Figure 2. Flow chart of cars and vans included in our study samples for ‘pre’ and ‘post’ analysis
    Download
  • Figure 3. Mean past-year driving over time among parking permits holders inside the LTNs and in the control area
    Download
  • SI1
    Download
  • SI2
    Download
  • SI3
    Download

Sorry, something went wrong. Please try again.

If this problem reoccurs, please contact Scholastica Support

Error message:

undefined

View more stats

Abstract

We examined how residents’ driving changed after the implementation of low traffic neighbourhoods (LTNs) in Lambeth, London. We used postcode plus numberplate data from controlled parking zones, matched to annual MOT records. From 2018-2020 (‘pre’) to 2021-2023 (‘post’), mean past-year driving decreased by 0.7km/day among residents living inside the new LTNs and increased by 0.6km/day among residents in control areas elsewhere in Lambeth. This represents a difference-in-differences decrease of 1.3km/day (95% confidence interval 0.3 to 2.4) in LTN versus control areas, or a 6.4% relative decrease. Our findings suggest that residents started driving less once their area became an LTN.

1. QUESTIONS

Low Traffic Neighbourhoods (LTNs) are area-wide measures that use ‘modal filters’ to restrict through motor traffic on residential streets (Supplemental Information 1 provides an example). The aim is to discourage driving while simultaneously creating safer and more pleasant walking and cycling environments.

Some critics have raised concerns that LTNs could increase total car kilometres travelled by forcing drivers to use more circuitous routes for some trips. Survey evidence from Outer London does not suggest this, with LTN residents instead tending to spend more time walking and/or cycling each week, and less time travelling by car (Aldred and Goodman 2021). This survey evidence is, however, limited by small sample sizes.

This study therefore used annual vehicle mileage data to examine the impact of new LTNs on car/van travel by residents in the London Borough of Lambeth.

2. METHODS

The north of Lambeth is covered by controlled parking zones, with residents requiring a permit for on-street car/van parking on their local streets. Lambeth Council provided us with numberplate plus home postcode data for active ‘resident’ and ‘disabled’ parking permits as of 1st March 2018, 1st March 2020, and 1st March 2023. See Supplemental Information 2 for details.

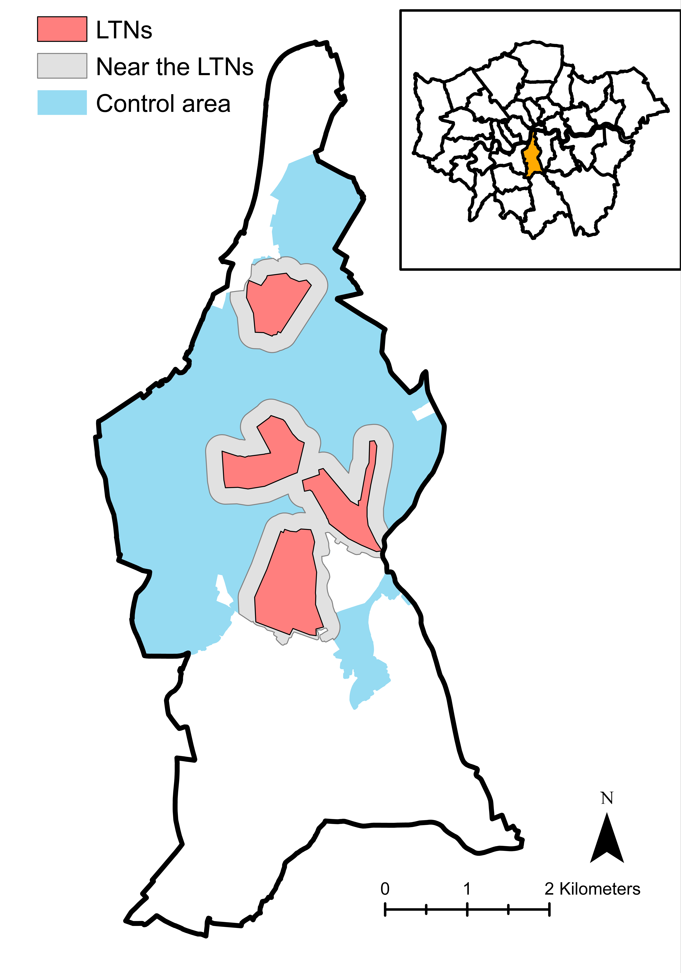
Lambeth implemented five LTNs between June and September 2020, and then no further LTNs as of March 2023. Four of the 2020 LTNs are covered by controlled parking zones, and in scope for this study (Figure 1).

Figure 1
Figure 1.Map of the four LTNs introduced in Lambeth in 2020 and in scope for the present study

The main map shows the London Borough of Lambeth. The inset map shows Lambeth within London, UK. LTNs = low traffic neighbourhoods. Near the LTNs = parts of Lambeth covered by controlled parking zones, outside the Central Activity Zone, and <200m crow-flies from the edge of one of the four study LTNs. Control area = parts of Lambeth covered by controlled parking zones, outside the Central Activity Zone, and ≥200m crow-flies from the edge of one of the four study LTNs.

Residential postcodes contain around 60 individuals. Lambeth contains 3006 residential postcodes that a) have been in use and covered by controlled parking zones across the period March 2018 to March 2023, b) lie outside of Central London,[1] and c) were given as the home address for at least one parking permit holder in March 2018, 2020, or 2023. We divided these postcodes into three non-overlapping groups (see also Figure 1):

  1. ‘Inside the LTNs’: postcode centroid inside one of the four study LTNs.

  2. ‘Near the LTNs’: postcode centroid <200m crow-flies from the edge of a study LTN.[2]

  3. ‘Control area’: postcode centroid ≥200m crow-flies from the edge of a study LTN.

These groups generally had similar demographic and socio-economic characteristics (Table 1).

Table 1.Characteristics of residents living in postcodes inside the LTNs, near the LTNs, and in the control area
Inside the LTNs Near the LTNs Control area
No. postcodes 511 571 1924
No. residents 26,540 31,528 104,605
Sex Male 48% 48% 49%
Female 52% 52% 51%
Age 0 to 4 years 4% 4% 5%
5 to 17 years 11% 13% 14%
18 to 64 years 76% 76% 73%
65+ years 8% 7% 8%
Ethnicity White 59% 54% 57%
Black 23% 26% 24%
Asian 5% 6% 6%
Mixed or other 13% 14% 13%
Disability Not disabled 87% 87% 87%
Limited a little by disability 8% 8% 8%
Limited a lot by disability 5% 5% 5%
Household car None 60% 65% 59%
ownership 1 car 34% 29% 34%
2 cars 5% 5% 6%
3 or more cars 1% 1% 1%
Economic Full-time employed 50% 49% 48%
activity Part-time employed 10% 11% 10%
Unemployed 5% 6% 5%
Other economically active 11% 10% 11%
Retired 8% 6% 8%
Other economically inactive 16% 18% 18%
Household Not deprived in any dimension 51% 48% 51%
deprivation Deprived in 1 dimension 31% 32% 32%
Deprived in 2 dimensions 14% 15% 13%
Deprived in 3 dimensions 4% 4% 4%
Deprived in 4 dimensions 0.3% 0.3% 0.3%
Usual main Work from home 4% 4% 5%
commute Bicycle 10% 9% 9%
mode: 2011 Walk 7% 7% 8%
Private motor vehicle 12% 11% 13%
Public transport or other 67% 69% 66%
Usual main Work from home 52% 50% 50%
commute Bicycle 6% 5% 6%
mode: 2021 Walk 5% 6% 6%
Private motor vehicle 9% 9% 9%
Public transport or other 27% 30% 28%
Distance from <2km 0% 0% 3%
centre of 2-3.9km 23% 24% 25%
London 4-5.9km 47% 60% 51%
6-7.9km 30% 15% 21%
8km 0% 0% 0.2%
Mean distance (km) 4.1 3.8 3.8
Area deprivation Less deprived half 19% 17% 30%
relative to all London More deprived half 81% 83% 70%

LTN = Low traffic neighbourhood. km = kilometres. Percentages calculated as a proportion of all residents, except household car ownership and household deprivation (calculated as a proportion of households), economic activity (calculated as a proportion of residents aged 16-74) and commute mode (calculated as a proportion of people in employment). All data comes from the 2021 Census except a) usual main commute mode in 2011, which uses the 2011 Census, b) area deprivation, which uses the Indices of Multiple Deprivation (total deprivation domain) from 2019, and c) distance from central London, which we calculated as the crow-flies distance from Charing Cross station. We assigned Census characteristics to postcodes based on data at the Output Area level. Output Areas are the smallest geographical scale at which Census data is available and contain around 300 individuals (i.e., around 5 times larger than postcodes). We assigned to each postcode the characteristics of the Output Area that contained the postcode centroid, assuming that the distribution of demographic and socio-economic characteristics was uniform across all postcodes within a given Output Area. We pooled results across all LTN and control postcodes after weighting by the estimated postcode population. This estimated postcode population was calculated on the assumption that an Output Area’s population was evenly distributed across its constituent postcodes.

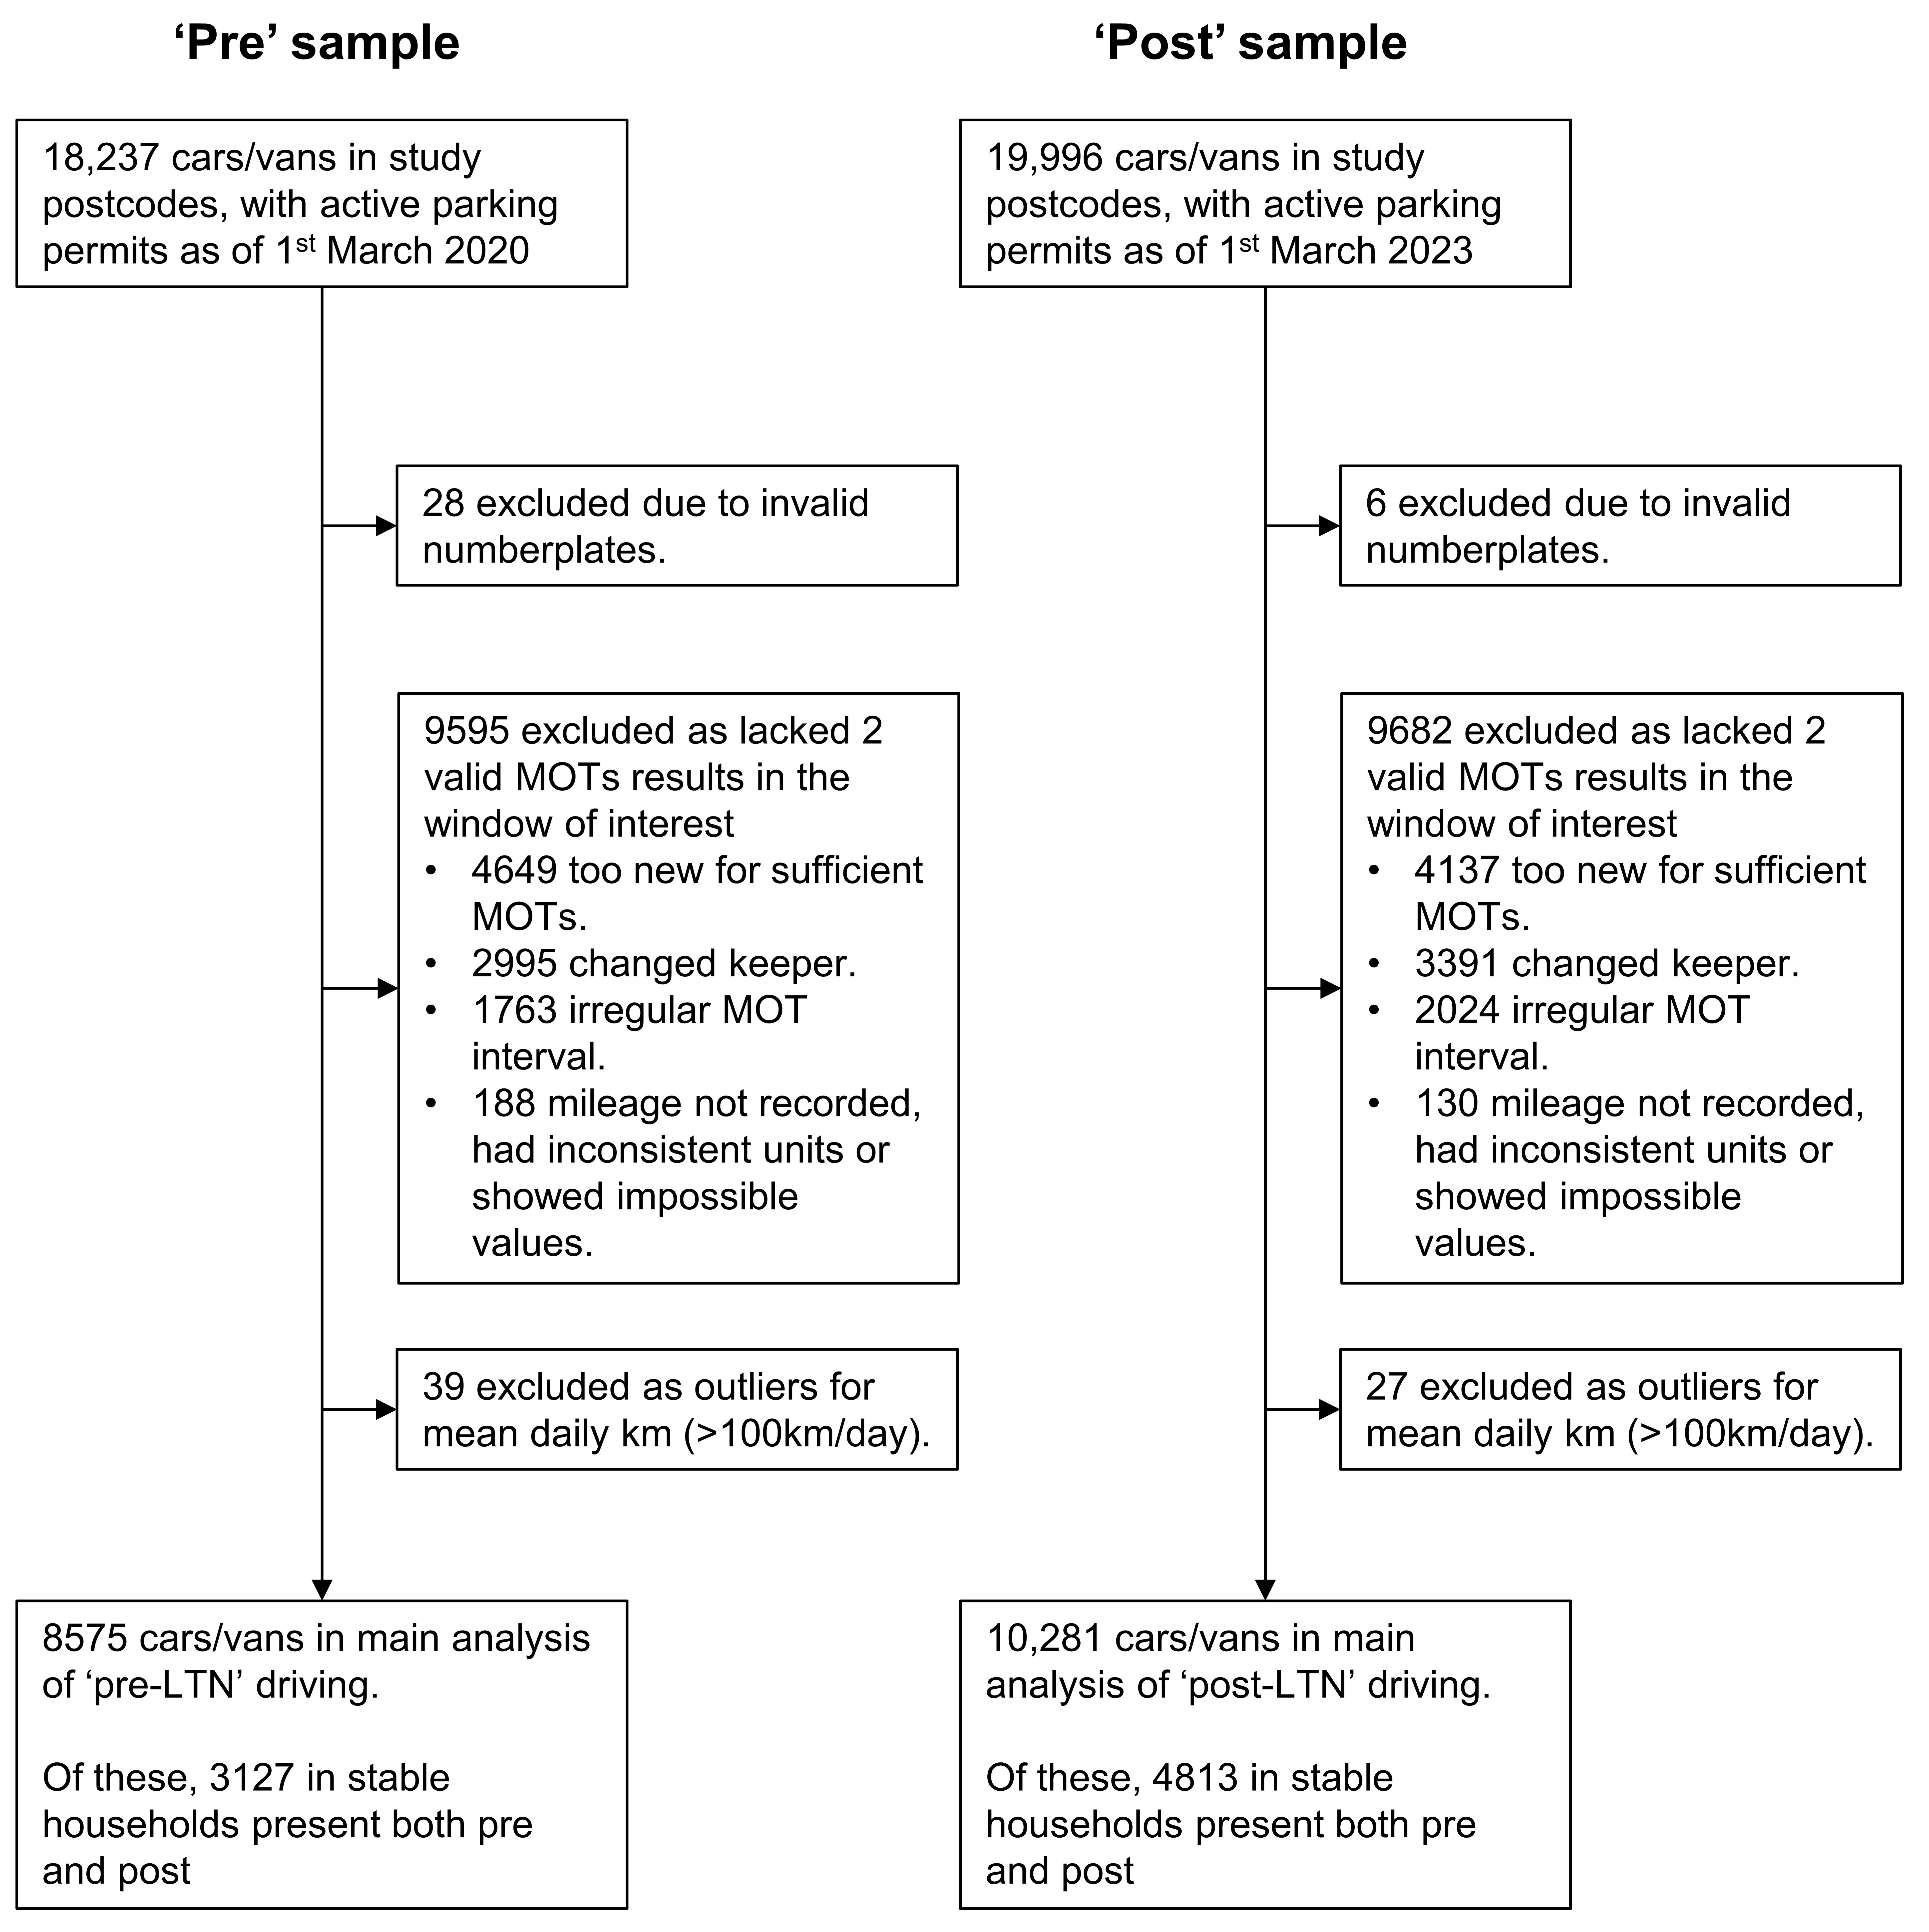
In the UK, all cars and vans that are three or more years old must undergo an ‘Ministry of Transport (MOT) test’ every 12 months. This includes recording vehicle mileage on the odometer. Among cars/vans with an active permit as of 1st March 2020, we identified 8575 cars/vans in scope for our analysis of ‘pre-LTN’ mileage, following the criteria summarised in Figure 2. For these vehicles we compared odometer readings between successive annual MOTs in the window 1st March 2018 to 1st March 2020, and used this to generate mean past-year daily kilometres before the implementation of LTNs. Similarly, among cars/vans with an active permit as of 1st March 2023, we identified 10,281 cars/vans in scope for our analysis of ‘post-LTN’ mileage. For these we compared odometer readings between successive annual MOTs in the window 1st March 2021 to 1st March 2023, to generate mean past-year daily kilometres after the implementation of LTNs. See Supplemental Information 2 for more details.

Figure 2
Figure 2.Flow chart of cars and vans included in our study samples for ‘pre’ and ‘post’ analysis

See Supplemental Information 2 for further details and for an equivalent flow chart for our analysis of cars/vans with active parking permits as of 1st March 2018

Finally, among cars/vans with an active permit as of 1st March 2018, we used equivalent methods to examine past-year driving for 7367 cars/vans in the window 1st March 2016 to 1st March 2018. We did this to examine whether any pre/post changes observed between 2020 and 2023 might be a continuation of longer-term trends.

Our primary analysis included all cars/vans. Secondary analyses 1) restricted the sample to ‘stable households’ with the same vehicle present at the same address in both 2020 and 2023, and 2) stratified by small-area deprivation, as defined by the Index of Multiple Deprivation.

3. FINDINGS

Between 2020 and 2023, the total number of active parking permits increased by 9.0% inside the LTNs (from 3546 to 3866); by 8.7% near the LTNs (2917 to 3172); and by 10.1% in the control area (11,774 to 12,958).[3]

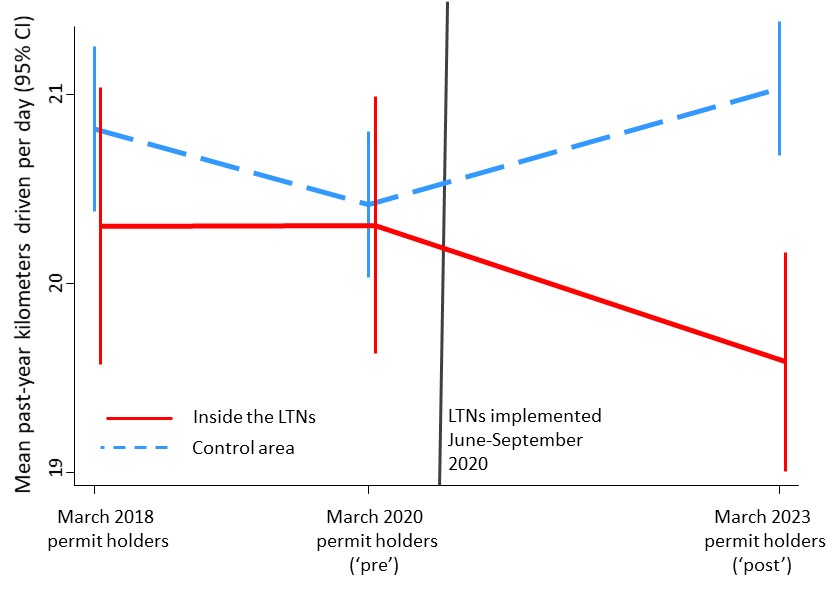
The pre/post change in mean past-year driving was -0.7km/day among residents living inside the LTNs (from 20.3km/day to 19.6km/day), and +0.6km/day among residents in the control area (20.4km/day to 21.0km/day: see Table 2). This corresponds to a difference-in-differences effect of -1.3km/day (95%CI -2.4 to -0.3) in the LTN versus control areas, or a 6.4% decrease in relative terms.

Table 2.Average daily driving time, pre- and post-LTN implementation: main analysis
Inside the LTNs Near the LTNs Control area
No. cars and vans in analysis, pre/post 1700 / 2025 1352 / 1658 5523 / 6598
Mean daily km (SE), pre 20.3 (0.3) 20.3 (0.4) 20.4 (0.2)
Mean daily km (SE), post 19.6 (0.3) 20.7 (0.4) 21.0 (0.2)
Change in km (SE), post minus pre -0.7 (0.5) 0.3 (0.5) 0.6 (0.3)
Difference-in-differences change in km (95% CI), relative to the control area -1.3 (-2.4, -0.3) -0.3 (-1.4, 0.9)
p-value for difference-in-differences effect p=0.01 p=0.64

CI = confidence interval, LTN = Low traffic neighbourhood. km = kilometres. SE = standard error. As outlined in Figure 2 and Supplemental Information 2, the ‘pre’ sample covers cars/vans with an active permit on 1st March 2020, and with two valid MOTs in the window 1st March 2018 to 1st March 2020. The ‘post’ sample covers cars/vans with an active permit on 1st March 2023, and with two valid MOTs in the window 1st March 2021 to 1st March 2023. Difference-in-differences point estimates, confidence intervals and p-values were calculated as interaction terms in linear regression analyses, with daily km as the outcome and fitting an interaction term between pre/post status and LTN status. Results were similar in sensitivity analyses a) excluding outliers with a mean daily km >50km; b) not excluding outliers and using log-transformed daily km as the outcome; and c) additionally adjusting for deprivation (two categories: less deprived versus more deprived half relative to all of London) and distance from central London (three categories: <4km, 4-5km 6-8km).

This pre/post divergence between the LTN and control areas was not just a continuation of pre-existing trends. On the contrary, when comparing 2018 and 2020 permit holders, there was no evidence of a difference between the areas inside the LTNs versus the control areas (Figure 3).

Figure 3
Figure 3.Mean past-year driving over time among parking permits holders inside the LTNs and in the control area

CI = confidence interval, LTN = Low traffic neighbourhood. Areas defined as shown in Figure 1, based on their location relative to the four LTNs implemented June to September 2020. To make the graph easier to read the area ‘near the LTNs’ is not included here but is shown in a version of the graph in Supplemental Information 3. Supplemental Information 3 also contains a table of these data.

A pre/post difference between the LTN and control areas was also seen in the subsample of ‘stable households’ with parking permits in both 2020 and 2023 (difference-in-differences effect -2.3km/day, 95%CI -3.9 to -0.7: Table 3). This suggests that the decrease in driving observed inside the LTNs was not simply due to ‘residential self-selection’, whereby households that drove a lot had left the LTNs and/or households that drove less had moved in. Instead, it indicates that existing residents were changing their behaviour and starting to drive less.

Table 3.Average daily driving time, pre- and post-LTN implementation: secondary analyses restricted to cars/vans in subsample of stable households present both pre and post
Inside the LTNs Near the LTNs Control area
No. cars and vans in analysis, pre/post 610 / 942 440 / 684 2077 / 3187
Mean daily km (SE), pre 18.9 (0.6) 18.9 (0.6) 18.3 (0.3)
Mean daily km (SE), post 17.3 (0.4) 18.6 (0.6) 19.0 (0.3)
Change in km (SE), post minus pre -1.5 (0.7) -0.3 (0.9) 0.7 (0.4)
Difference-in-differences change in km (95% CI), relative to the control area -2.3 (-3.9, -0.7) -1.0 (-2.9, 0.8)
p-value for difference-in-differences effect p=0.005 p=0.26

CI = confidence interval. LTN = Low traffic neighbourhood. km = kilometres. SE = standard error. The ‘pre’ sample covers cars/vans with an active permit on 1st March 2020, and with two valid MOTs in the window 1st March 2018 to 1st March 2020. The ‘post’ sample covers cars/vans with an active permit on 1st March 2023, and with two valid MOTs in the window 1st March 2021 to 1st March 2023. This analysis was restricted to cars/vans that were present at the same postcode in both 2020 and 2023 (see Figure 2 and Supplemental Information 2). Difference-in-differences point estimates, confidence intervals and p-values were calculated as interaction terms in linear regression analyses, with daily km as the outcome and fitting an interaction term between pre/post status and LTN status.

The pre/post difference between the LTN and control areas was observed both in more affluent areas and more deprived areas, with no evidence that the magnitude of the effect differed (difference-in-differences point estimates -1.5km/day in more affluent areas and -1.1km/day in more deprived areas, p=0.67 for heterogeneity between these strata: see Supplemental Information 3).

There was no evidence of a pre/post difference in the areas near the LTNs versus the control area (difference-in-differences effect -0.3km/day, 95%CI -1.4 to +0.9: Table 2).

In summary, our findings suggest that residents in Lambeth started driving less once their area became an LTN. Notably, our outcome measure captures total past-year driving, including trips that the Lambeth LTNs are less likely to impact (e.g., inter-city trips, or travel outside London). It is plausible that for shorter and more local trips the relative decrease in LTN residents’ driving would be greater than the estimated 6% decrease in total past-year driving. This suggests that, in Lambeth and other similar inner-city areas, widespread roll-out of LTNs could make an important contribution towards reducing how much residents drive, and towards reducing local volumes of motor traffic.


ACKNOWLEDGEMENTS

This study was approved by the Lambeth Information Governance team and received University Ethics Approval from the London School of Hygiene and Tropical Medicine (Project ID 27801). This study was not externally funded, being conducted with discretionary research time. AL is supported by the NIHR School for Public Health Research. We are grateful to the following Officers at Lambeth Council: Luuk van Kessel for helping set up the data sharing agreement with Lambeth Council; and Shievan Charles and Beth Cramman for preparing the datasets that Lambeth Council shared. Lambeth Council had no role in the design, analysis, or write-up of this study, nor any say over whether the results should be published. AG lives in Lambeth, outside of the study area.


  1. We introduced this restriction in recognition of the very different transport trends seen in Central London versus Inner London during the Covid-19 pandemic. Central London was defined as London’s ‘Central Activity Zone’. None of Lambeth’s LTNs lie inside the Central Activity Zone. The rest of Lambeth lies in ‘Inner London’.

  2. A 200m threshold was chosen as a distance that generated a roughly similar sample size in the ‘near the LTNs’ area as opposed to the ‘inside the LTNs’ area, i.e. providing a reasonable sample size but not ‘diluting’ any potential effect of living near an LTN by including postcodes further away. Our findings were similar if we used a 300m or 500m buffer instead of a 200m buffer to define areas ‘near the LTNs’. Note that this category included postcodes on surrounding boundary roads, i.e., roads that might plausibly see re-routed traffic from vehicles unable to pass through the LTN. It also included areas adjacent to the newly-created LTNs that were already low-traffic, having been designed to have no through routes (e.g., the Somerleyton Road/Loughborough Park triangle near Railton LTN, or St Martin’s estate near Tulse Hill LTN). The category of areas ‘near the LTNs’ used in the present study therefore differs from our focus in Aldred et al. (2021) where we specifically sought to identify areas around LTN boundary roads. Note also that this group does not include areas <200m from the edge of a Lambeth LTN but in a different borough, as we only had controlled parking zone data for Lambeth.

  3. Interpreting these changes is not straightforward without information on population change, which currently is not available at the small-area level beyond 2020. However, the similarity between the LTN and control areas suggests that the Lambeth LTNs have not seen a notable drop in car/van ownership. This contrasts with the 6% decrease in car/van ownership after two years observed in the longer-established LTNs in Waltham Forest (Goodman, Urban, and Aldred 2020). It is possible that any effects on car/van ownership in Lambeth have been slowed by 1) people being more reluctant to give up a car during the Covid-19 pandemic and/or 2) people waiting to see if Lambeth’s LTNs would be made permanent (unlike Waltham Forest, Lambeth initially introduced its four LTNs on a trial basis, and the decisions to make the schemes permanent were only announced between December 2021 and August 2022). Another potentially relevant contextual factor is that car ownership levels started from a lower baseline in inner-London Lambeth than in outer-London Waltham Forest. Future follow-up studies will be valuable to see if effects on car/van ownership do emerge in Lambeth over time.

Submitted: April 21, 2023 AEST

Accepted: May 18, 2023 AEST

References

Aldred, Rachel, and Anna Goodman. 2021. “The Impact of Low Traffic Neighbourhoods on Active Travel, Car Use, and Perceptions of Local Environment during the COVID-19 Pandemic.” Findings, March. https:/​/​doi.org/​10.32866/​001c.21390.
Google Scholar
Aldred, Rachel, Ersilia Verlinghieri, Megan Sharkey, Irena Itova, and Anna Goodman. 2021. “Equity in New Active Travel Infrastructure: A Spatial Analysis of London’s New Low Traffic Neighbourhoods.” Journal of Transport Geography 96 (October):103194. https:/​/​doi.org/​10.1016/​j.jtrangeo.2021.103194.
Google Scholar
Goodman, Anna, Scott Urban, and Rachel Aldred. 2020. “The Impact of Low Traffic Neighbourhoods and Other Active Travel Interventions on Vehicle Ownership: Findings from the Outer London Mini-Holland Programme.” Findings, December. https:/​/​doi.org/​10.32866/​001c.18200.
Google Scholar

This website uses cookies

We use cookies to enhance your experience and support COUNTER Metrics for transparent reporting of readership statistics. Cookie data is not sold to third parties or used for marketing purposes.

Powered by Scholastica, the modern academic journal management system