Loading [MathJax]/jax/output/SVG/jax.js
Skip to main content
null
Findings
  • Menu
  • Articles
    • Energy Findings
    • Resilience Findings
    • Safety Findings
    • Transport Findings
    • Urban Findings
    • All
  • For Authors
  • Editorial Board
  • About
  • Blog
  • covid-19
  • search

RSS Feed

Enter the URL below into your favorite RSS reader.

http://localhost:9521/feed
Resilience Findings
June 16, 2022 AEST

Resilience of Supply Chain Networks to Labor Disruptions

Anna Nagurney, Ph.D., Alireza Ermagun, Ph.D.,
networkslaborsupply chain performance efficiencyresiliencesupply chain managementsupply chainsupply chain resiliencesupply disruptionscapacity resilience
Copyright Logoccby-sa-4.0 • https://doi.org/10.32866/001c.36315
Photo by Adrian Sulyok on Unsplash
Findings
Nagurney, Anna, and Alireza Ermagun. 2022. “Resilience of Supply Chain Networks to Labor Disruptions.” Findings, June. https:/​/​doi.org/​10.32866/​001c.36315.
Save article as...▾
Download all (4)
  • Figure 1. The Supply Chain Network Topology
    Download
  • Figure 2. Supply Chain Network Topology for SCN 1 and SCN 2
    Download
  • Figure 3. Supply Chain Network Topology for SCN 3, SCN 4 and SCN 5
    Download
  • Supplemential Information
    Download

Sorry, something went wrong. Please try again.

If this problem reoccurs, please contact Scholastica Support

Error message:

undefined

View more stats

Abstract

This study introduces a supply chain network efficiency measure for networks with labor and associated bounds on labor availability. It also proposes two resilience measures with respect to (1) labor availability disruptions and (2) labor productivity disruptions. Solving five distinct supply chain network examples, we find (1) a free movement of labor across the supply chain network results in a higher efficiency of the supply chain as well as a higher resilience, (2) a reduction in labor productivity can impact the supply chain network efficiency and the corresponding resilience, and (3) the presence of electronic commerce escalates the efficiency of the supply chain network but diminishes resilience.

1. QUESTIONS

The COVID-19 pandemic has demonstrated the importance of labor to supply chain network economic activities from production and transportation to storage and the ultimate distribution of products to the demand markets. With workers getting ill from the coronavirus and many sadly perishing from the disease, the negative impacts of higher product prices and unfulfilled demand became all too common in economic sectors such as the food sector, the household product sector, lumber supplies, as well as high tech and healthcare (Helper and Soltas 2021; Nagurney 2022). The recognition that labor is a critical resource in supply chains and that disruptions to labor can have unforeseen global consequences has led to the development of both optimization and game theory supply chain network models with the inclusion of labor needed for supply chain activities and with the productivity of labor incorporated, along with relevant constraints as to the availability of labor (Nagurney 2021b, 2021c, 2022).

In parallel, the theme of resilience of supply chains has resonated in the pandemic. Supply chain resilience, with seminal contributions (e.g., Kleindorfer and Saad (2009); Wagner and Bode (2006); Nagurney (2006); Tang (2006); Tang and Tomlin (2008); Nagurney and Qiang (2009); Nagurney et al. (2013); Sheffi (2015)) has garnered renewed interest from both academics and practitioners (Ivanov and Das 2020; Ivanov and Dolgui 2020; Sodhi and Tang 2021; Ozdemir et al. 2022; Ramakrishna 2022). This is in part due to (1) Russia’s war against Ukraine (Zaliska et al. 2022), (2) climate change and the increasing number of natural disasters, and (3) the number of people affected by them (Nagurney 2021a; Novoszel and Wakolbinger 2022). This necessitates having a tool that can quantify the resilience of a supply chain network to labor disruptions.

This study builds on the earlier contributions of Nagurney and Qiang (2009) in quantifying the efficiency of critical infrastructure networks as well as those of Qiang, Nagurney, and Dong (2009) and Li and Nagurney (2017) in assessing the performance of supply chain networks specifically. The framework constructed here, however, allows one to quantify the resilience of a supply chain network subject to the reduction of labor availability (capacities) or under a reduction in labor productivity. The former situation can arise, for example, as a consequence of illness, death, being unable or unwilling to work, labor strikes, or being called to war or other types of service. The latter situation can arise because of the need for social distancing, a decrease in productivity due to long COVID or other illness or stressors, or fatigue. Our framework, in particular, helps answer the following questions:

  • Question 1: What is the impact on efficiency and on resilience of allowing workers to perform different tasks in a supply chain network, with the constraint represented by a single bound on labor, as opposed to bounds on labor on each supply chain network link?

  • Question 2: Does resilience with respect to labor availability yield similar results to resilience with respect to labor productivity?

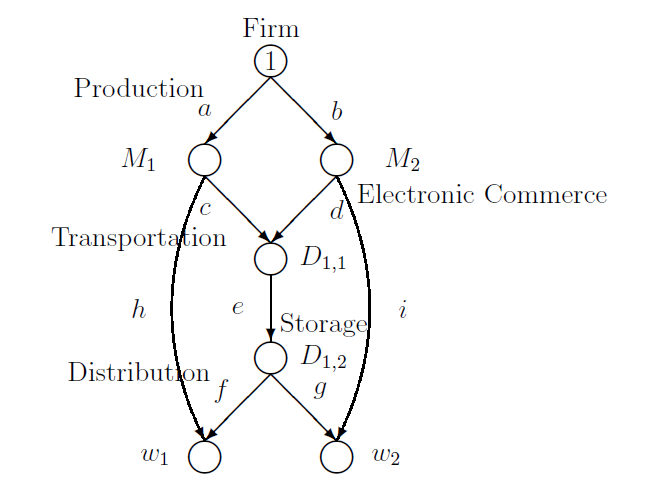
  • Question 3: What can be the effect of a modification in the supply chain network topology, for example, as in the case of the introduction of electronic commerce, on network efficiency and resilience?

2. METHODS

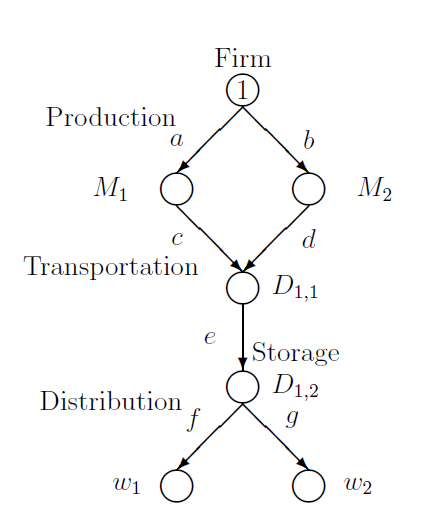
We consider a supply chain network with the general topology depicted in Figure 1, with the topology being adapted for the specific supply chain under consideration. The topology is represented by the graph G=[N,L], where N is the set of nodes and L is the set of links.

Figure 1
Figure 1.The Supply Chain Network Topology

The efficiency of a supply chain network, E, is formally defined by Equation 1. Here, the demands, d∗, and the incurred demand market prices, are evaluated at the optimal value of the firm profit, subject to supply chain network flow constraints in existing markets, and with the labor constraints of interest formulated in Supplemental Information. A supply chain is evaluated as performing better if, on the average, it can handle higher demands at lower prices.

E=E(G,ˆc,ρ,π,α,ˉl)≡∑w∈Wd∗wρw(d∗)J

Table 1.Nomenclature
a: A typical link
p: A typical path
w: A typical demand market
nM: Possible production locations
nD: Distribution centers for storage
J: Number of demand markets
W: Set of demand markets
ρw: Price at a demand market w
ρ: A vector of prices
ˆca: Total cost on link a
ˆc: A vector of total costs
αa: A positive productivity factor of link a reflecting how much an hour of labor will yield in terms of product flow on that link
α: A vector of link productivity factors
ˉl: Bound on labor, which will be a vector if the constraints are on individual links (Nagurney 2021b, 2021c)
πa: Wage on link a
π: A vector of wages that are paid for an hour of labor on a link

Using ideas in Nagurney and Qiang (2009) and in Nagurney and Li (2016) for supply chains, the importance of a component g (e.g., node, link, a combination of nodes and links), I(g), is defined by Equation 2. I(g) represents the efficiency drop when g is removed from the network.

I(g)=ΔEE=E(G,ˆc,ρ,π,α,ˉl)−E(G−g,ˆc,ρ,π,α,ˉl)E(G,ˆc,ρ,π,α,ˉl)

Following the definition of supply chain network efficiency, we propose two resilience measures with respect to labor availability disruptions (Rˉlγ) and labor productivity disruptions (Rαγ) formulated by Equation 3 and Equation 4, respectively. Here, ˉlγ denotes the reduction of labor availability with γ∈(0,1]. For example, if γ=0.9 this means that the labor availability associated with the labor constraints is 90% of the original labor availability as in E. The closer the value of our resilience measures to 100%, the greater the resilience.

Rˉlγ=Rˉlγ(G,ˆc,ρ,π,α,ˉl)=EˉlγE×100%

Rαγ=Rαγ(G,ˆc,ρ,π,α,ˉl)=EαγE×100%

We calculate E, Eˉlγ, Eαγ and the resilience measures Rˉlγ and Rαγ when γ=0.9,0.7,0.5,0.3,0.1 for five examples with supply chain network topology depicted in Figure 2 and Figure 3. Table 2 represents the characteristics of each example.

Figure 2
Figure 2.Supply Chain Network Topology for SCN 1 and SCN 2
Figure 3
Figure 3.Supply Chain Network Topology for SCN 3, SCN 4 and SCN 5
Table 2.Description of Supply Chain Network (SCN) examples used for the analysis
Example Description
SCN 1 It has the identical data to that in Example 1 - Baseline in Nagurney (2021b) with the exception that the link labor bounds ˉla=10,000 for all links a∈L.
SCN 2 It has the same data as SCN 1, except that now there is a single bound on labor ˉl=70,000. In other words, labor is free to work on any link, provided that the sum of the labor hours does not exceed 70,000. Note that 70,000 is the sum of the labor bounds on all the links in SCN 1.
SCN 3 It has the identical data to that of SCN 1 except that now electronic commerce links h and i are added. The additional data for SCN 3 associated with the electronic commerce links are
ˆch(f)=f2h,ˆci(f)=f2i, πh=10.00,πi=10.00,αh=1.00,αi=1.00, ˉlh=10,000.00,ˉli=10,000.00.
SCN 4 It has the same topology and data as SCN 3 except that the labor availability constraint is for the entire supply chain with ˉl=90,000. The value of 90,000 is chosen since there are 9 links in SCN 3, with each link having a bound of 10,000 and, hence, there would be a total labor availability of 90,000 under the assumption that laborers would be free and interested in doing whichever tasks that are needed in the supply chain network with the productivity factors being as in SCN 3.
SCN 5 It has the same data as SCN 4, but now the labor hours available are no longer 90,000, rather there are only 70,000 hours available. Hence, the results for SCN 5 allow us to make a comparison with SCN 2 in terms of the impact of adding electronic commerce and having the same total amount of labor in the supply chain network available as before but having additional supply chain activities of electronic commerce.

3. FINDINGS

Table 3 depicts the efficiency and resilience measures for the five supply chain network examples. Our findings, which correspond with three questions alluded to in Section 1 are encapsulated in the following:

Table 3.Efficiency and Resilience Measures for SCN 1, SCN 2, SCN 3, SCN 4, and SCN 5
Efficiency and Resilience SCN 1 SCN 2 SCN 3 SCN 4 SCN 5
E 0.0667 0.0909 0.1424 0.1538 0.1538
Eˉl0.9 0.0658 0.0909 0.1263 0.1538 0.1538
Eˉl0.7 0.0505 0.0909 0.0956 0.1538 0.1538
Eˉl0.5 0.0357 0.0909 0.0665 0.1538 0.1538
Eˉl0.3 0.0212 0.0909 0.0388 0.1538 0.1538
Eˉl0.1 0.0071 0.0909 0.0126 0.1538 0.1538
Eα0.9 0.0658 0.0909 0.1263 0.1538 0.1538
Eα0.7 0.0505 0.0909 0.0956 0.1538 0.1538
Eα0.5 0.0355 0.0909 0.0665 0.1538 0.1391
Eα0.3 0.0210 0.0909 0.0388 0.1092 0.0877
Eα0.1 0.0069 0.0362 0.0126 0.0470 0.0362
Rˉl0.9 0.9872 1.0000 0.8872 1.0000 1.0000
Rˉl0.7 0.7571 1.0000 0.6712 1.0000 1.0000
Rˉl0.5 0.5351 1.0000 0.4467 1.0000 1.0000
Rˉl0.3 0.3178 1.0000 0.2727 1.0000 1.0000
Rˉl0.1 0.1064 1.0000 0.0886 1.0000 1.0000
Rα0.9 0.9870 1.0000 0.8872 1.0000 1.0000
Rα0.7 0.7566 1.0000 0.6712 1.0000 1.0000
Rα0.5 0.5327 1.0000 0.4467 1.0000 0.9044
Rα0.3 0.3149 1.0000 0.2727 0.7098 0.5704
Rα0.1 0.1035 0.3977 0.0886 0.3054 0.2350
  • First, comparing the results of SCN 1 with SCN 2 and SCN 3 with SCN 4, it is found that having labor be free to move across the supply chain network results in (1) a higher efficiency of the supply chain with the same total number of labor hours available and (2) a higher resilience with respect to both resilience measures and at different values of γ.

  • Second, the value of Rˉlγ is very similar to the corresponding Rαγ for the same value of γ for each supply chain network example. They are, indeed, identical in many cases, until the value of γ becomes 0.5 or lower. In this condition, the supply chain network resilience with respect to labor availability exceeds the resilience with respect to labor productivity as shown in SCN 1, SCN 2, SCN 4, and SCN 5. This suggests that the firms should take care of their workers since a reduction in labor productivity can impact the supply chain network efficiency and the corresponding resilience.

  • Third, comparing the results of SCN 5 with SCN 2, it is clear that the efficiency of the supply chain network with electronic commerce options (SCN 5) is consistently higher than that for the supply chain network without electronic commerce (SCN 2) at the same value of labor availability and disruption and at the same level of disruption to labor productivity on the links with the exception of the respective values of Eα0.3 (and those respective values are equivalent to two decimal points). In addition, both these supply chain networks, under the specific data, retain their efficiency under even restrictive disruptions to labor availability. However, that is not the case when there are disruptions to labor productivity. Interestingly, as can be seen from the values of Rαγ, SCN 2 that without electronic commerce is more resilient than SCN 5 for γ=0.5,0.3,0.1. This can be explained by noting that the available labor hour amount is divided among fewer supply chain network economic activities in the case of SCN 2. Again, we see, from the investigation of results for SCN 5 versus those for SCN 2, that labor productivity on the links, when disrupted, can have an even bigger impact on resilience than a disruption to labor availability.


Acknowledgments

This paper is dedicated to essential workers, who, in the pandemic, helped humanity, and to freedom-loving Ukrainians now fighting for peace in their sovereign nation against the Russian aggressors.

Submitted: May 05, 2022 AEST

Accepted: June 09, 2022 AEST

References

Helper, Susan, and Evan Soltas. 2021. “Why the Pandemic Has Disrupted Supply Chains.” Washington DC: The White House. https:/​/​www.whitehouse.gov/​cea/​written-materials/​2021/​06/​17/​why-the-pandemic-has-disrupted-supply-chains/​.
Ivanov, Dmitry, and Ajay Das. 2020. “Coronavirus (COVID-19/SARS-CoV-2) and Supply Chain Resilience: A Research Note.” International Journal of Integrated Supply Management 13 (1): 90. https:/​/​doi.org/​10.1504/​ijism.2020.107780.
Google Scholar
Ivanov, Dmitry, and Alexandre Dolgui. 2020. “Viability of Intertwined Supply Networks: Extending the Supply Chain Resilience Angles Towards Survivability. A Position Paper Motivated by COVID-19 Outbreak.” International Journal of Production Research 58 (10): 2904–15. https:/​/​doi.org/​10.1080/​00207543.2020.1750727.
Google Scholar
Kleindorfer, Paul R., and Germaine H. Saad. 2009. “Managing Disruption Risks in Supply Chains.” Production and Operations Management 14 (1): 53–68. https:/​/​doi.org/​10.1111/​j.1937-5956.2005.tb00009.x.
Google Scholar
Li, Dong, and Anna Nagurney. 2017. “Supply Chain Performance Assessment and Supplier and Component Importance Identification in a General Competitive Multitiered Supply Chain Network Model.” Journal of Global Optimization 67 (1–2): 223–50. https:/​/​doi.org/​10.1007/​s10898-015-0371-7.
Google Scholar
Nagurney, Anna. 2006. Supply Chain Network Economics: Dynamics of Prices, Flows, and Profits. Cheltenham: Edward Elgar Publishing. https:/​/​doi.org/​10.4337/​9781781008553.
Google Scholar
———. 2021a. “A Multiperiod Supply Chain Network Optimization Model with Investments in Labor Productivity Enhancements in an Era of COVID-19 and Climate Change.” Operations Research Forum 2 (4): 68. https:/​/​doi.org/​10.1007/​s43069-021-00112-w.
Google ScholarPubMed Central
———. 2021b. “Optimization of Supply Chain Networks with Inclusion of Labor: Applications to COVID-19 Pandemic Disruptions.” International Journal of Production Economics 235:108080. https:/​/​doi.org/​10.1016/​j.ijpe.2021.108080.
Google Scholar
———. 2021c. “Supply Chain Game Theory Network Modeling Under Labor Constraints: Applications to the Covid-19 Pandemic.” European Journal of Operational Research 3 (16): 880–91. https:/​/​doi.org/​10.1016/​j.ejor.2020.12.054.
Google ScholarPubMed CentralPubMed
———. 2022. “Supply Chain Networks, Wages, and Labor Productivity: Insights from Lagrange. Analysis and Computations.” Journal of Global Optimization. https:/​/​doi.org/​10.1007/​s10898-021-01122-y.
Google ScholarPubMed CentralPubMed
Nagurney, Anna, and Dong Li. 2016. Competing on Supply Chain Quality: A Network Economics Perspective. Springer International Publishing Switzerland. https:/​/​doi.org/​10.1007/​978-3-319-25451-7.
Google Scholar
Nagurney, Anna, and Qiang Qiang. 2009. Fragile Networks: Identifying Vulnerabilities and Synergies in an Uncertain World. Hoboken, New Jersey: John Wiley & Sons. https:/​/​doi.org/​10.1002/​9780470501139.biblio.
Google Scholar
Nagurney, Anna, Min Yu, Amir H. Masoumi, and Ladimer S. Nagurney. 2013. Networks Against Time: Supply Chain Analytics for Perishable Products. New York: Springer New York. https:/​/​doi.org/​10.1007/​978-1-4614-6277-4.
Google Scholar
Novoszel, Lydia, and Tina Wakolbinger. 2022. “Meta-Analysis of Supply Chain Disruption Research.” Operations Research Forum 3 (1): 1–25. https:/​/​doi.org/​10.1007/​s43069-021-00118-4.
Google ScholarPubMed Central
Ozdemir, Dilek, Mahak Sharma, Amandee Dhird, and Tugrul Daim. 2022. “Supply Chain Resilience During the COVID-19 Pandemic.” Technology in Society 68:101847. https:/​/​doi.org/​10.1016/​j.techsoc.2021.101847.
Google ScholarPubMed CentralPubMed
Qiang, Qiang, Anna Nagurney, and June Dong. 2009. “Modeling of Supply Chain Risk Under Disruptions with Performance Measurement and Robustness Analysis.” In Managing Supply Chain Risk and Vulnerability: Tools and Methods for Supply Chain Decision Makers, edited by Teresa Wu and Jennifer Blackhurst, 91–111. Berlin, Germany: Springer. https:/​/​doi.org/​10.1007/​978-1-84882-634-2_6.
Google Scholar
Ramakrishna, Yanamandra, ed. 2022. Handbook of Research on Supply Chain Resiliency, Efficiency, and Visibility in the Post-Pandemic Era. Hershey, Pennsylvania: IGI Global. https:/​/​doi.org/​10.4018/​978-1-7998-9506-0.
Google Scholar
Sheffi, Yossi. 2015. The Power of Resilience: How the Best Companies Manage the Unexpected. Cambridge, Massachusetts: MIT Press. https:/​/​doi.org/​10.7551/​mitpress/​9780262029797.001.0001.
Google Scholar
Sodhi, ManMohan S., and Christopher S. Tang. 2021. “Supply Chain Management for Extreme Conditions: Research Opportunities.” Journal of Supply Chain Management 57 (1): 7–16. https:/​/​doi.org/​10.1111/​jscm.12255.
Google Scholar
Tang, Christopher S. 2006. “Robust Strategies for Mitigating Supply Chain Disruptions.” International Journal of Logistics Research and Applications 9 (1): 33–45. https:/​/​doi.org/​10.1080/​13675560500405584.
Google Scholar
Tang, Christopher S., and Brian Tomlin. 2008. “The Power of Flexibility for Mitigating Supply Chain Risks.” International Journal of Production Economics 116 (1): 12–27. https:/​/​doi.org/​10.1016/​j.ijpe.2008.07.008.
Google Scholar
Wagner, Stephan M., and Christoph Bode. 2006. “An Empirical Investigation Into Supply Chain Vulnerability.” Journal of Purchasing and Supply Management 12 (6): 301–12. https:/​/​doi.org/​10.1016/​j.pursup.2007.01.004.
Google Scholar
Zaliska, Olha, Oleksandra Oleshchuk, Rebecca Forman, and Elias Mossialos. 2022. “Health Impacts of the Russian Invasion in Ukraine: Need for Global Health Action.” The Lancet 399 (10334): 1450–52. https:/​/​doi.org/​10.1016/​s0140-6736(22)00615-8.
Google Scholar

This website uses cookies

We use cookies to enhance your experience and support COUNTER Metrics for transparent reporting of readership statistics. Cookie data is not sold to third parties or used for marketing purposes.

Powered by Scholastica, the modern academic journal management system