1. Questions
Substantial changes to travel patterns in England in March 2020 resulted from growing concerns about the spread of Covid-19. These could have profound health implications if reductions in active travel are not compensated for with other forms of physical activity. The degree to which travel behaviour returns to pre-lockdown levels once restrictions ease is largely unknown, but might provide important insight for managing this and future pandemics and their long-term consequences. We aimed to evaluate the impact of Covid-19 movement restrictions on motor vehicle and active travel using time-series models to compare estimates from two time-periods before the pandemic with one after, adjusting for weather, seasonality and other confounding factors.
2. Methods
Data were from 13 traffic sensors in central Cambridge, UK starting on 9 May 2019 and made available by the local authority (Smart Cambridge 2021). Sensors were located on a mix of arterial routes, thoroughfares and residential streets (Supplemental Figure 1), with one located on a pedestrian and cycle path (Sensor 9). Total daily pedestrians, cyclists and motor vehicles were examined; motor vehicles comprised cars and light goods vehicles, with larger vehicles excluded as unlikely to reflect personal travel. Meteorological data were from the Digital Technology Group, University of Cambridge, coronavirus cases and deaths from the UK government Covid-19 dashboard, while day length was derived using an R package (Digital Technology Group 2021; Sefick 2016; HM Government 2021; R Core Team 2020).
Using September 2019 and February 2020 as pre-lockdown comparators, we evaluated the degree to which travel behaviour had returned to pre-lockdown levels by September 2020. Quasi-Poisson regression was used to model time-series data, accounting for underlying and seasonal trends. Our approach was akin to that taken for interrupted time-series analyses, but we were interested in the accumulation of impacts from multiple events over the study period, rather than a single event in time. We examined the initial lockdown (24 March 2020), the subsequent upward trend and the reopening of schools (1 September 2020). We modelled the impact of daily reported Covid cases and Covid deaths and took account of holiday periods and day of the week, while rainfall (tertiles), mean temperature (quintiles) and daylight length (continuous) were included to control for seasonal trends. We controlled for the closure of an arterial route into central Cambridge for maintenance in summer 2019, and its closure to motor vehicles from June 2020 to support social distancing. Short periods of missing data were also adjusted for in analyses. For further details see Supplemental Material 1.
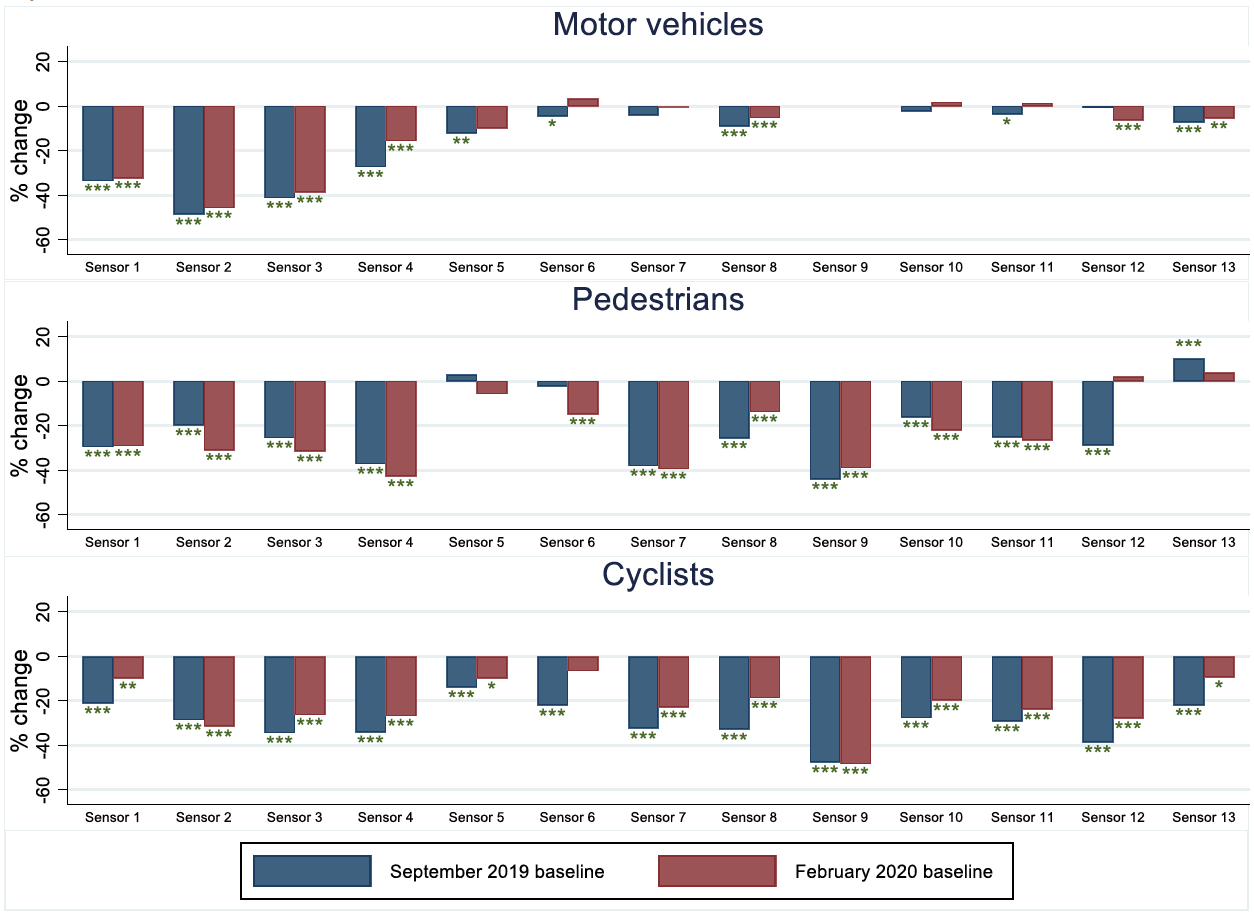
Following time-series analyses, marginal means were estimated holding temperature, precipitation, daylight hours and day of the week at their mean value, to account for variation in these measures. Marginal means were estimated for September 2019 and February 2020 (baselines), April 2020 (lockdown) and September 2020 (relaxation of some restrictions). Pairwise comparisons of estimated marginal means were made between both baselines and September 2020, and the percentage differences were calculated separately for pedestrians, cyclists and motor vehicles at each sensor location.
Sensitivity analyses compared the raw observed data from September 2019 and September 2020.
3. Findings
In most cases, walking and cycling in September 2020 remained substantially below pre-pandemic levels (Figure 1, Supplemental Figure 2 and Supplemental Table 1) irrespective of comparator period. Conversely, in many locations motor vehicle use in September 2020 had returned to levels similar to those before the pandemic. Exceptions to this were where motor vehicle use was restricted to support social distancing (Sensors 1 and 2) and roads approaching the railway station (Sensors 3 and 4).

Changes in raw mean counts between September 2019 and September 2020 are consistent with our modelled results (Supplemental Figures 3 and 4), supporting the validity of our model. In addition, plots of observed counts alongside time-series estimates for each sensor are presented in Supplemental Figures 5 and 6, these also indicate that estimates are in line with observed data.
Our findings are likely to reflect complex changes in travel behaviour across the population. Some regular journeys will have ceased, while others were substituted for different modes. Differences between modes in the degree to which these changes occurred may have contributed to the findings. For example, altered working and shopping patterns may have resulted in more walking and cycling journeys becoming unnecessary (e.g. because of home delivery services) than car journeys. However, those in occupations requiring higher qualifications and experience were generally more able to work from home during the pandemic and are also more likely to travel by car than those in occupations with lower requirements, so the degree to which walking commutes were disproportionately altered by the travel restrictions is uncertain (ONS 2020; Patterson et al. 2020).
The recovery in motor vehicle traffic despite continued disruption to many activities (e.g. office working) suggests that within Cambridge either (a) most motor vehicle traffic is not to and from work, or (b) commuters have tended to shift from public transport to private motor vehicles rather than active travel. Active travel accrued as part of public transport journeys is important for health (Patterson et al. 2019; Costa et al. 2015). It was not possible to measure public transport use with these data, but the curtailment of services was associated with a substantial drop in use (TfL 2020; Moovit 2021), which is likely to explain the observed reduction in traffic on the approach to the railway station (sensor 3).
Our findings suggest that any increases in walking and cycling for leisure or other purposes were insufficient to counteract the reductions in more essential journeys. This might be because the city centre sensor locations are less likely to be used for recreational activity. Cambridge has a high prevalence of cycling compared with the rest of the England, which might mean that there is a particularly strong preference against cycling among Cambridge non-cyclists. These issues cannot be addressed here but could be with more detailed data.
In conclusion, we found that after the initial Covid-19 lockdown in Cambridge, motor vehicle use returned to pre-lockdown levels more rapidly than walking or cycling.
Acknowledgements
David Ogilvie, Jenna Panter and Richard Patterson are supported by the Medical Research Council [Unit Programme number MC_UU_12015/6 & MC_UU_00006/7]. We are grateful to Smart Cambridge and the Greater Cambridge Partnership for the traffic data used in these analyses.