
1. QUESTIONS
Homeownership remains central to economic stability and upward mobility in the US, yet persistent disparities exist by race and ethnicity, age, income, and other household characteristics (Schwartz 2021). Emerging data suggest Lesbian, Gay, Bisexual, and Transgender (LGBT) households have lower homeownership rates, potentially due to demographic characteristics and structural barriers including housing discrimination (Kent and Scott 2024; Romero et al. 2020; Visalli et al. 2023). Understanding these disparities is timely given proposed federal rollbacks in housing protections based on gender identity and sexual orientation (US Department of Housing and Urban Development 2026). This article is the first, of which we are aware, to use the American Housing Survey (AHS) to examine these issues. Specifically, we ask: Are LGBT households less likely to own homes than non-LGBT households, and how much of this is explained by demographic and socioeconomic characteristics?
2. METHODS
The AHS, administered by the US Census Bureau, is a nationally representative sample of the US housing stock that first included questions about sexual orientation and gender identity (SOGI) in 2023. The sample includes 46,885 households with complete data on homeownership and LGBT status, comprising 44,623 non-LGBT households (95.2%) and 2,262 LGBT households (4.8%). One household was missing a Model 2 control variable, leaving 46,884 households for that model. After applying survey weights, these households are 95.1% non-LGBT and 4.9% LGBT. This likely undercounts LGBT households, since a non-LGBT respondent may live with an LGBT-identifying household member. Because the AHS surveys housing units rather than people, it also excludes people experiencing homelessness, among whom LGBT people are overrepresented (Romero et al. 2020).
We used the Census Bureau-constructed binary LGBT variable based on SOGI respondents’ answers to a gender identity question “Do you describe yourself as male, female, or transgender, or do you use another term?” and a sexual orientation question “Which of the following [sexual orientation categories] best represents how you think about yourself?” (US Census Bureau 2023a, 2023b). The variable equals one if the respondent identified as lesbian, gay, or bisexual, or reported their gender as transgender, or a term other than male or female. The Census Bureau codes “something else” and “don’t know” orientation responses as non-LGBT; households with no valid SOGI response were excluded (n = 8,784). This variable reflects the survey respondent – the householder in 85% of cases – who was not asked to report on the SOGI of other household members. We report a binary LGBT indicator because the AHS transgender subsample is small and demographically inconsistent with external benchmarks, making subgroup estimates unreliable.
We first compared homeownership rates by LGBT status, householder age, and household income. We then estimated two survey-weighted logistic regression models predicting homeownership (owner-occupied vs. renter-occupied). Model 1 included only the LGBT status indicator. Model 2 added controls for householder age, household income, race/ethnicity, presence of children, educational attainment, marital status, and metropolitan area fixed effects for 15 individually identified metros, plus categories for other metros and non-metro areas. Supplemental materials report full Model 2 results, including metropolitan area coefficients (Table S1). We also added LGBT-by-age and LGBT-by-income interaction terms, each evaluated with a joint Wald test, to test whether the gap varied by age or income (Tables S2 and S3). All estimates were survey-weighted, with standard errors from the AHS replicate weights using Fay’s balanced repeated replication method.
We used Claude (Anthropic) as a tool to assist with constructing variables, debugging code in R, and formatting figures and regression tables. All decisions related to the methodology, including modeling approach, and interpretation of results were made by the authors.
3. FINDINGS
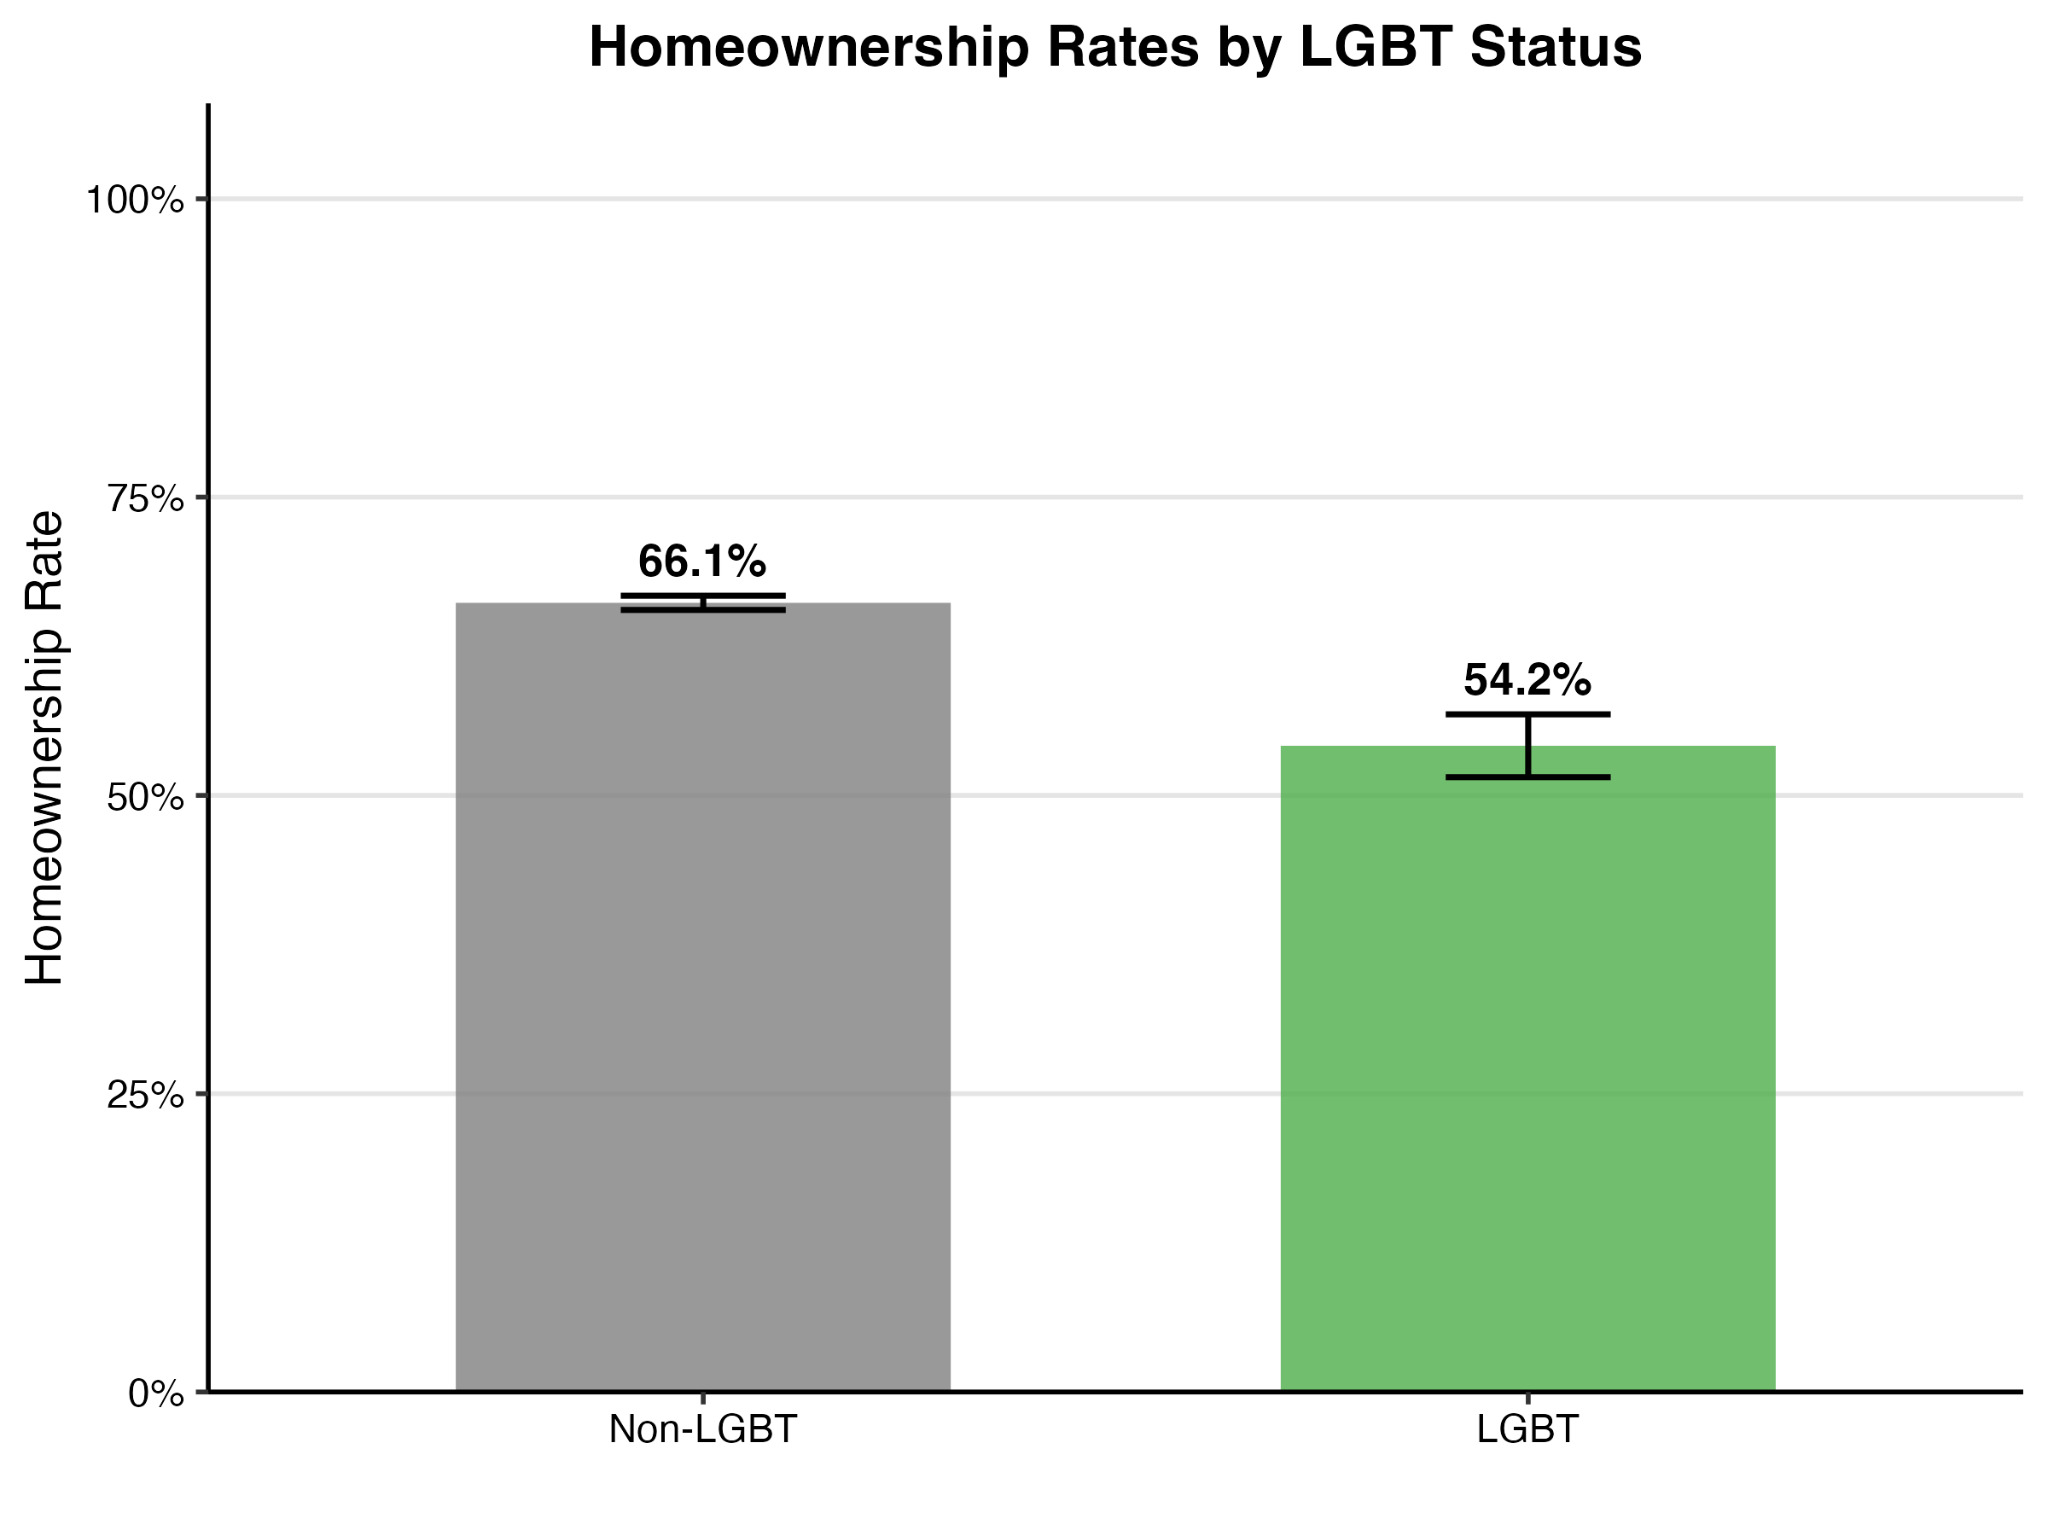
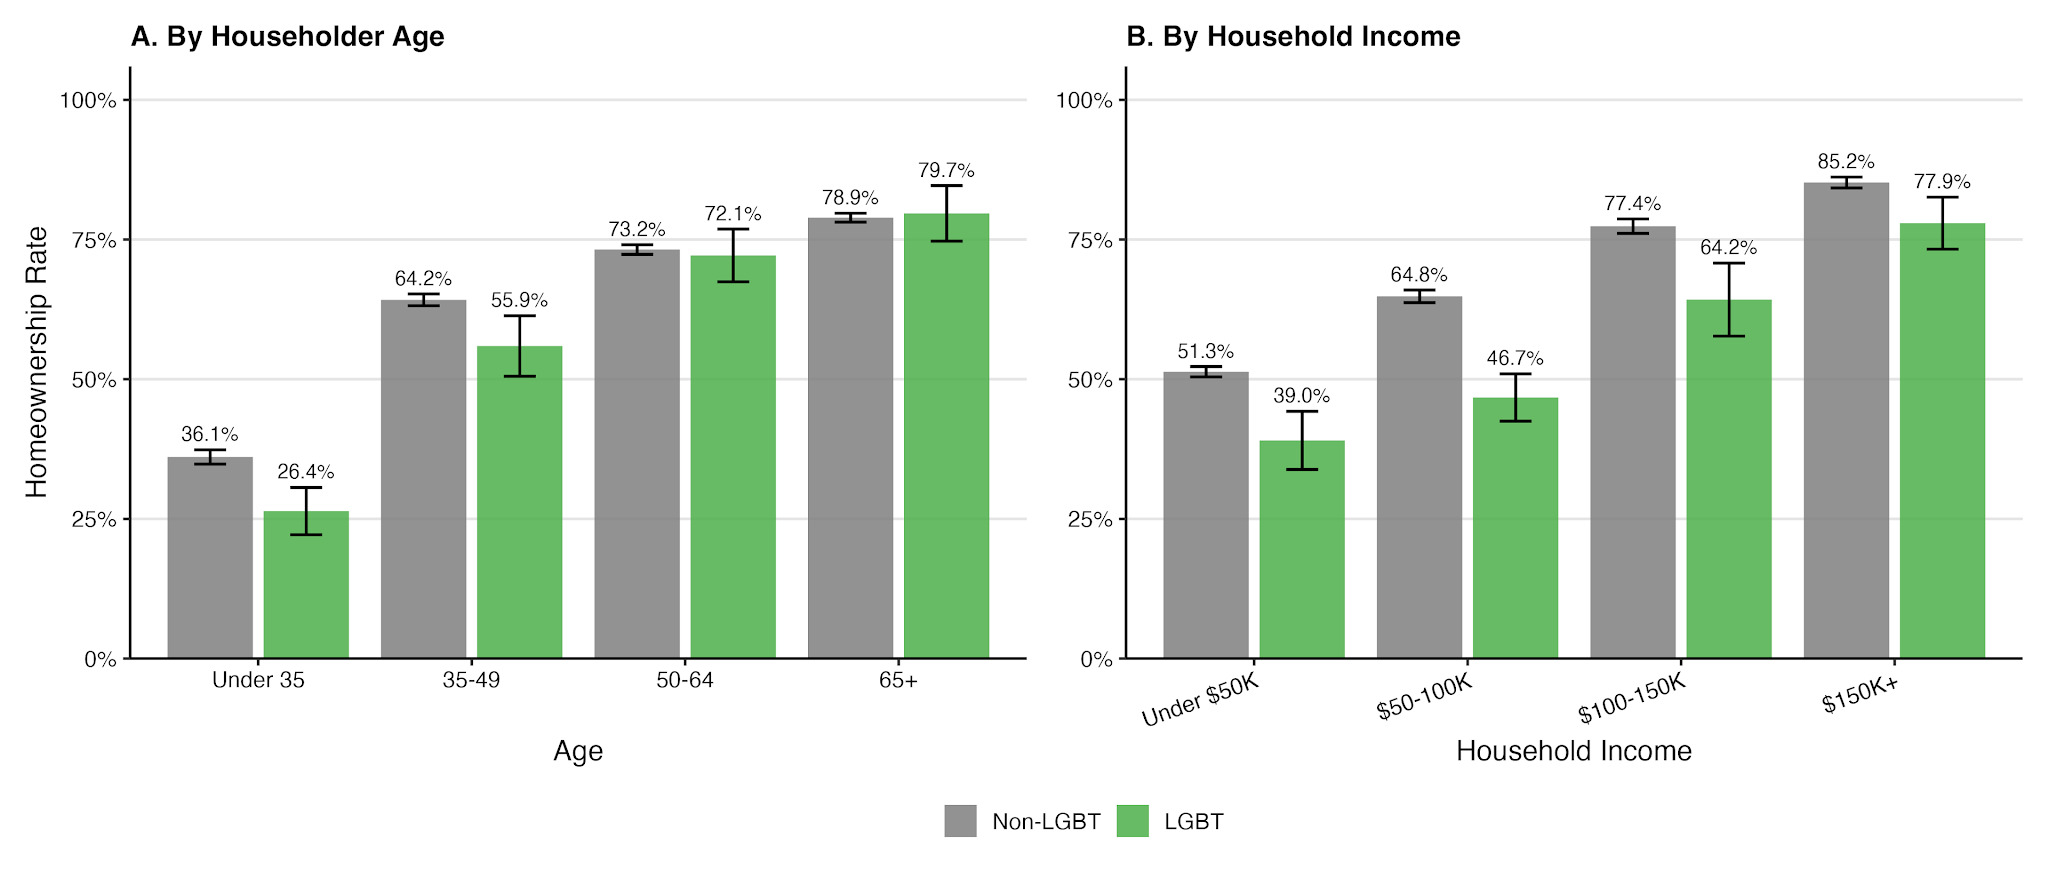
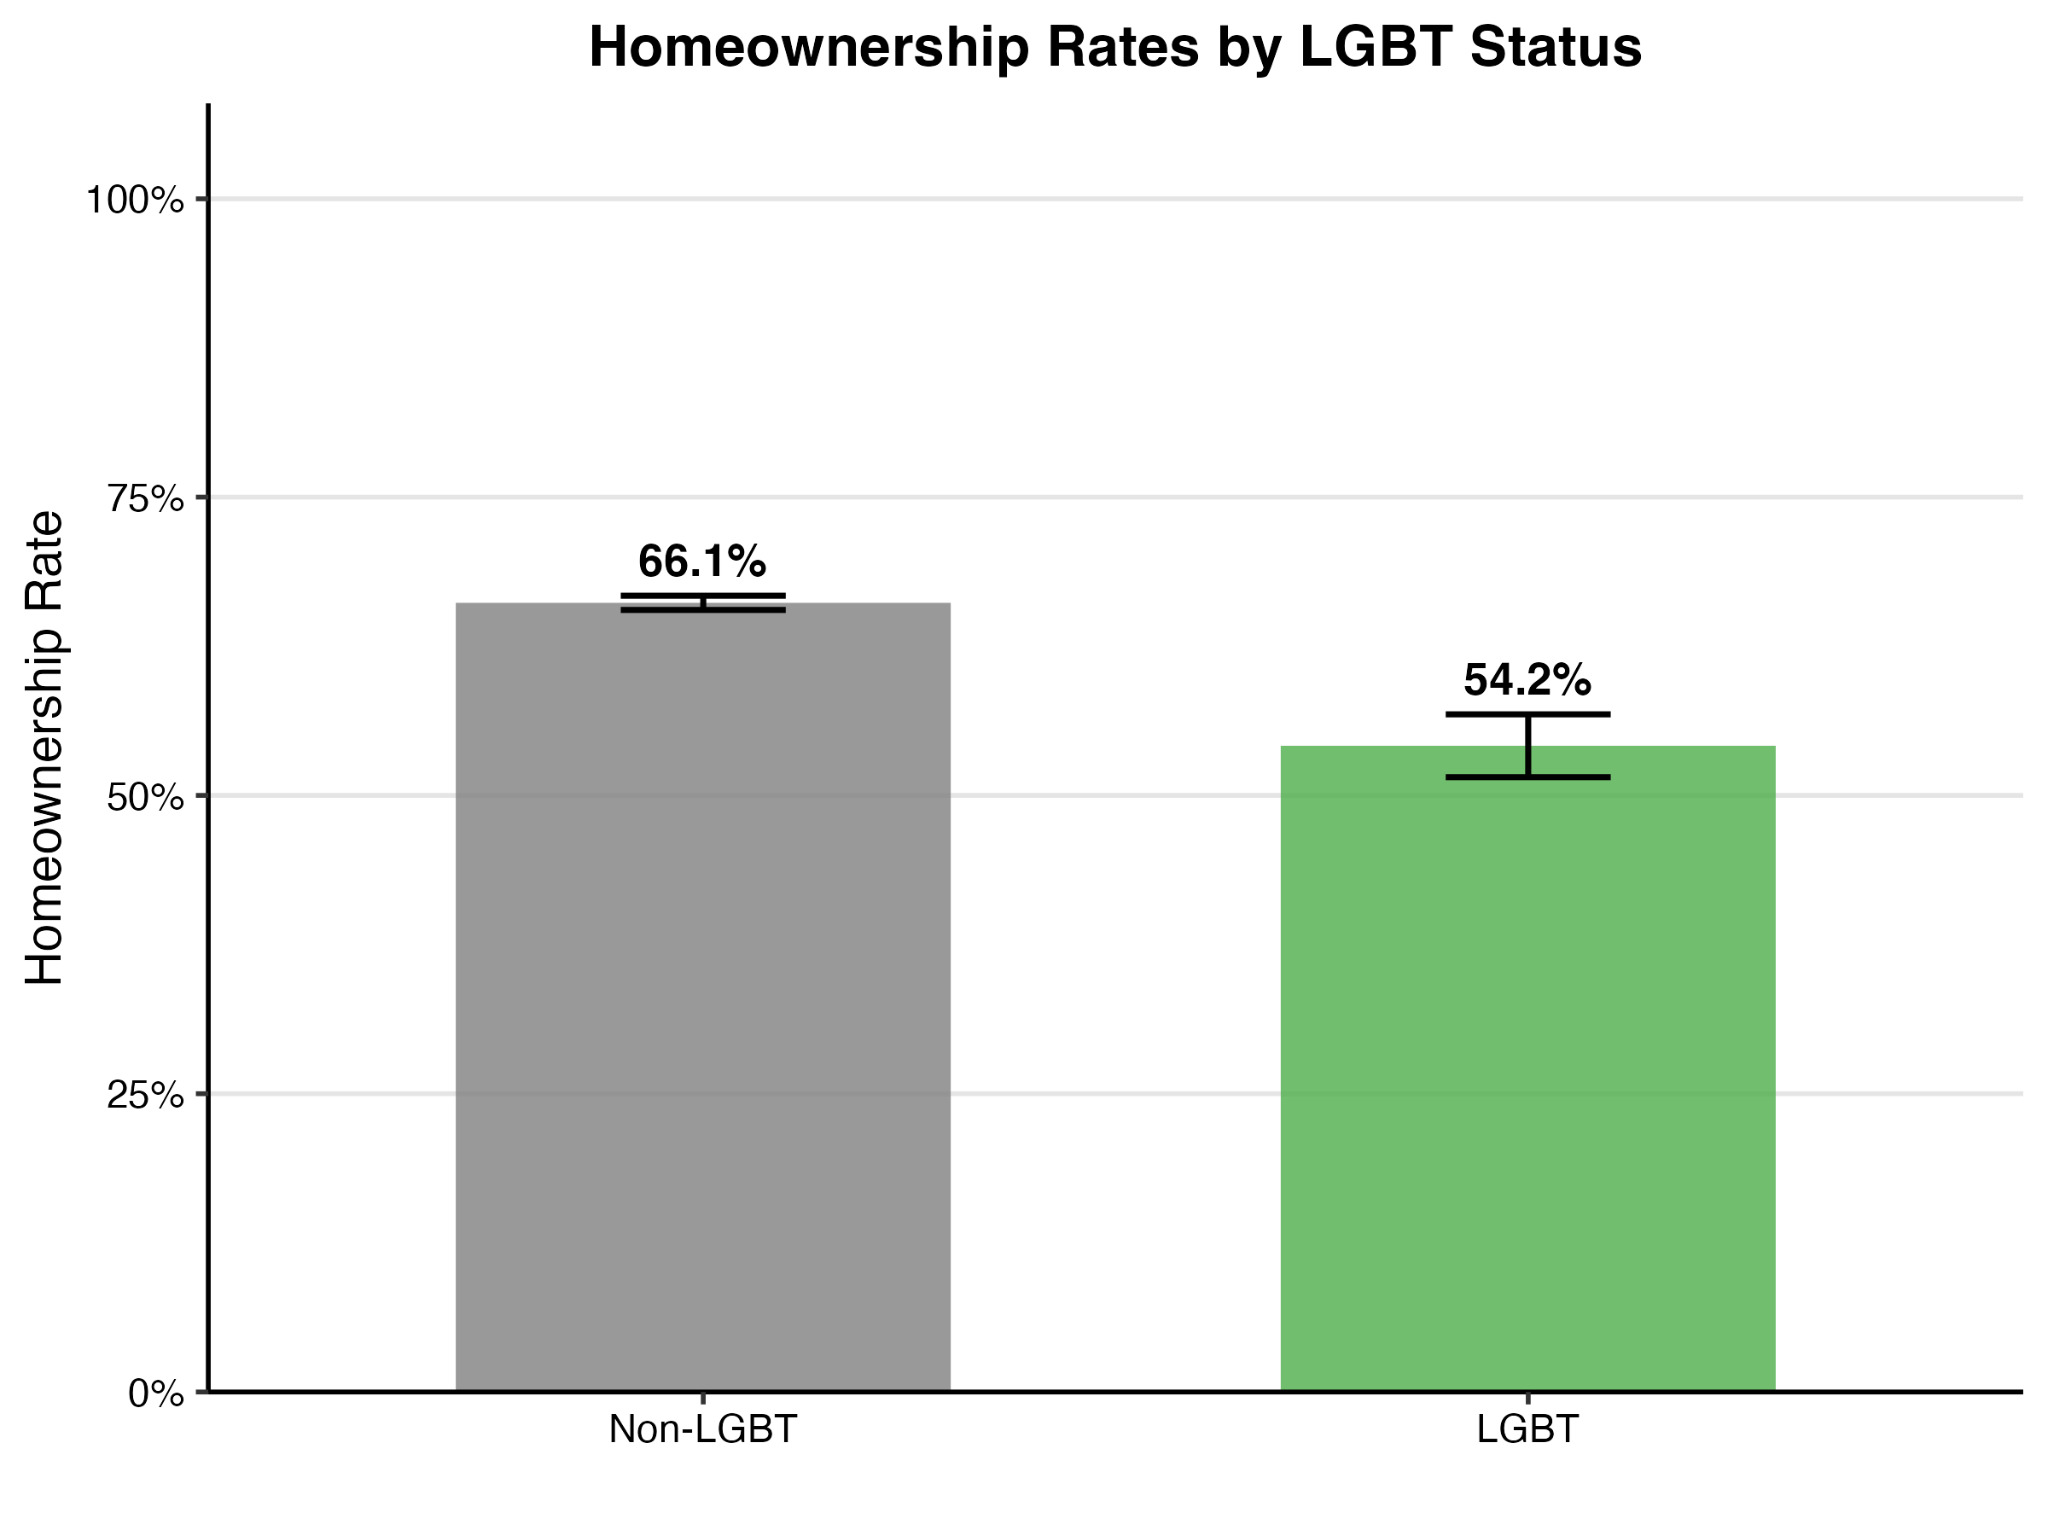
Non-LGBT households had a 66.1% ownership rate, compared with 54.2% of LGBT households (Figure 1). Homeownership rates increased with age for both groups (Figure 2). LGBT households under 35 years old had a homeownership rate of 26.4%, compared with 72.1% for 50-64 and 79.7% for 65+. This trend was similar for non-LGBT households, ranging from 36.1% ownership for those under 35 to 78.9% for those 65 and over. Younger LGBT households (under 35 and 35-49) were significantly less likely to own their home than non-LGBT households of the same age, though there were no significant differences for households above age 50.
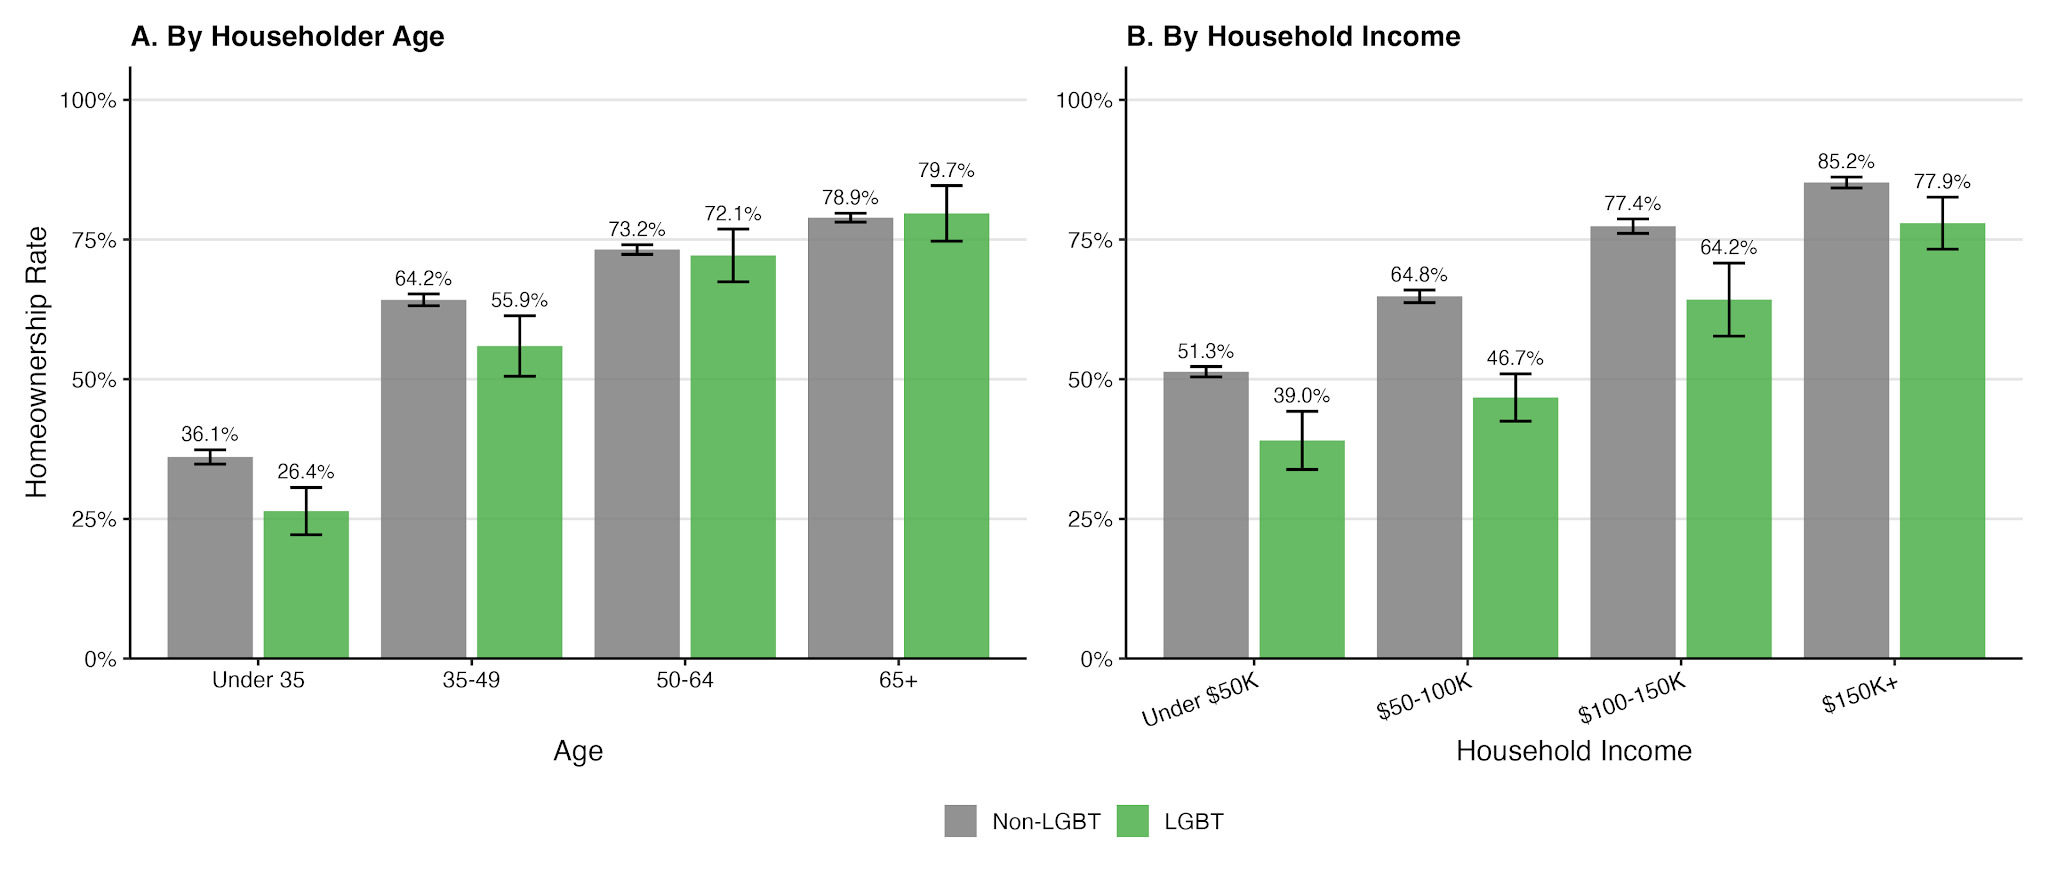
While homeownership rates for both groups increased with income, LGBT households at each income level were descriptively less likely to own than non-LGBT households. For households under $50K, 39.0% of LGBT households were owners compared with 51.3% of non-LGBT households; the rates were 46.7% vs. 64.8% for $50-100K, 64.2% vs. 77.4% for $100-150K, and 77.9% vs. 85.2% for over $150K.
The logistic regression models show that LGBT households were significantly and substantially less likely to own than non-LGBT households, all else equal (Table 1). After controlling for demographic and socioeconomic characteristics (Model 2), the odds ratio changed from 0.60 to 0.77, indicating that a significant gap for LGBT households remains. Each older age group was more likely to own than the previous one, aligning with observations of generational differences in homeownership (e.g., Gregory 2023), and households age 65 and over had the largest odds ratios in the model. Similarly, each higher income group was more likely to own than the reference group. Households of color were generally less likely to own than white households, although the difference was not significant for Native American households. Having a college degree, being married, and having children in the household were also associated with homeownership. Demographic and socioeconomic characteristics explain some of the difference between LGBT and non-LGBT homeownership, but even with controls, a considerable gap remains.
Interaction tests show the adjusted LGBT homeownership gap varied by age (p = 0.02), but not income (p = 0.16). For age, the gap was concentrated among younger households and narrowed for older households (Table S2). The adjusted gap did not vary statistically by income category, meaning the gap was relatively uniform across income levels (Table S3).
ACKNOWLEDGMENTS
We thank two anonymous reviewers for their thoughtful feedback, and Richard Kirk for helpful conversations at an early stage of this research.