
1. Questions
Journey-to-work lengths have been increasing throughout this century in the US (Bricka et al. 2024). “Super-commutes,” often defined in the US as over 80 km or 90 minutes one-way, have been increasing as well. While super-commuters constitute only about 3% of commuters nationwide, their prevalence rises to 10% in some California counties (Wang et al., n.d.).
Both the San Francisco Bay Area and Greater Los Angeles have much higher than US average housing costs and host higher-than-average rates of super-commuting (Boarnet et al. 2021; Islam and Saphores 2022). Each of these sprawling, diverse megaregions varies substantially in geography, employment, incomes, and population characteristics – and in comparison to one another as well (Storper et al. 2015). This heterogeneity may shape both the prevalence of super-commuting and the types of workers who super-commute.
Accordingly, we ask: What are the characteristics of super-commuters in two of the largest and highest housing cost metropolitan areas in the US, and how do the types of super-commuters compare with one another?
2. Methods
We conducted a latent class analysis (LCA) using the US Census Bureau’s 2019 1-year American Community Survey (ACS) Public Use Microdata Sample (PUMS) to construct typologies of super-commuters, which we defined as those with one-way commutes of 90 minutes or more. We defined the two regions – San Francisco Bay Area (7.7 million population) and Greater Los Angeles (18.8 million) – as the counties overseen by their respective metropolitan planning organizations (See the appendix for the full list of counties).
We extracted data for commuters in the Bay Area and Los Angeles (LA) that combined contain 5,573 super-commuters in the unweighted sample, of whom 1,765 lived in the Bay Area and 3,808 in LA (see Table 1).
We evaluated one to nine latent class solutions for super-commuters in our sample. Although model fit indices improved with the number of classes through eight, solutions with more than four classes saw a diminishing rate of fit improvements (details in the Appendix) and resulted in groups that were less obviously differentiated from one another. We ultimately settled on a four-class solution based on their meaningful segmentation and interpretability. After conducting the LCA, we examined how super-commuters in the two regions were distributed across the four classes.
3. Findings
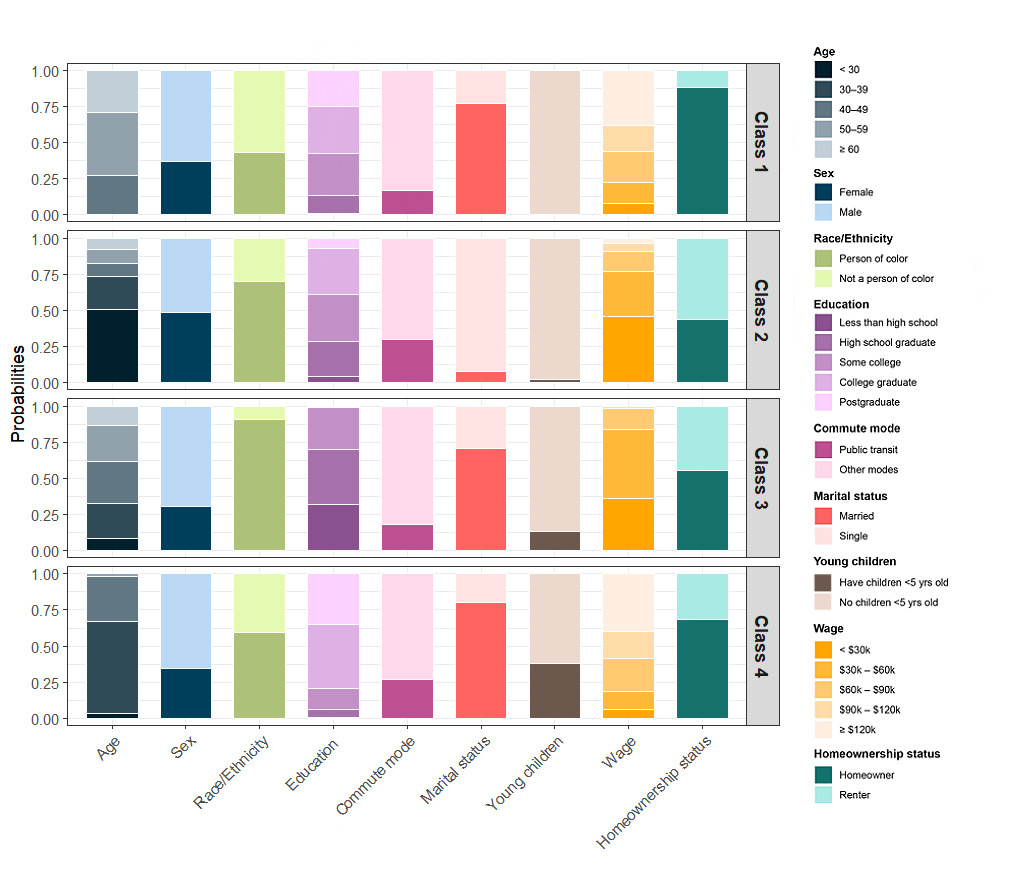
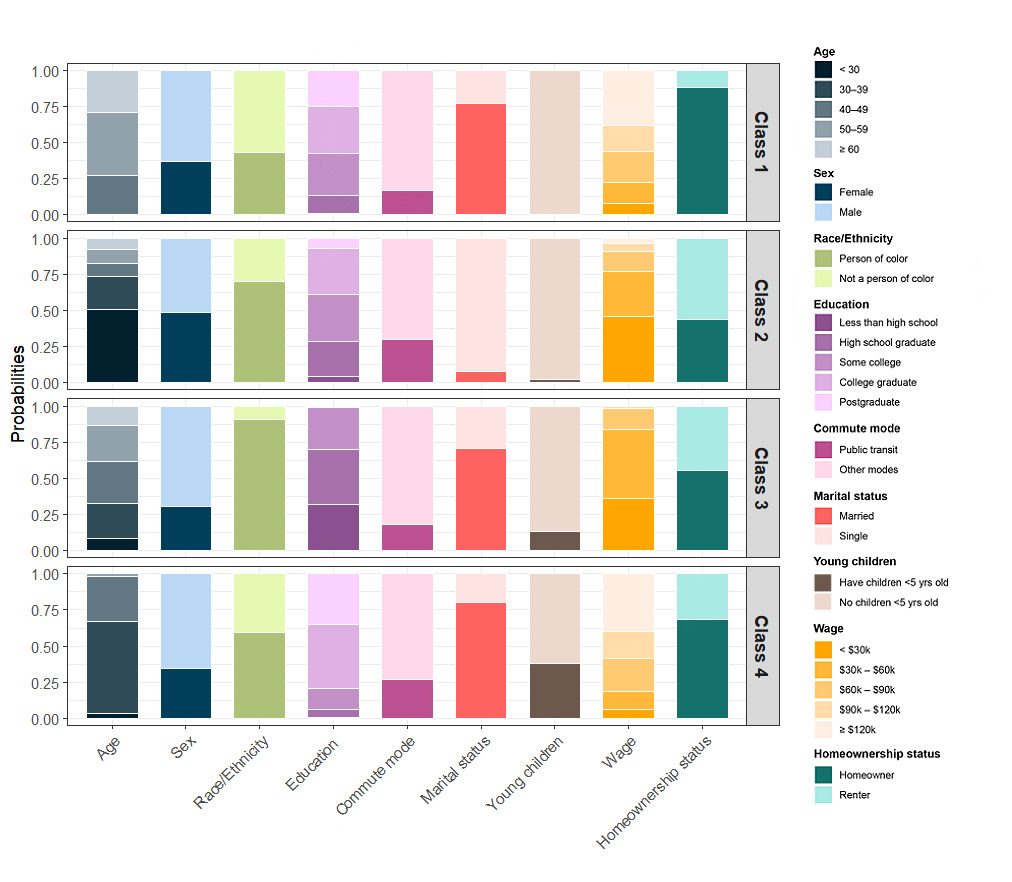
Table 2 shows the four classes of super-commuters, the nine variables used to create them, each class’s share of super-commuters in our sample, and the modal value for each variable in each class. Figure 1 complements Table 2 by displaying graphically the distribution of values for each variable in each class. We discuss below each super-commuter class from left to right in Table 2 and from top to bottom in Figure 1.
-
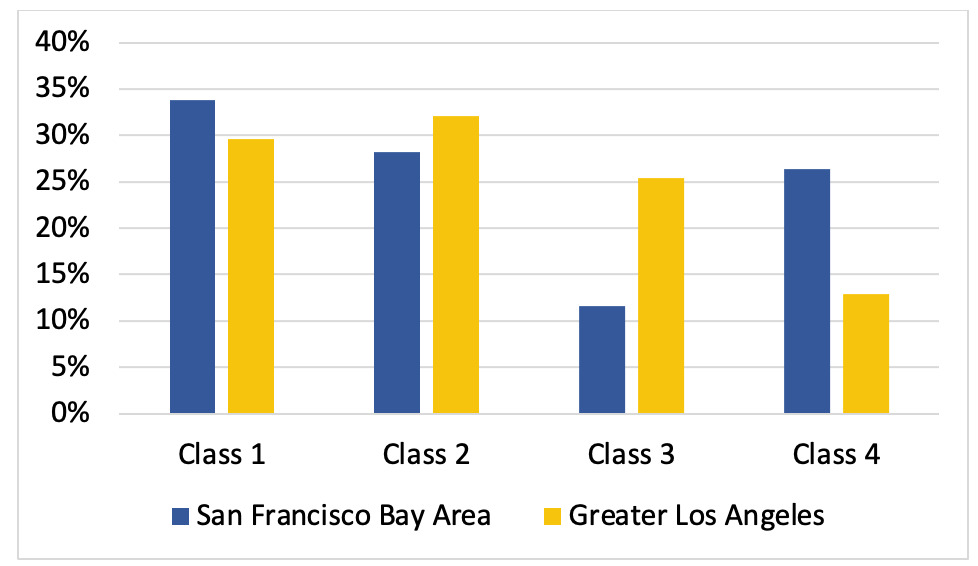
Established, advantaged homeowners: Class 1 is one of two notably advantaged classes. Its members are older (all are 40+), nearly ⅔ are male, more than ¾ are married, none have young children, and it is the only majority white class. About 6 in 10 have a college or graduate degree, and well over half (56%) earn over $90,000/year. Nearly 9 in 10 own homes, and just 17% commute on public transit, the lowest of any group. Finally, Class 1 accounts for 29% of the super-commuters in our sample, and Figure 2 below shows that its members are similarly prevalent in both regions.
-
Young, lower-income renters: Class 2 super-commuters are different in almost every respect. Over half are under 30, and nearly ¾ are under 40; 7 in 10 are people of color; nearly all (93%) are unmarried; and almost none have small children. While the other three groups are mostly male, this one is almost evenly split between men and women. Class 2 members have a wide mix of education levels and very low incomes, on average; nearly half (46%) make less than $30,000/year, and more than ¾ earn less than $60,000. This is the only group with a majority (56%) of renters, and 3 in 10 super-commute on public transit, the most of any group. This group accounts for 30% of our sample and, like Class 1, is also similarly prevalent in both regions (Figure 2).
-
Greater LA-oriented middle-aged, working-class families: The third group is decidedly middle-aged (78% are between 30-59), predominantly (70%) male, and more than 9 in 10 are people of color. Seven in 10 are married, but only 13% have small children at home. This group is the least educated – 7 in 10 have a high school diploma only or less – and, not surprisingly, 84% have incomes of less than $60,000/year. Despite their low incomes, just over half (56%) own homes, and better than 8 in 10 (82%) super-commute in a car or some other non-transit mode. Class 3 accounts for 22% of our sample, but Figure 2 shows that Class 3 members are considerably more prevalent among Greater Los Angeles super-commuters than among those in the Bay Area.
-
Bay Area-oriented highly-educated families: Finally, Class 4 super-commuters are nearly all early middle-aged (95% between 30-49), ⅔ male, 6 in 10 are people of color, 8 in 10 are married, and over ⅓ have small children – the most of any group. This is the best educated (79% have a college or graduate degree) and highest income group (58% make over $90,000/year). Better than ⅔ own their home, but more than a quarter super-commute on transit. Class 4 comprises 19% of our sample, and Figure 2 shows that Class 4 is much more prevalent among San Francisco Bay Area super-commuters compared to those in Greater Los Angeles.
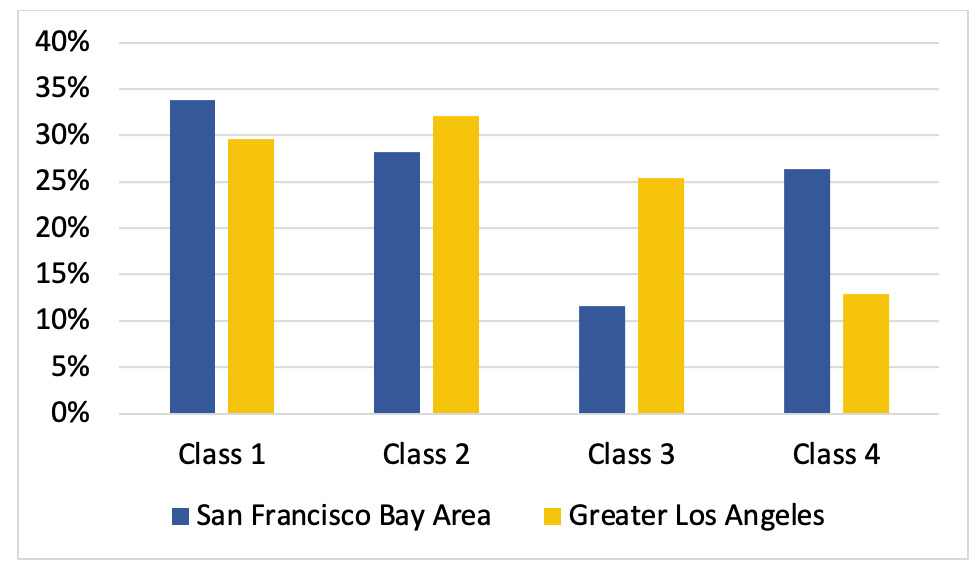
A central takeaway is that super-commuters are a decidedly heterogeneous bunch. Very long commutes in the western US’s two largest metros are not simply a story of affluent Bay Area transit commuters, far-flung LA freeway commuters, or Californians driving-till-they-qualify for a home mortgage. It is likely all of these, and more, in various combinations. So, for these two mega-regions, we find that, if you have seen one super-commuter, you most definitely have not seen them all.