

1. Questions
Graph-theoretic metrics based on network structure are a common way to measure transportation resilience (albeit far from universal). Betweenness centrality is a common choice, though there are many other options (Sun et al. 2020). It has seen resilience applications in road networks (Testa et al. 2015), railways (To 2015), sewage networks (Okwori et al. 2024), and electrical grids (Wang et al. 2012).
Betweenness centrality of a link is defined as the number of shortest paths between any pair of nodes in the graph that pass through this link. When there are multiple equally-short paths, betweenness centrality is divided evenly among their constituent links. Mathematically, the betweenness centrality of link is
bl=∑i∑j≠i#gilj#gij
where and are nodes in the graph, and is the number of shortest paths from to while is the number of shortest paths from to that include link (Csárdi et al. 2025). A link with high betweenness centrality lies on many shortest paths, which is often interpreted as meaning it is critical to network function.
Friedkin (1991) provided theory for betweenness centrality in social networks. He argued that individuals with high betweenness centrality exerted significant influence on communication passing through them. Betweenness centrality is thus a measure of influence.
In this article, I demonstrate through simple example networks that betweenness centrality is not a valid measure of resilience. Resilience of a network is a measure of how well the network functions under disruption, and how quickly it recovers (Sun et al. 2020). Atemporal graph theoretic measures cannot quantify recovery time. It is common to evaluate resilience based only on the functionality of the network under disruption, which is ultimately related to redundancy and travel time on alternate routes (and, in congested networks, capacity of alternate routes). Betweenness centrality only considers shortest paths, and not the presence of longer alternates. It cannot measure redundancy, or the travel time or capacity of alternate routes, and thus is not a valid measure of resilience or functionality under disruption.
2. Methods
I demonstrate the problem through three hypothetical networks that clearly differ in terms of resilience but not in terms of betweenness centrality, shown in Figure 1. The first is a gridded network, with one diagonal road in the center, which I refer to as Diagon Alley. It will serve as a shortcut on any path between southwest and northeast.
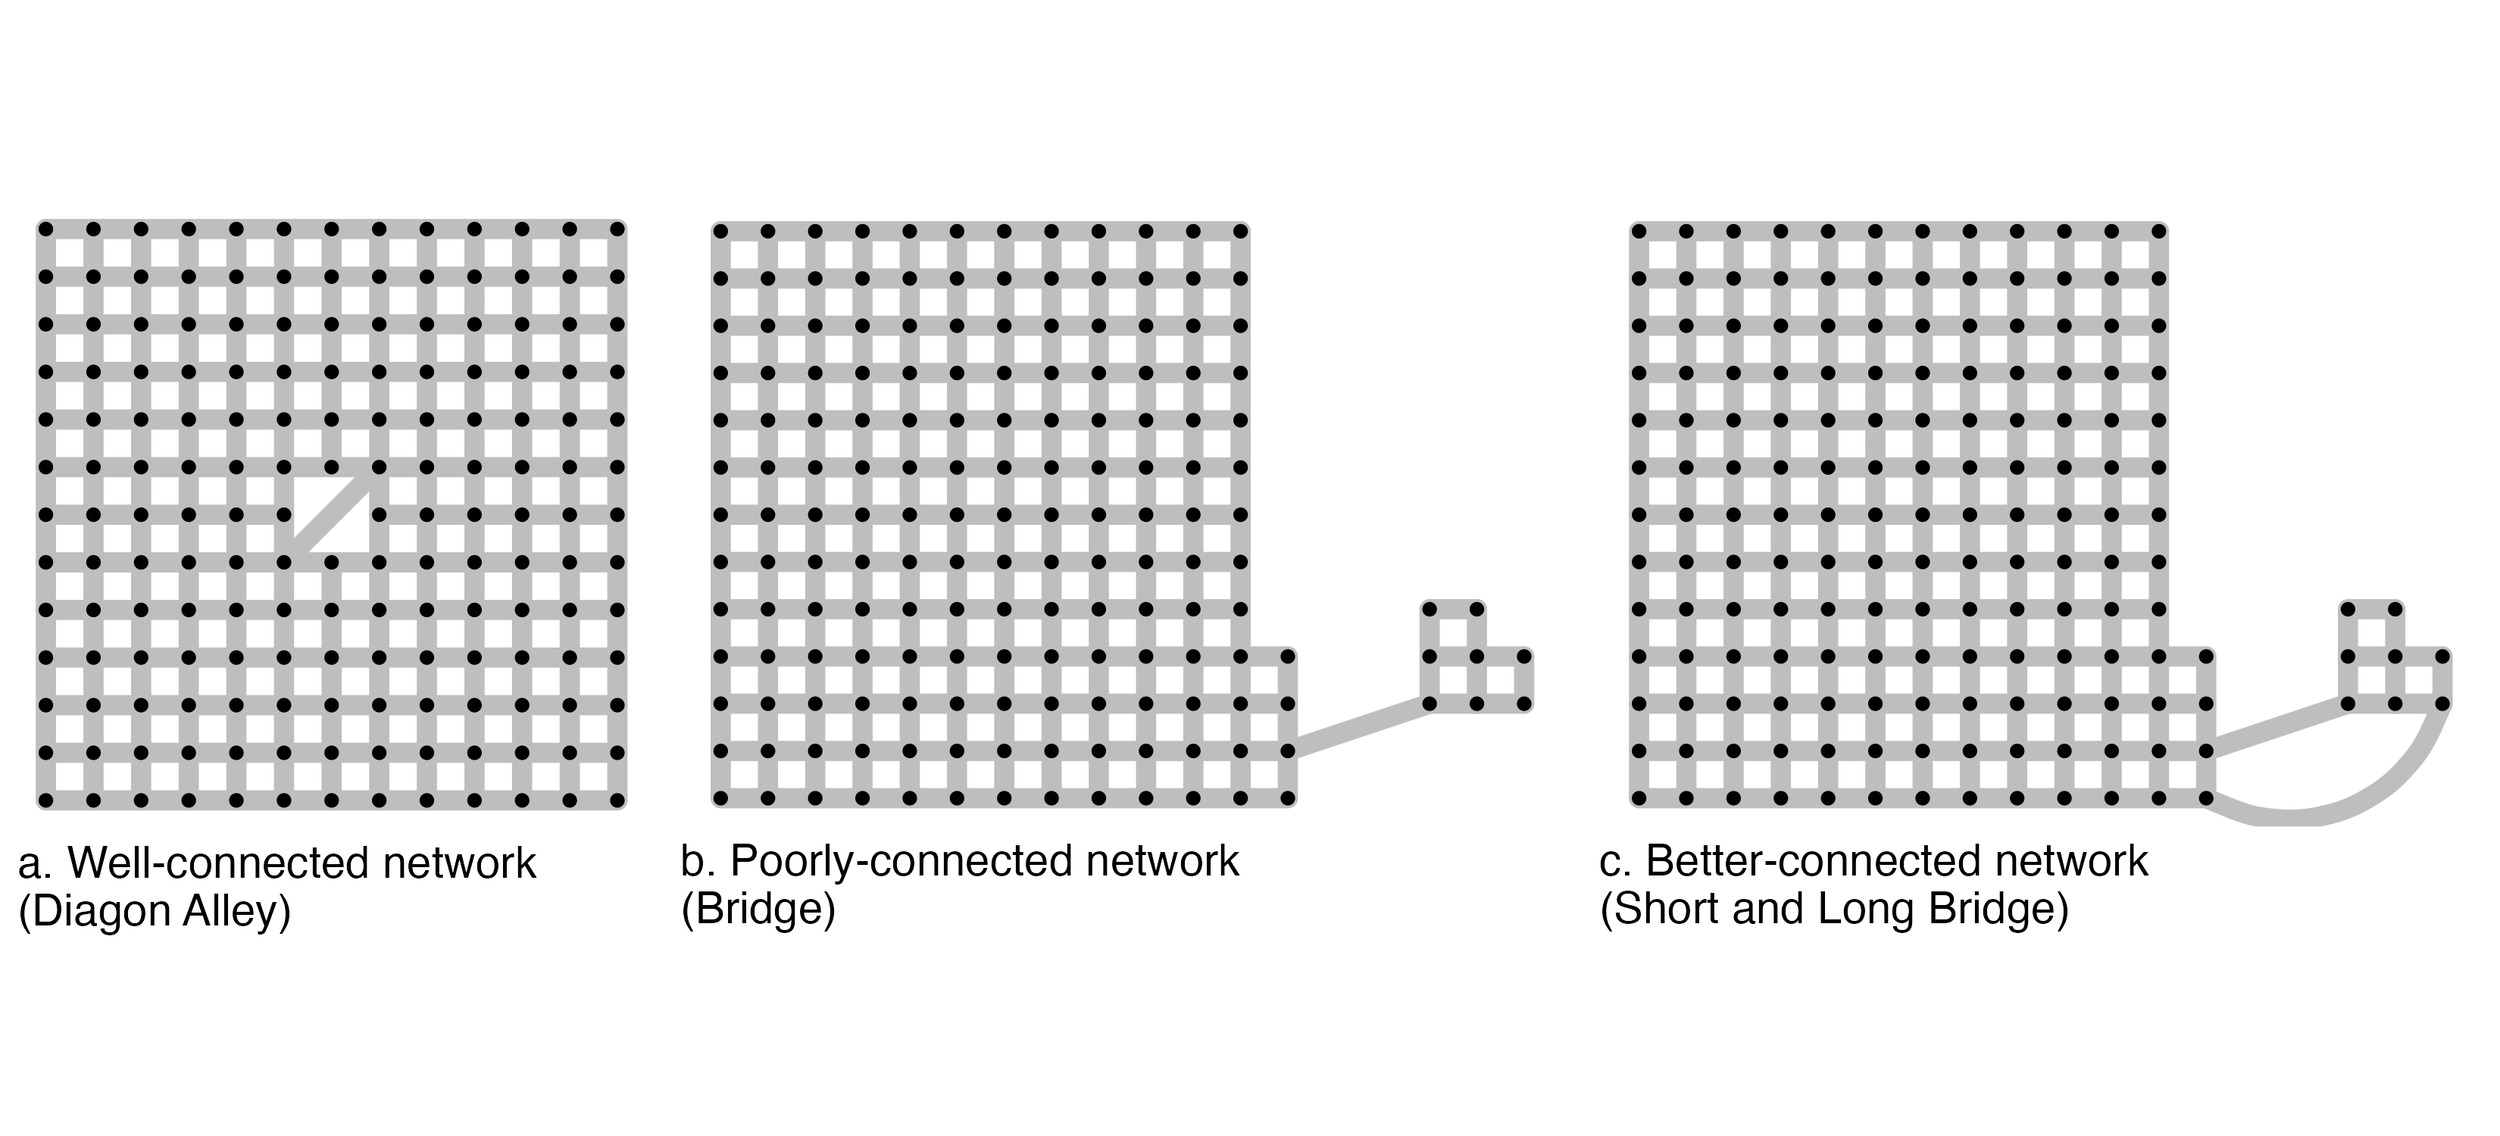
The second network consists of a “mainland” and an “island,” both with gridded networks, and with a single link, which I refer to as the bridge, connecting them. The bridge will be part of the shortest path from any node on the island to the mainland or vice-versa, and thus will have high betweenness centrality. The third network adds a second, longer bridge, that is too long to be on any shortest path and therefore has no impact on betweenness centrality. Betweenness centrality is calculated using igraph (Csardi and Nepusz 2006; Csárdi et al. 2025) in R (R Core Team 2025). Code is available at https://github.com/mattwigway/BetweennessCentralityResilience.
3. Findings
The betweenness centrality values for all three networks are shown in Figure 2. As all three networks have 168 nodes, betweenness centrality values are directly comparable. In the first network, Diagon Alley unsurprisingly has the highest betweenness centrality value, as it serves as a shortcut in an otherwise perfect grid. It has a betweenness centrality value of 1,296. In the second network, the bridge has the highest betweenness centrality, of 1,280—close to but below the value for Diagon Alley, despite a clearly more important role in resilience. In the third network, despite the addition of the long bridge, the short bridge is still the shortest route for all access to the island. The betweenness centrality of the short bridge remains 1,280, even though it is clearly not nearly as critical to network function now that there is an alternative. The betweenness centrality of the long bridge is zero, because there is no path where taking that bridge is shorter than taking the short bridge. Betweenness centrality completely misses redundancy if that redundancy entirely consists of paths that are (maybe only slightly) longer than the shortest path.
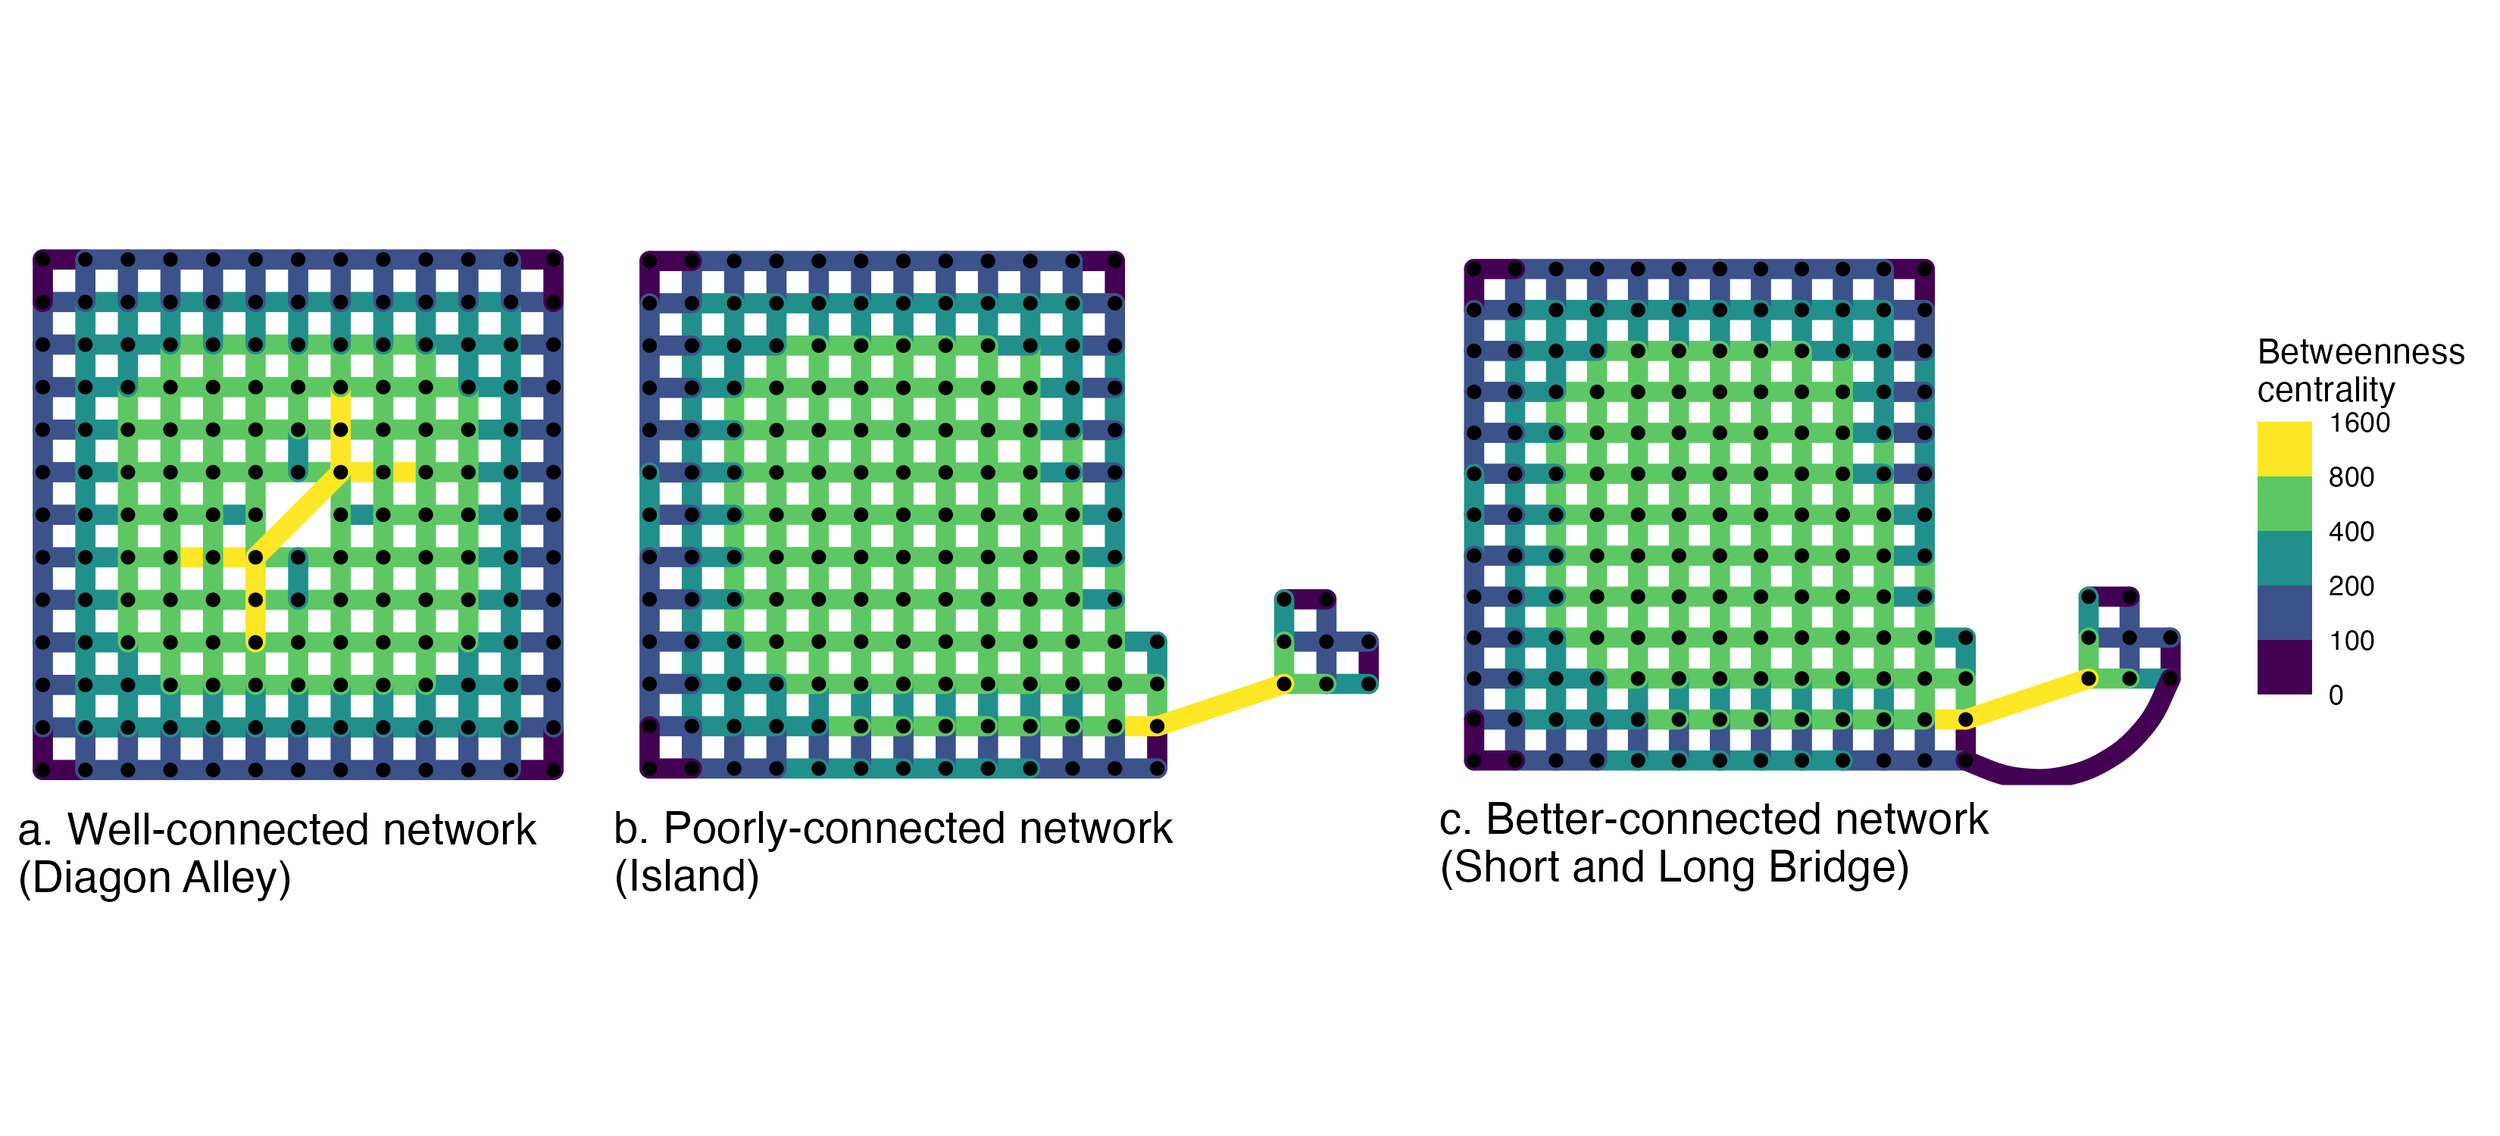
There is a difference in the distribution of betweenness centrality between the Diagon Alley graph and either of the other graphs. There are more mid-valued betweenness centralities in the Diagon Alley graph than the others. This difference is confirmed by Kolmogorov-Smirnov tests between the centralities in the Diagon Alley graph and the each of the other graphs (for both tests, p < 0.004). However, the distributions of betweenness centrality are still not a reliable measure of resilience. In the Island and Short and Long Bridge networks, the betweenness centrality values are identical for all links other than the added bridge. The difference in both the statistical and geographic distribution of centralities between the Diagon Alley network and other networks is very dependent on exactly where in the Diagon Alley network the diagonal street is placed, and on the network being a perfect grid with no variations in block length (see supplemental materials).
Betweenness centrality is not a theoretically justified measure of transportation resilience. However, empirical results are mixed. Wan et al. (2021) found that removing nodes with high betweenness from real-world social and communications networks was very effective in causing disconnection. The networks used, however, differ from transport networks by having many high-degree nodes. Conversely, Liu et al. (2024) found that nodes in the Shanghai metro with high betweenness also tended to have many alternatives, suggesting that high betweenness centrality could indicate a redundant (and therefore resilient) link in transport networks.
There are many alternatives to betweenness centrality for measuring transportation resilience, including alternative graph-theoretic measures. Connectivity-based metrics include the cyclomatic number (number of edges required to be removed to remove all cycles and thus all redundancy), density (number of edges divided by total possible number of edges), and link-node ratio (Sun et al. 2020). The clustering coefficient measures the number of triangles in the network, while the related meshedness coefficient essentially counts the number of city blocks (Yazdani and Jeffrey 2012). These metrics do not allow identifying critical links or impacts on long-distance paths.
There are centrality metrics other than betweenness. These include degree centrality—the number of edges at each node—and eigenvector centrality, a recursive metric where each nodes’ centrality is proportional to the centralities of the nodes it is connected to. Other centrality metrics are defined based on observed traffic flow (Sun et al. 2020). These generally exhibit the same concerns as betweenness centrality of not fully accounting for alternative routes.
Another metric is -betweenness. A link is -between two vertices if there is no way to get between them without using the link (Harary et al. 1965). In the networks presented above, -betweenness would identify the bridge in the second network as a critical location. However, -betweenness does not differentiate short and long detours, nor does it assign any value to adding a third alternate path.
Simulation is another option, removing links from the network and evaluating connectivity (e.g., Aydin et al. 2018). This approach may test removing all links individually, or random subsets. Jenelius (2010) flag betweenness centrality as problematic, and rank links based on simulated impacts to users if links were removed. The challenge with a simulation approach is that in many networks the criticality of links will have a highly-skewed distribution. In the networks above, only the bridge in the second network affects overall connectivity when removed. A random sampling of links might not contain this link, while a complete enumeration may be computationally challenging.
Disruptions will often affect multiple links in a non-random fashion (e.g. all low-lying links). A better approach is to remove links based on forecast future hazards (e.g., Fan et al. 2023; Testa et al. 2015). This combines the vulnerability of each link with the vulnerability of the network structure itself. However, it is unable to identify links critical to network functionality that are not exceptionally vulnerable to the hazards modeled, though possibly to others—for instance, a crash or vehicle fire that causes long-term damage to the roadway.
Cardwell et al. (2026) take a re-weighting approach, where shortest-path trees are found repeatedly and used links are penalized; the algorithm is iterated until the are no major changes to routes. The number of iterations indicate the overall redundancy of the network, but this method cannot identify individual critical links, and may struggle with chokepoints in an otherwise resilient network.
The question of link-level resilience is essentially the inverse of the Road Network Design Problem, which selects an optimal set of potential links to improve connectivity (Farahani et al. 2013). A promising area of research would be applying similar algorithms to select an optimal set of links to remove from a network to maximally decrease connectivity; these links are particularly critical.
Acknowledgements
The author wishes to thank the reviewers for their comments, particularly for suggesting the analysis of the distribution of centrality metrics.