

1. Questions
In 2019, about 157,669 bicycles were reported stolen to law enforcement in the United States (Federal Bureau of Investigation 2019a). The total number of bicycles stolen in the US is likely much higher than that owing to underreporting of bicycle thefts to the police (Johnson, Sidebottom, and Thorpe 2008). Research by a bicycle advocacy program suggests that over 2 million bicycles are stolen each year in North America (Capo Velo Cycling Collective 2019). To our knowledge, no academic studies report the number of bicycles stolen and value of bicycle theft in the US. Estimation of the magnitude and equity impacts of bicycle theft in the US, which in addition to being costly undermines efforts to increase bicycling (Cohen et al. 2024), will help make the case for investment in infrastructure, programs, and technology to help reduce bicycle theft. In this paper, we answer the following three questions:
-
How many adult bicycles are stolen annually in the US?
-
What is the annual value of adult bicycle theft in the US?
-
To what degree does the bicycle theft rate vary by income and race/ethnicity?
2. Methods
We designed a survey (Supplement 1) and in partnership with YouGov (an online polling firm) we collected data from adult residents in the US in March 2024. YouGov used its existing panel to recruit participants with a sample matching and weighting procedure to create a weighted sample that is representative of the general adult population in the US based on gender, age, race, education, and geographic region. The survey included questions on the number of bicycles owned in the last six years, number of bicycles stolen in the last six years, bicycling frequency, and socio-demographics. The sample of the general adult population consists of 1,748 respondents. More detailed data on bicycles owned, bicycling patterns, and stolen bicycles was collected from respondents who were active bicyclists (defined as owning at least one bicycle in the last six years and riding a bicycle at least once a month). The subsample of active bicyclists consists of 430 respondents.
In Table 1, we provide the equations that we used to calculate the annual bicycle theft rate for the general population and active bicyclist samples (1) and the total number of adult bicycles stolen annually (2). We estimated the number of bicycles in circulation using our estimates of the average annual bicycle market consumption (that includes imported bicycles and domestically manufactured bicycles), average lifespan of a bicycle, and a factor to account for stockpiling in the last few years in the bicycle industry (J. Townley, personal communication, 2024). We estimated the average number of bicycles imported annually using data from the National Bicycle Dealers Association on the number of bicycles imported in the US over a period of six years (2018–2023). Based on data from 2017 to 2021, we assumed that the number of domestically manufactured bicycles annually was 3.6% of the total annual bicycle consumption. Because we only surveyed adults, we excluded children’s bicycles (i.e. bicycles with wheel size 19-inch or less) from our analysis (estimated as 33.2% of the annual bicycle market consumption based on a cross tabulation of bicycle import data by wheel size from 2019 to 2021 (J. Townley, personal communication, 2021)).
We computed the total number of adult bicycles stolen per year per 100,000 people using equation (3) in Table 1 and using the US Census 2023 population estimate. We calculated the total annual value (i.e. the actual cash value of bicycles at the time of theft, not the replacement value) of adult bicycle theft using equation (4) in Table 1. We estimated the median value and the average value of a stolen bicycle using the current values of stolen bicycles (not the replacement values) as reported by the survey respondents. We also examined the extent to which bicycle theft rate varies among different population segments based on household income and race/ethnicity to assess equity impacts of bicycle theft. The primary limitations of our methods are the assumptions of children’s bicycle percentage from wheel size, unknown errors from domestic bicycle production estimates, and survey response biases (such as recall bias and social desirability bias).
3. Findings
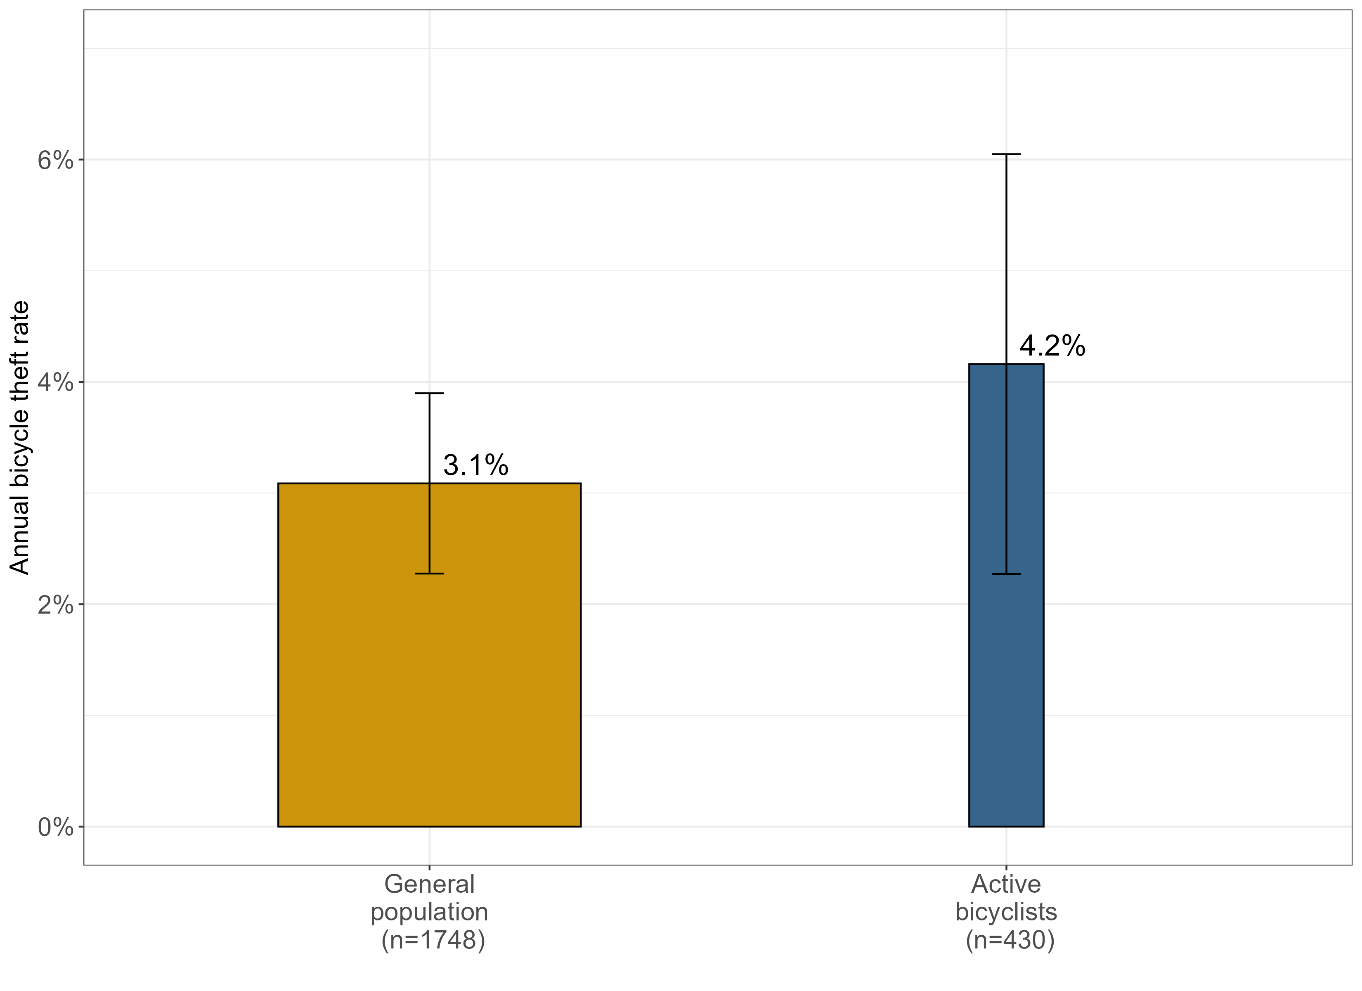
Our results show that the annual bicycle theft rate for the general population is 3.1% and for active bicyclists is 4.2% (Figure 1). Active bicyclists likely experience a greater theft rate because they are bicycling and leaving their bicycles parked somewhere other than home more often than the general population, providing increased opportunities for bicycle theft. We estimate the margin of error of the annual bicycle theft rate to be +/-0.81 percentage points for the general population and +/-1.89 percentage points for active bicyclists, at a confidence level of 95%.

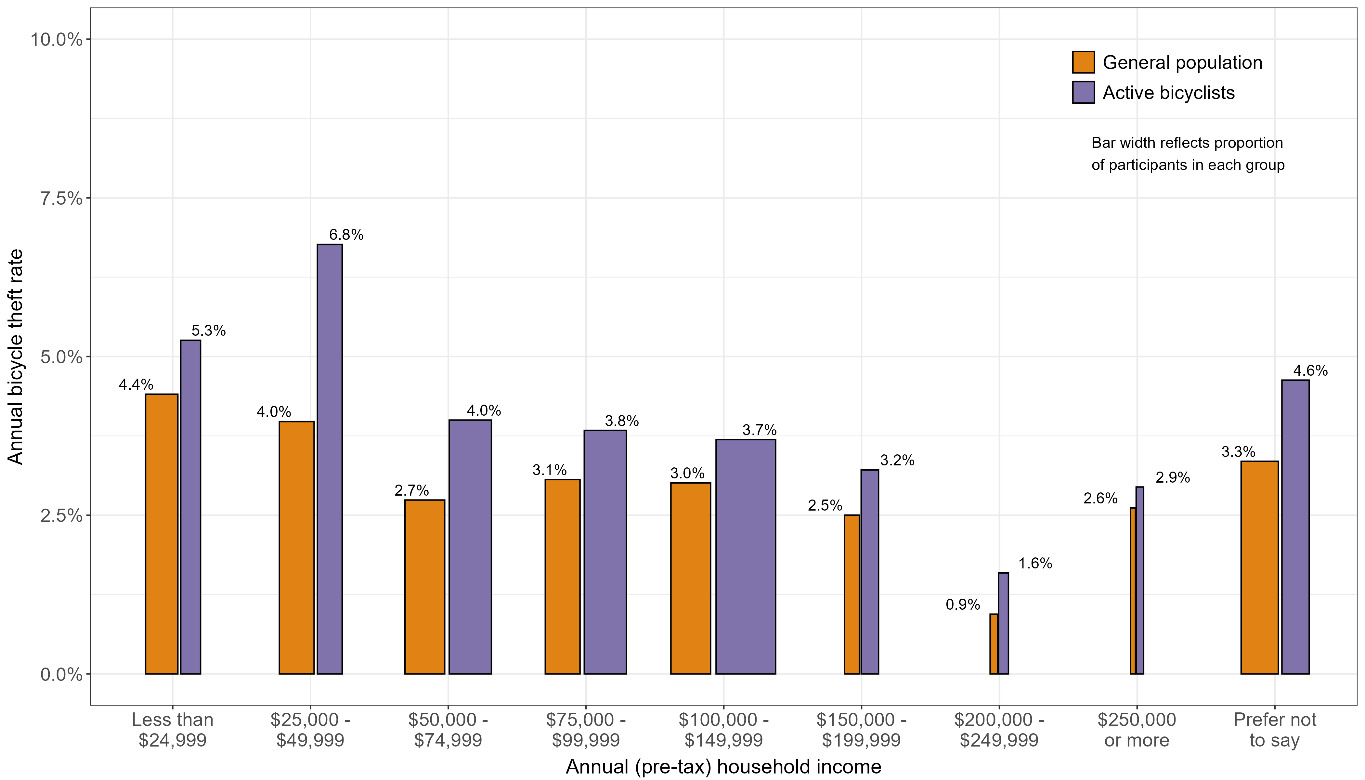
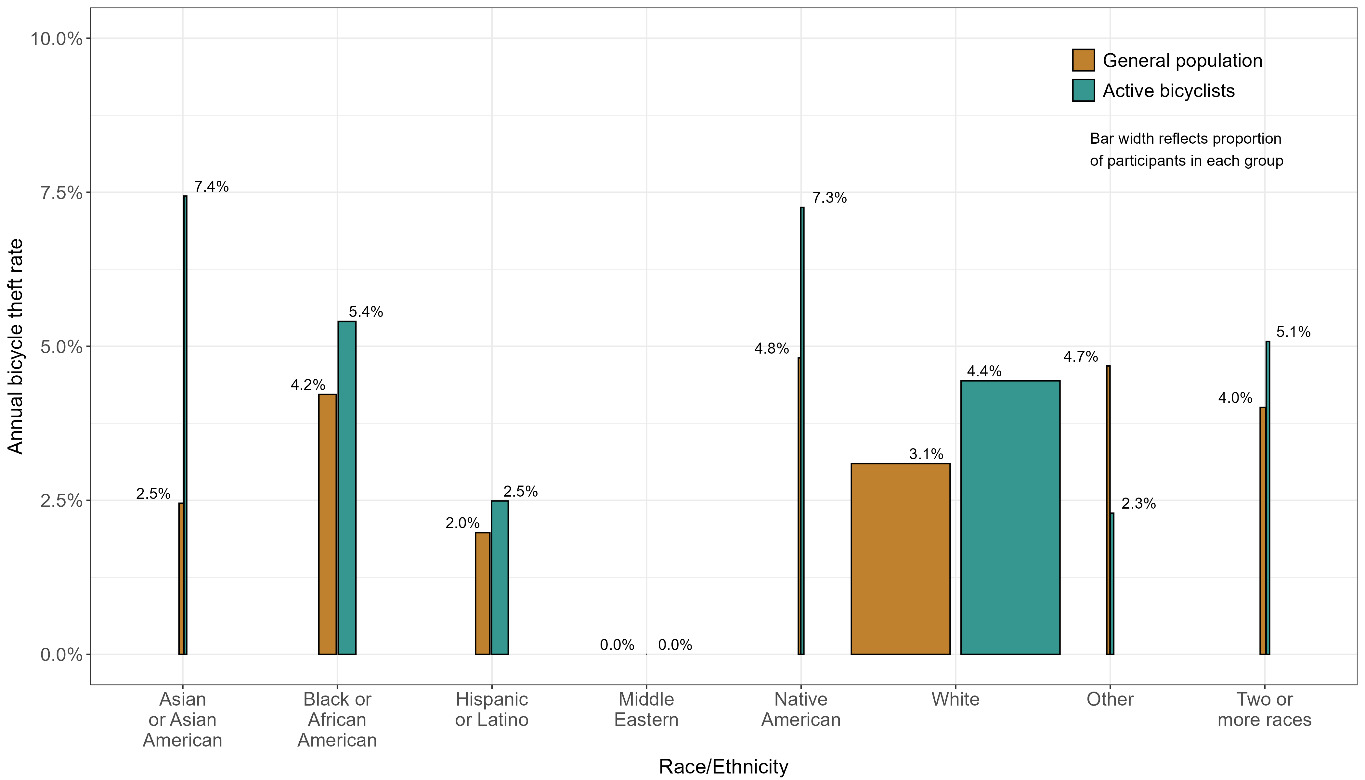
Individuals with lower incomes and individuals from certain racial or ethnic groups experience greater bicycle theft rates than others. Individuals with an annual (pre-tax) household income of less than $50,000 experience greater bicycle theft rates than individuals with an annual income of $50,000 or more, in both the general population and the active bicyclist subgroup (Figure 2). In the general population, individuals who self-identify as Black (or African American), Native-American, and multiracial experience greater bicycle theft rates than those who self-identify as White (Figure 3). In the active bicyclist subgroup, individuals who self-identify as Asian (or Asian American), Black (or African American), Native-American, and multiracial experience greater bicycle theft rates than those who self-identify as White. (Table 2 shows the household income and racial/ethnic characteristics of the survey respondents). We speculate that the inequities in bicycle theft are likely due to inequitable bicycle parking facilities, resources to invest in secure bicycle locks, and crime levels, among other factors.
There is variation in the type of land use and location from which bicycles were stolen – our results indicate that about 59% of the bicycles were stolen from residential zones and 15% of the bicycles were stolen from retail or office zones (in the active bicyclist subsample). The survey results also indicate that 44% of the bicycles were stolen from yards/balconies/porches/patios, 14% of the bicycles were stolen from garages/bicycle rooms/storage rooms, 13% of the bicycles were stolen from outdoor bike racks, and 10% of the bicycles were stolen from inside houses (in the active bicyclist subsample) (Table 3).
Our results indicate that the total number of adult bicycles stolen annually in the US is 2,376,578 or approximately 2.4 million, a rate of 709.6 adult bicycles stolen per 100,000 people per year. This number is 2.5 times greater than the number of motor vehicle thefts in 2023 per 100,000 people (283.5) (Federal Bureau of Investigation 2024). Our results also show that the median value of a stolen bicycle is $374.5, and the average value of a stolen bicycle is $605.3. Using the average value of a stolen bicycle, the total annual value of adult bicycle theft in the US is $1,438,542,487 (approximately $1.4 billion). In comparison, the estimated value of motor vehicle theft in 2019 was $6.4 billion (Federal Bureau of Investigation 2019b). This value estimate does not include the full replacement cost which could be two to three times greater because of depreciation. Although the bicycle theft cost burden is high, the investment in reducing bicycle theft is relatively low compared to the investment for car theft in the US. Given the relatively low recovery rate of stolen bicycles (Cohen et al. 2023), investment in bicycle theft protection (e.g., improvements in bicycle locking technology, secure parking, educational and outreach campaigns that educate bicyclists about secure bicycle parking and locking practices) should be considered.