Loading [Contrib]/a11y/accessibility-menu.js
Skip to main content
null
Findings
  • Menu
  • Articles
    • Energy Findings
    • Resilience Findings
    • Safety Findings
    • Transport Findings
    • Urban Findings
    • All
  • For Authors
  • Editorial Board
  • About
  • Blog
  • covid-19
  • search

RSS Feed

Enter the URL below into your favorite RSS reader.

http://localhost:22663/feed
Transport Findings
August 24, 2024 AEST

Does Policy Knowledge Affect Public Support for Gas Tax Alternatives? A Case Study in Northern New England

Clare Nelson, Gregory Rowangould,
Mileage feesGas taxTransportation fundingInformed choicePublic opinion surveyEducation
Copyright Logoccby-sa-4.0 • https://doi.org/10.32866/001c.122375
Findings
Nelson, Clare, and Gregory Rowangould. 2024. “Does Policy Knowledge Affect Public Support for Gas Tax Alternatives? A Case Study in Northern New England.” Findings, August. https:/​/​doi.org/​10.32866/​001c.122375.
Save article as...▾
Download all (6)
  • Figure 1. Shifts in Support for Gas Tax Alternatives Before and After Education. A) Support for replacing the gas tax with a $220 flat fee, and B) Support for replacing the gas tax with a $0.02 per mile travelled fee.
    Download
  • Supplemental Material A
    Download
  • Supplemental Material B
    Download
  • Supplemental Material C
    Download
  • Supplemental Material D
    Download
  • Supplemental Material E
    Download

Sorry, something went wrong. Please try again.

If this problem reoccurs, please contact Scholastica Support

Error message:

undefined

View more stats

Abstract

Public option research finds that support for changes in motor fuels taxes or the “gas tax” is low in the United States. Prior research also finds that respondents who have less information about policy questions they are polled on are likely to provide more random and unreliable responses. We find that inaccurate and low levels of information are strongly tied to public opinions about gas tax alternatives. By addressing knowledge gaps using an informed choice questionnaire, we find support for replacing state gas taxes with either a mileage fee or a flat fee shifts substantially. Specifically, support for a mileage fee increased while support for a flat fee decreased.

1. QUESTIONS

Vermont is considering mileage fees to supplement declining state motor fuels tax or “gas tax” revenue, but public support for gas tax alternatives in the United States (U.S.) is low (Agrawal, Nixon, and San Jose State University. College of Business. Mineta Transportation Institute 2024; Agrawal and Nixon 2017, 2022, 2024; Duncan, Li, and Graham 2020; Duncan, Nadella, Clark, et al. 2017; Duncan, Nadella, Giroux, et al. 2017). Surveys and pilot programs find mileage fee opposition frequently stems from perceptions of higher costs, privacy concerns, and inequities for rural and low-income drivers (Agrawal, Nixon, and San Jose State University. College of Business. Mineta Transportation Institute 2024; CDOT and FHWA 2017; Duncan et al. 2014; Duncan, Nadella, Clark, et al. 2017; Duncan, Nadella, Giroux, et al. 2017; Hanley and Kuhl 2011; HDOT 2022; NAS 2016; Whitty and Imholt 2005). However, the public is typically ill-informed about policies they’re polled on (Gastil, Reedy, and Wells 2007; Page and Shapiro 1992), and less-informed respondents tend to answer more randomly than the well-informed (S. Althaus 1996; S. L. Althaus 1998; Axsen, Kurani, and Sovacool 2023; van Knippenberg and Daamen 1996). Research and policy advice based on survey data from ill-informed respondents is therefore less reliable (Banerjee et al. 2011; Kuklinski and Quirk 2000; Morwitz and Pluzinski 1996; Neijens 1987; Neijens, De Ridder, and Saris 1992; Price and Neijens 1997).

Prior mileage fee studies have not evaluated their study participant’s prior knowledge about transportation finance, and mileage fees in particular. We hypothesize the public lacks sufficient policy information to make informed choices and by addressing these knowledge gaps the apparent support for mileage fees may be different than previously reported. Using a case study in three Northern New England states of the U.S., we examine the extent to which public policy support for gas tax alternatives shifts after the public engages with policy-relevant information in a unique informed choice questionnaire.

2. METHODS

We designed an internet-based survey questionnaire to assess public support for both a revenue neutral flat fee and mileage fee to replace state gas taxes in the U.S. states of Vermont, New Hampshire, and Maine. Policy support was determined using ballot-style voting opportunities with two educational treatments provided between votes. The questionnaire flowed as follows (see Supplementary Material A for the full questionnaire and Supplemental Material E for the survey method):

  1. Vote 1 (Control Vote): Two ballot items, each asking respondents to vote “Yes” or “No” to replace their state gas tax with a) a $220 flat fee per vehicle per year and b) a $0.02 per mile travelled fee.

  2. Cost Education: Personal estimates of respondent annual costs for a) state gas taxes, b) a $220 flat fee per vehicle and c) a $0.02 per mile travelled fee based on self-reported annual mileage and vehicle fuel economy information.

  3. Vote 2: Identical to Vote 1

  4. Policy Knowledge and Perceptions: Questions about perceptions of mileage fee costs and fairness and state gas tax knowledge.

  5. Policy Education: Educational videos, created by the researchers, discussing the pros and cons of gas taxes and mileage fees (see Supplementary Material B).

  6. Vote 3: Identical to Votes 1 and 2

The survey was fielded using quota-based sampling to proportionally match the socioeconomic characteristics of the study region between May 6th and June 3rd of 2022 for a final sample size of 658 responses. We compared the responses to state-level population data from the 2020 ACS 5-Year Survey and determined the sample is closely representative of the study area population.

We then assessed the extent to which the educational treatments shifted policy support using regression modelling (see Supplementary Material C for full model descriptions). A fixed-effects model evaluated whether our educational treatments significantly shifted respondent support for either of the gas tax alternatives. A multinomial logistic regression model evaluated possible associations between attitudinal, socioeconomic and travel-related factors with the likelihood of a respondent changing their support. All independent variables were taken directly from survey questions except for attitudinal variables, which were developed using principal-axis factor analysis from a series of Likert-scale attitudinal statements (see Supplementary Material D).

3. FINDINGS

We find respondents in our study were generally misinformed about the gas tax. 55% of respondents incorrectly believed the gas tax was a sales tax, rather than an excise tax; 50% incorrectly believed their state gas tax was increased within the last year; and 57% did not know what gas tax revenues are used for.

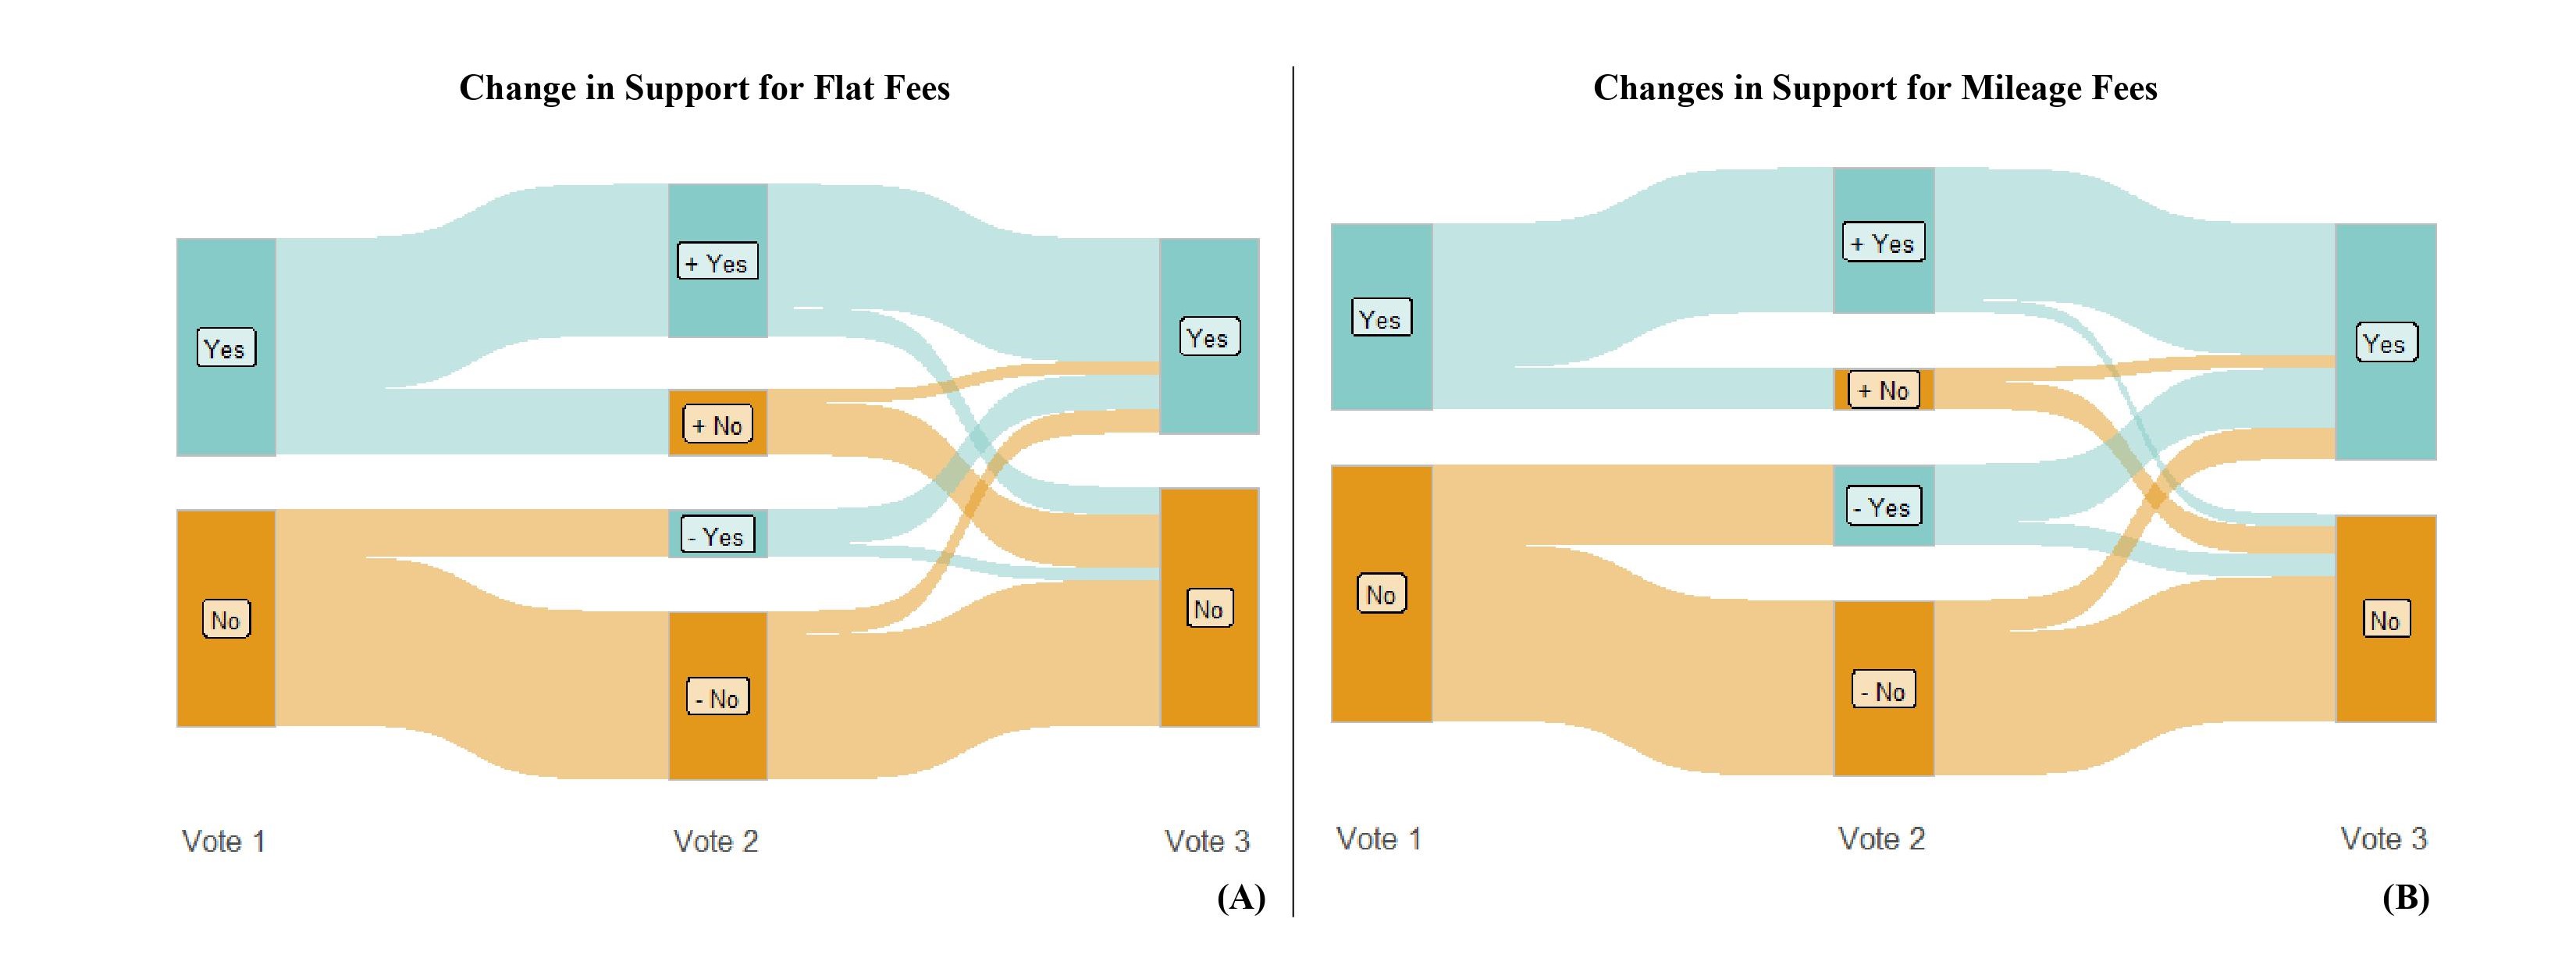
After engaging with policy-relevant education, policy support shifted substantially (Figure 1). Between the first and third vote, 34% of respondents changed their vote, with an 11% increase in support for mileage fees and a 4% decrease in support for flat fees.

Figure 1
Figure 1.Shifts in Support for Gas Tax Alternatives Before and After Education. A) Support for replacing the gas tax with a $220 flat fee, and B) Support for replacing the gas tax with a $0.02 per mile travelled fee.

The fixed effects models find these policy support changes were statistically significant (Table 2). Relative to a respondent’s first vote, the odds of supporting a mileage fee increase by more than 4 times while the odds of supporting a flat fee are cut in half after both the policy and cost education. Since we did not randomize the order of the educational treatments, we cannot state the independent effect of the policy education.

TABLE 2.Fixed Effects Model: Impact of Education on Individual Changes in Support for Gas Tax Alternatives
Mileage Fees Flat Fees
Predictors Odds Ratios St. Error p Odds Ratios St. Error p
Vote 2 (Cost Education) 3.10 0.66 <0.001 0.60 0.12 0.012
Vote 3 (Cost and Policy Education) 4.27 0.93 <0.001 0.53 0.11 0.002
NRespondent* 222 223
R2­adj ** 0.142 0.096

* Number of respondents who changed their vote at some point across the survey
** R2adj = 1 – [(Residual Deviance – K) / (Null Deviance)] where K is the number of additional parameters relative to the null model (Long 1997)

Several factors are associated with the effect of education on changes in policy support. Relative to those who did not change their vote (Table 3), we find support for flat fees is more likely to increase after both the policy and cost education amongst those who drove more (higher annual VMT), those who felt a mileage fee would be unfair to low-income households, and those with lower educational attainment. Support for flat fees is more likely to decrease after both the policy and cost education amongst households with more children, those who found out they would lose money with a flat fee, and those who were less resistant to change. Support for mileage fees increases after education amongst respondents who drove less and had higher incomes, while support decreases amongst those who drove more and had lower incomes. Notably, perceptions of mileage fee fairness are not statistically significant predictors of mileage fee support post-education.

Overall, we find lacking, or incorrect policy knowledge affects the reliability of public opinion research on mileage fees and that simple education experiences can address these knowledge gaps, providing more credible information to policy makers and researchers alike.

TABLE 3.Multinomial Logit Model: Factors Affecting Changes in Support for Gas Tax Alternatives after Education
Flat Fees Mileage Fees
No:Yes Yes:No No:Yes Yes:No
Predictors Odds Ratios St. Error Odds Ratios St. Error Odds Ratios St. Error Odds Ratios St. Error
(Intercept) 0.06** 0.07 0.43 0.39 0.79 0.69 0.20 0.24
SOCIO-DEMOGRAPHICS
Income (standardized) 0.40 0.25 0.46 0.24 0.43* 0.22 0.46 0.32
Reference: Employed
Retired 0.81 0.43 1.23 0.48 0.78 0.30 1.26 0.71
Unemployed 0.98 0.34 1.08 0.40 0.58* 0.18 1.15 0.52
Reference: White
Hispanic/Latino/Spanish 0.57 0.34 0.33* 0.21 0.27** 0.17 0.29 0.23
Other Race 0.97 0.47 0.80 0.37 1.32 0.52 0.92 0.49
Reference: Male
Female 2.32*** 0.72 0.92 0.23 2.10*** 0.52 1.02 0.35
Other Gender 1.65 1.08 1.65 0.80 2.31* 1.16 2.22 1.36
Reference: Some college education
Completed higher education 1.46 0.58 1.24 0.40 0.61* 0.18 0.83 0.36
Some High school 2.94*** 1.21 1.23 0.46 1.02 0.33 0.94 0.46
Age [yrs] 0.98* 0.01 1.01 0.01 1.00 0.01 1.00 0.01
Children 0.79 0.13 1.43*** 0.17 0.83 0.11 0.99 0.16
Household Size 1.00 0.18 1.20 0.18 1.11 0.16 1.06 0.22
ATTITUDES
Level of Altruism 0.78* 0.12 1.16 0.17 1.14 0.15 1.39* 0.26
Resistance to Change 1.07 0.17 0.80* 0.11 1.01 0.13 1.20 0.21
Vehicle Dependence 0.97 0.15 0.97 0.13 0.97 0.13 0.76 0.13
Reference: Neutral or fair opinion
Believe MF is unfair for rural 0.89 0.12 0.94 0.11 0.89 0.10 0.96 0.15
Believe MF is unfair to low income 1.29* 0.17 0.98 0.11 1.00 0.11 0.91 0.13
Reference: Not important
Future funding is important 0.89 0.11 0.84* 0.08 1.08 0.11 0.89 0.12
Privacy is important 1.14 0.15 1.06 0.13 0.93 0.10 1.07 0.17
Cost is important 1.05 0.15 0.89 0.11 0.88 0.10 1.08 0.18
COMMUNITY AND TRAVEL
Annual Vehicle Miles Travelled (standardized) 3.92* 2.89 1.14 0.94 0.33** 0.19 3.13* 1.88
Reference: Does not drive electric/hybrid vehicle
Drives electric/hybrid vehicle 0.44 0.49 0.35 0.24 0.54 0.43 0.93 0.66
Reference: Urban Core
High Commuting 1.63 0.53 0.99 0.28 1.18 0.33 1.21 0.43
Rural 1.18 0.39 0.86 0.24 1.08 0.28 0.53 0.22
COST
Reference: Losing money with the policy
Saving money with the policy 1.40 0.55 0.36** 0.14 1.07 0.27 0.51 0.22
Observations 590 590
R2 Tjur / R2 adjusted 0.120 / 0.118 0.083 / 0.081

* p-value less than 0.10, ** p-value less than 0.05, *** p-value less than 0.01

Submitted: July 20, 2024 AEST

Accepted: August 09, 2024 AEST

References

Agrawal, A. W., and H. Nixon. 2017. “What Do Americans Think about Federal Tax Options to Support Public Transit, Highways, and Local Streets and Roads? Results from Year Eight of a National Survey.”
———. 2022. “What Do Americans Think About Federal Tax Options to Support Transportation? Results From Year Nine of a National Survey.” Project 2208A. Mineta Transportation Institute. https:/​/​doi.org/​10.31979/​mti.2021.2101.
———. 2024. “Getting Mileage Fees Right: What Does the U.S. Public Think?” Public Finance and Management 23 (1–2): 22–73. https:/​/​doi.org/​10.1177/​15239721241243145.
Google Scholar
Agrawal, A. W., H. Nixon, and San Jose State University. College of Business. Mineta Transportation Institute. 2024. “What Do Americans Think About Federal Tax Options to Support Transportation? Results From Year Fifteen of a National Survey.” 24–12; What Do Americans Think About Federal Tax Options to Support Transportation? https:/​/​doi.org/​10.31979/​mti.2024.2428.
Althaus, S. 1996. “Opinion Polls, Information Effects, and Political Equality: Exploring Ideological Biases in Collective Opinion.” Political Communication 13 (1): 3–21. https:/​/​doi.org/​10.1080/​10584609.1996.9963092.
Google Scholar
Althaus, S. L. 1998. “Information Effects in Collective Preferences.” American Political Science Review 92 (3): 545–58. https:/​/​doi.org/​10.2307/​2585480.
Google Scholar
Axsen, J., K. S. Kurani, and B. K. Sovacool. 2023. “Consumer Response to Transformative Transportation Innovations: Advancing the Reflexive Participant Approach to Survey Research.” Transportation Research Interdisciplinary Perspectives 18:100759. https:/​/​doi.org/​10.1016/​j.trip.2023.100759.
Google Scholar
Banerjee, A. V., S. Kumar, R. Pande, and F. Su. 2011. “Do Informed Voters Make Better Choices? Experimental Evidence from Urban India.” Unpublished Manuscript.
CDOT and FHWA. 2017. “Colorado Road Usage Pilot Program Final Report.” Final Report CDOT-2017-11. Colorado Department of Transportation. https:/​/​rosap.ntl.bts.gov/​view/​dot/​39191.
Duncan, D., D. Li, and J. D. Graham. 2020. “Tax Rate Design and Support for Mileage User-Fees.” Transport Policy 93:17–26. https:/​/​doi.org/​10.1016/​j.tranpol.2020.04.017.
Google Scholar
Duncan, D., V. Nadella, A. Bowers, S. Giroux, and J. D. Graham. 2014. “Bumpy Designs: Impact of Privacy and Technology Costs on Support for Road Mileage User Fees.” National Tax Journal 67 (3): 505–30. https:/​/​doi.org/​10.17310/​ntj.2014.3.01.
Google Scholar
Duncan, D., V. Nadella, A. Clark, S. Giroux, and J. Graham. 2017. “Searching for a Tolerable Tax: Public Attitudes toward Roadway Financing Alternatives.” Public Finance Review 45 (5): Art.5. https:/​/​doi.org/​10.1177/​1091142116653818.
Google Scholar
Duncan, D., V. Nadella, S. Giroux, A. Bowers, and J. D. Graham. 2017. “The Road Mileage User-Fee: Level, Intensity, and Predictors of Public Support.” Transport Policy 53:70–78. https:/​/​doi.org/​10.1016/​j.tranpol.2016.09.002.
Google Scholar
Gastil, J., J. Reedy, and C. Wells. 2007. “When Good Voters Make Bad Policies: Assessing and Improving the Deliberative Quality of Initiative Elections The Voice of the Crowd - Colorado’s Initiative.” University of Colorado Law Review 78 (4): 1435–88. https:/​/​heinonline.org/​HOL/​P?h=hein.journals/​ucollr78&i=1443.
Google Scholar
Hanley, P. F., and J. G. Kuhl. 2011. “National Evaluation of Mileage-Based Charges for Drivers: Initial Results.” Transportation Research Record 2221 (1): Art.1. https:/​/​doi.org/​10.3141/​2221-02.
Google Scholar
HDOT. 2022. “Hawaii Road Usage Charge Demonstration Final Report (Volume 1).” https:/​/​hiruc.org/​final-report/​.
Knippenberg, D. van, and D. Daamen. 1996. “Providing Information in Public Opinion Surveys: Motivation and Abiliyt Effects in the Information-and-Choice Questionnaire.” International Journal of Public Opinion Research 8 (1): 70–82. https:/​/​doi.org/​10.1093/​ijpor/​8.1.70.
Google Scholar
Kuklinski, J. H., and P. J. Quirk. 2000. “Reconsidering the Rational Public: Cognition, Heuristics, and Mass Opinion.” In Elements of Reason, edited by A. Lupia, M. D. McCubbins, and S. L. Popkin, 1st ed., 153–82. Cambridge University Press. https:/​/​doi.org/​10.1017/​CBO9780511805813.008.
Google Scholar
Long, J. S. 1997. Regression Models for Categorical and Limited Dependent Variables. Vol. 7. SAGE.
Google Scholar
Morwitz, V. G., and C. Pluzinski. 1996. “Do Polls Reflect Opinions or Do Opinions Reflect Polls? The Impact of Political Polling on Voters’ Expectations, Preferences, and Behavior.” Journal of Consumer Research 23 (1): 53–67. https:/​/​doi.org/​10.1086/​209466.
Google Scholar
NAS. 2016. Public Perception of Mileage-Based User Fees. The National Academies Press. https:/​/​doi.org/​10.17226/​23401.
Google Scholar
Neijens, P. 1987. The Choice Questionnaire: Design and Evaluation of an Instrument for Collecting Informed Opinions of a Population. Free University Press.
Google Scholar
Neijens, P., J. A. De Ridder, and W. E. Saris. 1992. “An Instrument for Collecting Informed Opinions.” Quality and Quantity 26 (3): 245–58. https:/​/​doi.org/​10.1007/​BF00172428.
Google Scholar
Page, B. I., and R. Y. Shapiro. 1992. The Rational Public: Fifty Years of Trends in Americans’ Policy Preferences. University of Chicago Press. https:/​/​doi.org/​10.7208/​chicago/​9780226644806.001.0001.
Google Scholar
Price, V., and P. Neijens. 1997. “Opinion Quality in Public Opinion Research.” International Journal of Public Opinion Research 9 (4): 336–60. https:/​/​doi.org/​10.1093/​ijpor/​9.4.336.
Google Scholar
Whitty, J. M., and B. Imholt. 2005. “Oregon’s Mileage Fee Concept and Road User Fee Pilot Program.” Report to the 73rd Oregon Legislative Assembly. Oregon Department of Transportation. https:/​/​library.state.or.us/​repository/​2011/​201109060922392/​index.pdf.

This website uses cookies

We use cookies to enhance your experience and support COUNTER Metrics for transparent reporting of readership statistics. Cookie data is not sold to third parties or used for marketing purposes.

Powered by Scholastica, the modern academic journal management system