RESEARCH QUESTIONS AND HYPOTHESES
Traffic lights increase road safety but are also a source of delay for cyclists. Cyclists have a certain aversion when approaching (signalized) intersections because they will likely have to slow down, stop, and subsequently pedal harder to regain their former speed (Fajans and Curry 2001). As a result, cyclists may ignore red lights, which is very risky (Pai and Jou 2014; Fraboni et al. 2016) or avoid traffic lights altogether (Sener, Eluru, and Bhat 2009; Bernardi, La Paix-Puello, and Geurs 2018).
In order to reduce waiting times for cyclists, several measures for traffic control have already been introduced or examined in Dutch and other European cities, such as green waves (De Angelis et al. 2019). Recently, the municipality of Enschede, a city with about 160,000 inhabitants in the eastern part of the Netherlands, has introduced SMART Green (Rottier 2017), which gives a faster green light for cyclists who use a dedicated smartphone app called SMART (Self Motivated and Rewarded Travelling). Its introduction is part of a cycling policy plan (Enschede Cycling City 2020) implemented by the municipality of Enschede to increase the modal share of cyclists on short distances (<7.5 km) from 34% in 2012 to 40% in 2020. The SMART app interacts with several traffic lights throughout Enschede and, by sharing their location, cyclists using the app — referred to now as SMART cyclists — have a greater chance of shortening their waiting time when approaching certain traffic lights.
In this article, we examine the differences between actual and perceived waiting times of SMART cyclists at signalized intersections in Enschede and the variation between different socio-economic groups. While there are published accounts of perceived waiting times among drivers (Vreeswijk, Van Berkum, and Van Arem 2015; Mao et al. 2018), it is our belief that this is the first work that shows how cyclists perceive waiting times at signalized intersections. Our hypothesis is that cyclists’ perceived waiting time is higher than their actual waiting time. Furthermore, some studies in the literature show that gender and age may play a role with respect to perceived waiting times (Fan, Guthrie, and Levinson 2016; Cascajo et al. 2018). Our hypothesis is that males and younger people have higher perceived waiting times than females and elderly people.
METHODS AND DATA
Two sources of data are used for this experiment. First, a short in-app survey was conducted among SMART cyclists for obtaining their perceived waiting time and demographics (age and gender). Only SMART cyclists who regularly use the SMART app and cycle through the streets of Enschede were invited to fill out the survey, resulting in 238 survey respondents out of 1,949 invited SMART app users.
Second, the actual waiting time per traffic light was automatically measured by means of the SMART app and stored on the MoveSmarter platform (Thomas et al. 2018). The stored data is based on one week of continuous measuring of SMART cyclists’ whereabouts. Moreover, the data contain the number of traffic light passages along with the percentage of times cyclists had to wait, and the average waiting time in seconds. Considering the 1,949 SMART app users invited for our experiment, approximately 31,000 traffic light passages were observed during the one-week period. Furthermore, 42% of those passages resulted in cyclists having to wait for the green light with an average waiting time of 26 seconds.
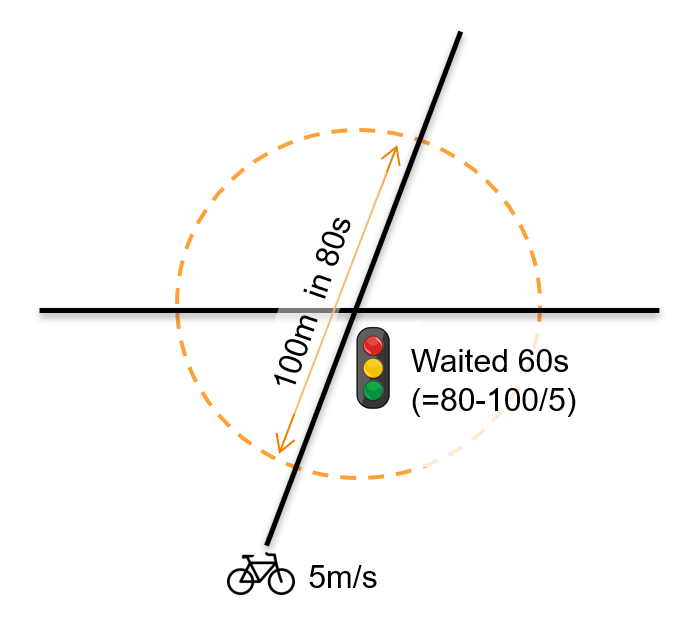
In addition, all bicycle trips collected by the SMART app were recorded as map matching-based entries and circles with a radius of 50 meters were drawn around traffic lights. When a trip entry intersected with a circle, a routine was used to calculate whether a cyclist had lost time at that traffic light. Lost time is calculated as the time the cyclist needs to pass through the circle minus the cyclist’s distance in the circle divided by their personal average cycling speed.
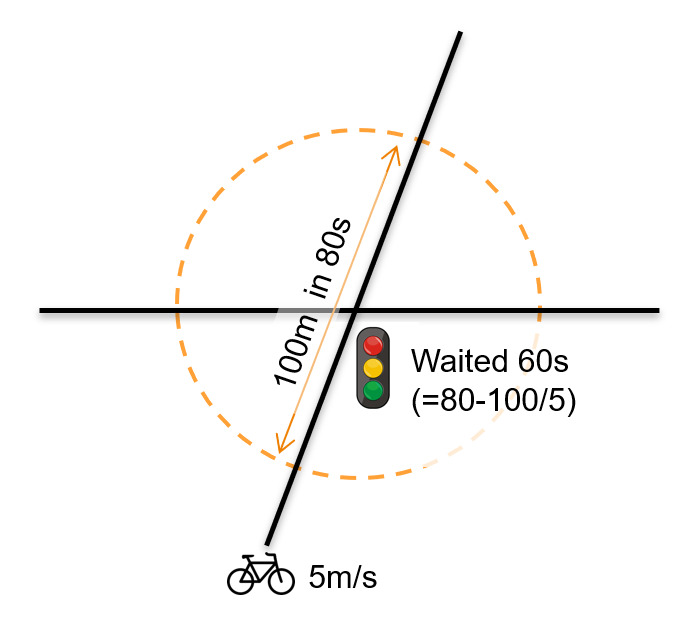
Figure 1 shows an example of a cyclist with an average speed of five meters per second taking 80 seconds to cross the circle. Because it is expected to take 20 seconds to do so, it is assumed that the cyclist had to wait 60 seconds for the green light.
SMART complies with EU General Data Protection Regulation; the data is securely stored and all analysis is done on aggregated datasets where the data cannot be traced back to individual users. This method ensures that participants remain completely anonymous. In this research, we only use the lost time statistics of each traffic signal aggregated over the one-week period. Out of 238 survey respondents, we observed the actual waiting times of 202 of them. The remaining 36 apparently did not use the app during that period. As a result, only the actual waiting times of 202 SMART cyclists are considered in our analysis.
FINDINGS
The mean and standard deviation of the perceived and actual waiting times (both measured in seconds) are estimated and shown in Table 1.
Given that both variables are not normally distributed, the Wilcoxon signed-rank test was used to examine if perceived and actual waiting times significantly differ (α = .05). The SMART cyclists’ perceived waiting time was approximately five times higher than their actual waiting time; Z = −11.92, p < .001.
When looking at the mean perceived waiting time, it appears that most cyclists considerably overestimate their waiting time, which confirms our hypothesis. This shows traffic lights are perceived by cyclists as an important source of delay. However, we observed that most cyclists estimated waiting time in round numbers (e.g., 30 seconds, 45 seconds, 60 seconds and so forth), given that the frequencies of those numbers were higher than the rest. It comes therefore as no surprise that, based on its large standard deviation, the perceived waiting time varied largely among cyclists and it may consequently be rather biased.
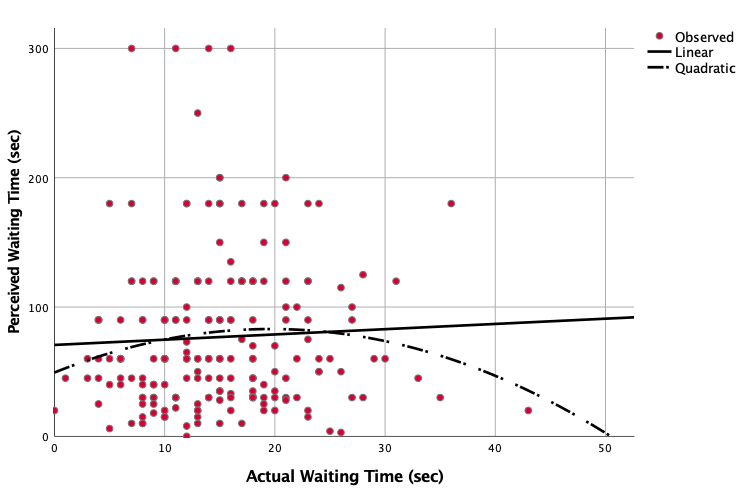
Regression analyses were also performed to test if we could predict perceived waiting time from actual waiting time. Linear regression and a nonlinear (quadratic function) regression have been tested but none were successful (note that a regression analysis with a logarithmic transformation to the dependent variable was also tested without success). Figure 2 and Table 2 summarize the results, which are in line with the literature. That is, subjective time does not necessarily bear a straightforward connection to physical objective time (Tenenboim and Shiftan 2016). Similarly, waiting time in (public) transport is also typically overestimated (Van Hagen, Galetzka, and Pruyn 2014).

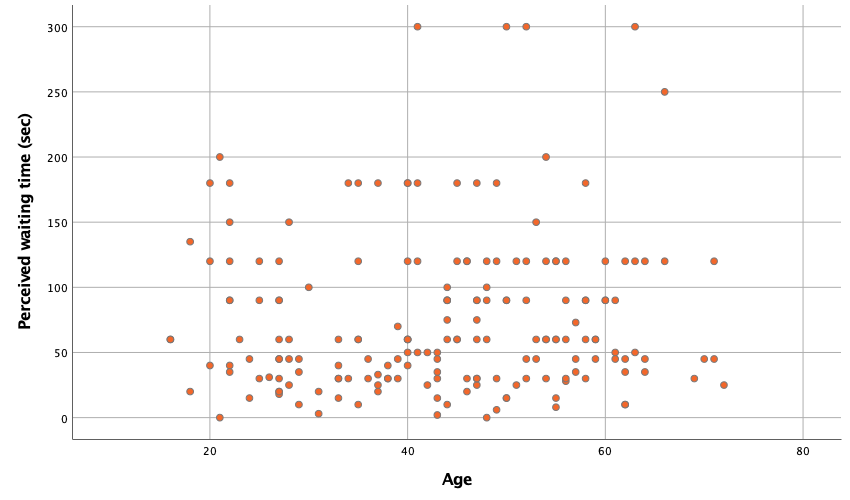
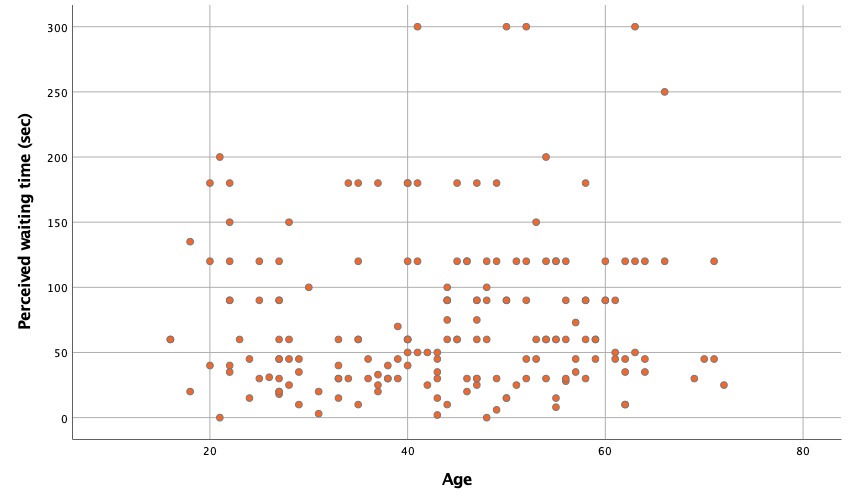
Next, a Pearson product–moment correlation coefficient was computed to assess the correlation between the cyclists’ age and their perceived waiting time. Our analysis shows that there is no correlation between the two variables, r = .068, n = 185, p = .356. A scatter plot summarizes the results (Figure 3).
Finally, an Independent Samples t-Test was conducted to compare perceived waiting time between male and female cyclists. There was no significant difference in the perceived waiting time for male cyclists (M = 71, SD = 47) and female cyclists (M = 86, SD = 71); t (92.289) = −1.37, p = .175. Similar to results based on age, these results suggest that gender does not have an effect on perceived waiting time. Specifically, our results suggest that female and male cyclists perceive waiting times the same way.
ACKNOWLEDGMENTS
The authors would like to thank the municipality of Enschede and Mobidot for making this experiment possible.