
1. Questions
Whether it’s sidewalks, parks, or public squares, public spaces make up a large part of a city’s surface area. Many of them are being redesigned to better meet the needs of the population to support active transport and social activities, while minimizing their negative impacts. Since the COVID-19 pandemic, the importance of public spaces has been even more pronounced. Yet, objective measures are required to evaluate their use in terms of activities, transport and user characteristics.
To manage, plan, and organize these spaces, professionals and researchers need to better understand how they are used, namely through counts of the various users and their activities, and these users’ attributes such as age and gender. While several manual tools and methods exist to analyze public spaces, there is a need for new data gathering tools to improve the efficiency of the process (e.g. obtaining digital data ready to analyze) and the accuracy of spatial and temporal data. The tool presented in this study is a mobile application (for cell phones, tablets, and browsers) where observers record manually observations of the public space users. While automated tools using artificial intelligence for human activity recognition have made progress, their performance is not sufficient yet for real world applications. This paper addresses the following question: is it possible to perform a simple analysis of users and their activities in any space using the proposed application? To answer this question, a case study about a specific public space is analyzed. Simultaneously, as data is manually inputted by several human observers in the application, the inter-observer variability of the observers is evaluated.
2. Methods
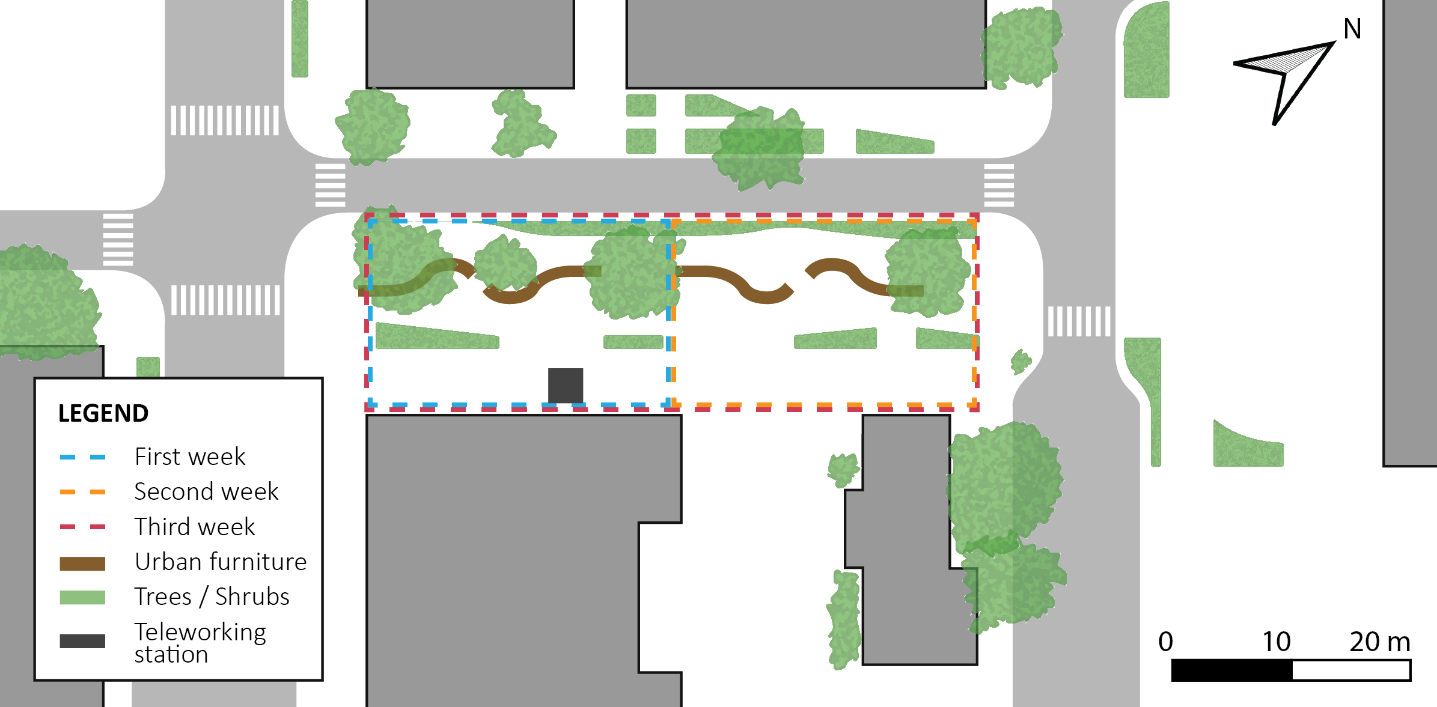
The case study is carried out at Shamrock Place in Montreal, Canada. It has been re-built in 2018. Close to this place is the Jean-Talon public market, the largest in the city, and two busy arterials, Jean-Talon Street and Saint-Laurent Boulevard. It is a space of approximately 900 m2 where it is possible to find several tables and seats (Montreal city 2022). During the observations, the space included a teleworking station, and free wireless internet access (see Figure 1).

Each observation of a person or group is characterized by three typical attributes for this case study, based on the principles of the Gehl Institute (Public Life Data Protocol) (Gehl Institute 2022): activities, group size and posture (see Table 1). Too many attributes may come with an undesired level of complexity, where the observers have too much to input in the application and cannot record all the observations.
The observation sessions are spread over three separate weeks (June 21-27th, July 5-11th and July 12-18th, all in 2021) with three sessions planned per week. Each session is scheduled to be done between approximately 12:30 and 13:30. The Public Life Data Protocol mentioned observation session of 10 to 15 min, but the session duration was extended to cover the typical lunch break interval and the same time afterwards for comparison.
A small group of five observers was recruited. For this study, most observation sessions have a different pair of observers, with the same “reference observer” participating in each session to compare how different observers collect data in the same situation. A brief explanation is given to each observer to help them understand the objectives and context, without any further guidance on the attributes to observe.
Finally, the data are interpreted in terms of the number and proportions of observations where a particular attribute value is selected for each attribute and observer. The Manhattan distance is computed between the vectors of the proportions of observations for each value of the attribute between the two observers at the same session. The distance for each pair of observers i and j is called the difference indicator (DI) and computed as follows:
DIi,j= K∑k=1|pi,k−pj,k|
With is the proportion of observations when the attribute value k is observed by observer i and K is the number of possible attribute values.
3. Findings
The results obtained during that case study are filtered due to missing data or bugs with the application. Six different observation sessions remain.
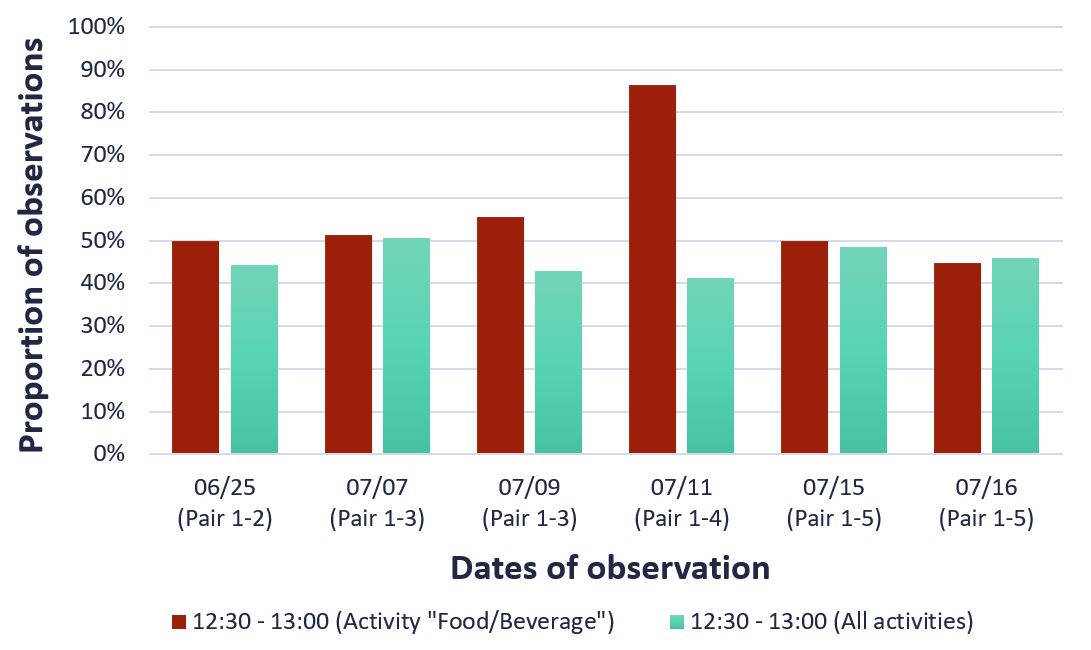
Given the focus on lunch time, Figure 2 shows the proportions of all activities and food-related activities before 13:00: less than half of the observations for all activities are made before 13:00 on five of the six days, while most of the observations for the “Food/Beverage” activity are made before 13:00. The space appears to be used more after 13:00, which may demonstrate a more transient use rather than people having lunch consistently before 13:00.

Figure 3 shows that the DI for the attribute “Posture” is slightly higher than the one for the attribute “Group size” for four observer pairs, which is expected for a non-exclusive attribute compared to an exclusive attribute. Indeed, a higher difference is possible since more than one value can be selected. The DI for the attribute “Activities” shows the largest differences, as it is non-exclusive and has more values. The DI for “Activities” is especially large for pairs 1-4: after reviewing the data, the 4th observer chose only one activity per observed group, while the other observers usually selected several (when applicable).
_for_each_attribute__per_session_and_pair_of_observers_in_2021.jpg)
The app also recorded how observers used the application, i.e., the number of clicks made per observation, the average duration per observation and the proportion of “mis-clicks” made per observation on average (see Table 2). Mis-clicks are situations where the observer first selects an attribute value, then deselects it before submitting the observation.
The first observer has the highest average number of attributes per observation, while producing the fewest mis-clicks. This is expected given the longer experience of the first observer through the sessions: this result and the misunderstanding of the fourth observer for the Activity attribute demonstrate the importance of training to improve the observation performance.
This first study demonstrates the usefulness of the prototype application to record and analyse several aspects of the space as well as some characteristics of the observations and observers themselves. Given the results on inter-observer variability, more case studies with more observers in different situations will help to better characterize the variability and measure the accuracy of the observations.
Acknowledgments
The authors wish to acknowledge the financial support of the National Science and Engineering Research Council of Canada (NSERC) through its undergraduate student research award program. The authors also wish to thank the students who helped collect data and provided early feedback on the application.