Loading [Contrib]/a11y/accessibility-menu.js
Skip to main content
null
Findings
  • Menu
  • Articles
    • Energy Findings
    • Resilience Findings
    • Safety Findings
    • Transport Findings
    • Urban Findings
    • All
  • For Authors
  • Editorial Board
  • About
  • Blog
  • covid-19
  • search

RSS Feed

Enter the URL below into your favorite RSS reader.

http://localhost:3561/feed
Transport Findings
February 23, 2024 AEST

If Transit is Free will Older Adults use it More? A Longitudinal Analysis

Meredith Alousi-Jones, Ahmed El-Geneidy,
Free farepublic transit fareolder adultspublic transit useperceptionsCanadatravel behavior
Copyright Logoccby-sa-4.0 • https://doi.org/10.32866/001c.93917
Findings
Alousi-Jones, Meredith, and Ahmed El-Geneidy. 2024. “If Transit Is Free Will Older Adults Use It More? A Longitudinal Analysis.” Findings, February. https:/​/​doi.org/​10.32866/​001c.93917.
Save article as...▾
Download all (4)
  • Figure 1. Region of Montréal where older adults (65+) receive a free public transit fare
    Download
  • Figure 2. Change in public transit use of those who did not anticipate a change in their behaviour once the fare became free (N=242)
    Download
  • Figure 3. Change in public transit use of those who anticipated an increase once the fare became free (N=160)
    Download
  • Manuscript File
    Download

Sorry, something went wrong. Please try again.

If this problem reoccurs, please contact Scholastica Support

Error message:

undefined

View more stats

Abstract

Free public transit for older adults is a policy often advocated for to increase ridership and reduce their dependence on automobiles. In July 2023 public transit became free on the island of Montréal for older adults (65+). Drawing from longitudinal repeated survey data collected in February 2023 and September 2023 and in-depth interviews collected in November 2023, we study the impacts of free public transit fare policy on older adults’ (65+) frequency of public transit use and satisfaction with service. We did not observe any change in public transit use among those who anticipated increased use in the before period, nor among those who anticipated no change in their use after the implementation of the free fare policy. We observed a positive change in the perception of the convenience of public transit after the implementation of the free fare policy for older adults.

1. Questions

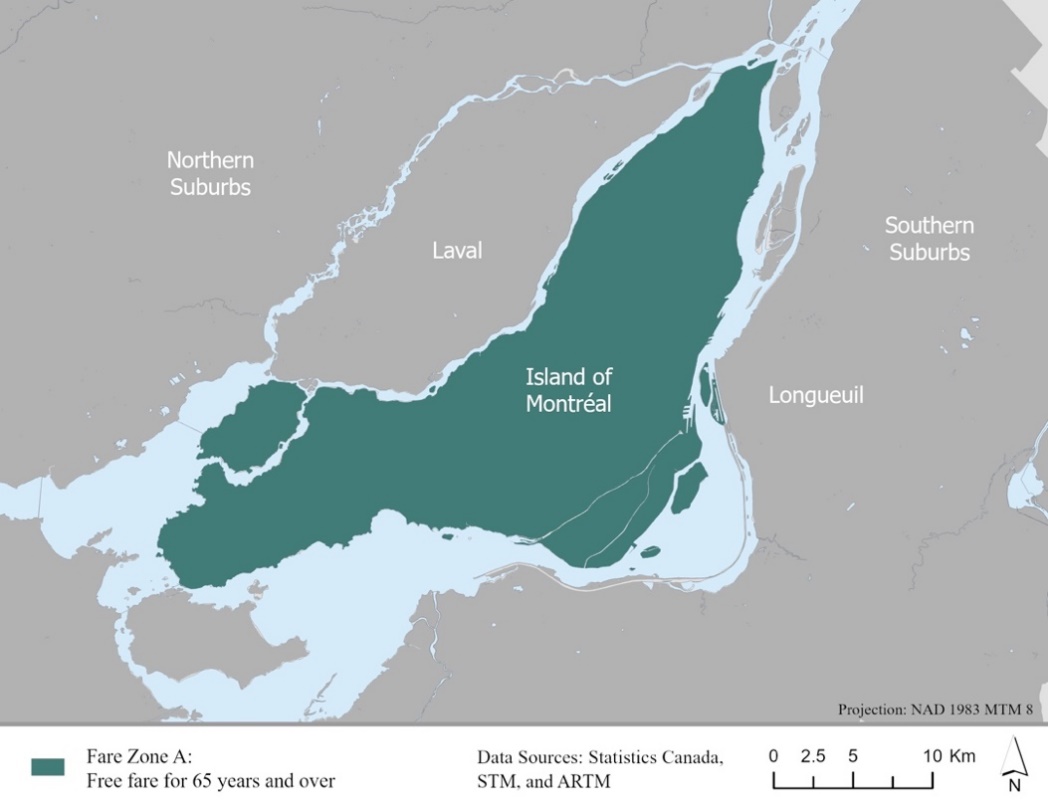
As driving cessation becomes more prevalent with age, older adults may turn toward alternative modes such as public transit to fulfill their daily travel needs (Latham-Mintus, Manierre, and Miller 2021; Musselwhite and Shergold 2012). Reduced or free transit fares for older riders could prove to be a valuable strategy in easing the financial burden travel represents, ensuring public transit remain an affordable option (Mackett 2014; Vecchio et al. 2022; Wong et al. 2018). Reducing or eliminating fares has also, in various contexts, led to increases in ridership and in customer satisfaction, though the results can vary greatly depending on the area and the targeted population (Cervero 1990; D’Alessandro 2008; Saphores, Shah, and Khatun 2020; Volinski et al. 2012). A first among Canada’s large cities, as of July 1st , 2023, Montréal, Canada residents aged 65 and over were eligible to use public transit for free on the island (Fare Zone A as depicted in Figure 1) (Du Ruisseau 2022a, 2022b; Magder 2022).

This research examines the following questions (1) Has the free fare impacted older Montréalers’ frequency of public transit use? (2) Beyond the impact of the free fare on behaviour, have older Montréalers’ perceptions and overall satisfaction with the region’s transit services changed since the free fare was instituted?

Figure 1
Figure 1.Region of Montréal where older adults (65+) receive a free public transit fare

2. Methods

This research uses data from the bilingual and longitudinal Aging in Place survey (Alousi-Jones et al. 2023), which was disseminated among Canadians over the age of 65. The first wave (Wave 1) of the survey was collected in February 2023 (N=1,435), a couple of months after the free fare was announced. The same respondents were contacted again in September 2023 (N=786), two months after the free fare was implemented (Wave 2). Only respondents residing on the island of Montréal who answered both waves of the survey completely (N=427) are included in our analysis.

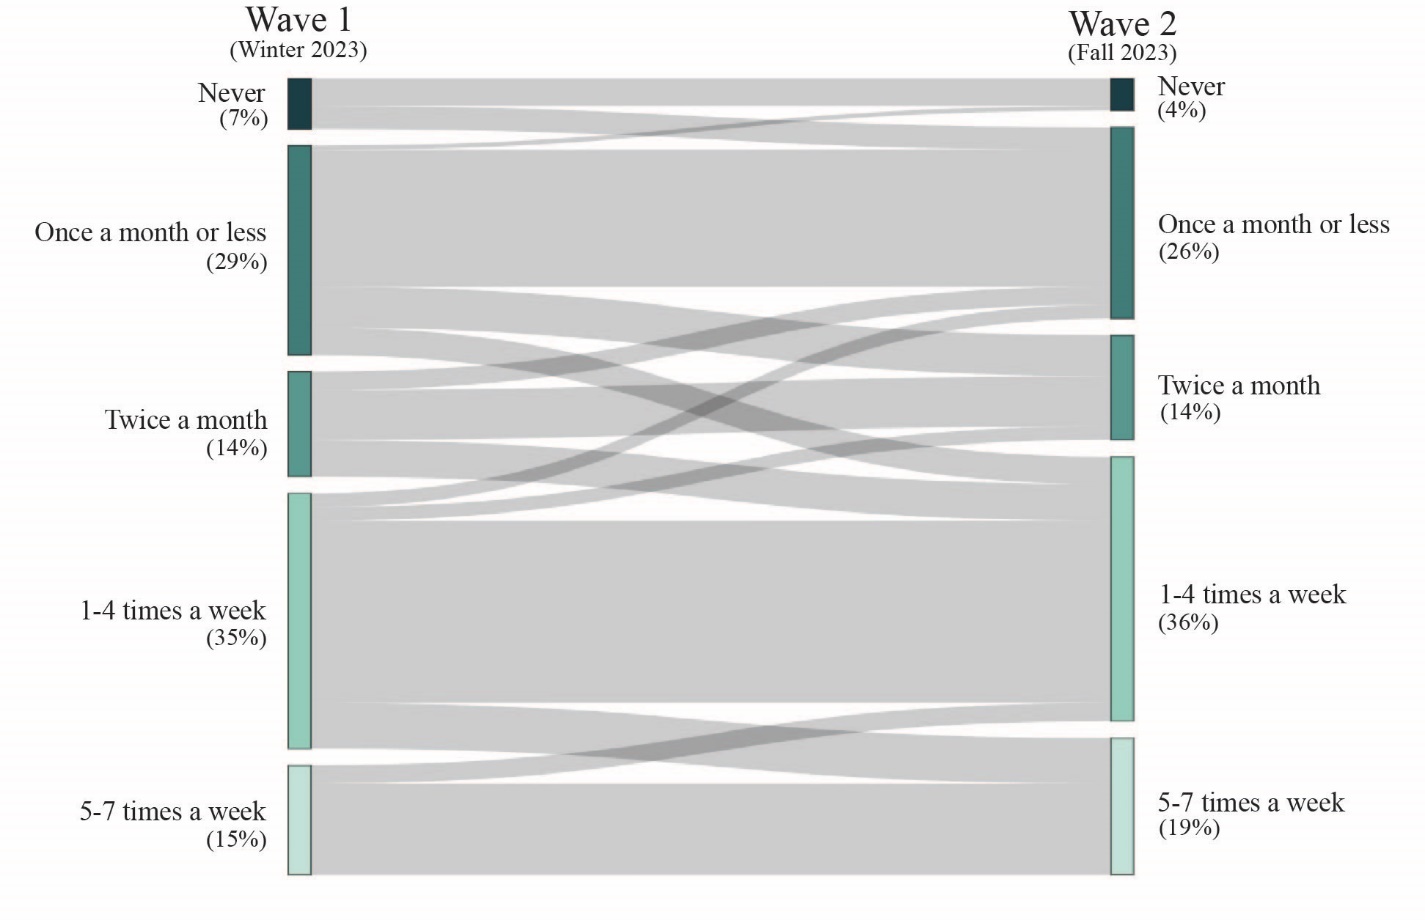
In both waves, respondents were asked how frequently they have used public transit in their region in the past twelve months, answers ranging from every day to never. These answers were then binned into five categories to simplify the comparison between waves. Moreover, in the survey’s first wave, respondents were asked if they anticipated a change (i.e., decrease, no change, increase) in their use of public transit once the free fare policy is implemented.

Perceptions towards public transit were collected in both waves and measured on a 4-point scale for overall satisfaction with the public transit services in the region and for perception of public transit service reliability and convenience, to uncover any associations between these perceptions and the free fare policy (D’Alessandro 2008) using the Wilcoxon signed-rank test.

In addition to the longitudinal survey, ten in-depth interviews were conducted in November 2023 with respondents from the survey who agreed to be part of a follow-up study. This qualitative data offers a more nuanced understanding of older Montréalers’ perspectives on the free transit fare. The interviews were conducted in French or English according to the interviewee’s preference, and the French interviews were then translated to English by the research team and analyzed using a thematic analysis approach.

3. Findings

Frequency of public transit use

The City’s main stated desired outcome of the free fare policy was to increase public transit use among older adults in the region. Our findings, however, show that both respondents who did not anticipate a change in their frequency of public transit use (Figure 2) and those who did anticipate an increase in their frequency of transit use (Figure 3) did not, in actuality, increase their frequency of use.

Figure 2
Figure 2.Change in public transit use of those who did not anticipate a change in their behaviour once the fare became free (N=242)
Figure 3
Figure 3.Change in public transit use of those who anticipated an increase once the fare became free (N=160)

A small number of frequent riders who used public transit at least once per week (Figure 2 and 3) reported increasing their public transit use (N=18). This was accompanied by a bigger decrease of public transit use among those in the same category (N=27). Very few non-riders (N=9) (i.e., those who reported not having used public transit in the last 12 months) started using public transit after the free fare was implemented (Figure 2 and 3).

Perceptions of public transit

As can be observed in Table 1, the free fare policy did not result in many statistically significant changes in perceptions of public transit among our sample. When comparing wave 1 and wave 2 results among transit users (N=351), we see slight differences in the average perceptions of transit. However, the only statistically significant increase in average perception between wave 1 and wave 2 was respondents’ perception of public transit convenience. This can be either related to the free fare or seasonality as the second wave was conducted in the fall, during more temperate weather when compared to the winter when the first wave was collected.

Table 1.Respondents’ distribution and average agreement with survey questions relating to overall satisfaction with public transit and perceptions of public transit reliability and convenience in wave 1 and wave 2
Wave 1 (Winter 2023) Wave 2 (Fall 2023)
“Overall, I am satisfied with the public transit services in my region”
Proportion Average Proportion Average
Strongly agree (4) 35.6% 3.20 35.0% 3.21
Agree (3) 50.1% 53.3%
Disagree (2) 12.5% 9.4%
Strongly disagree (1) 1.7% 2.3%
“Public transit in my region is a reliable way of traveling”
Proportion Average Proportion Average
Strongly agree (4) 28.8% 3.13 32.2% 3.20
Agree (3) 57.0% 57.0%
Disagree (2) 12.8% 9.4%
Strongly disagree (1) 1.4% 1.4%
“Public transit in my region is a convenient way of traveling”
Proportion Average Proportion Average
Strongly agree (4) 50.7% 3.40* 57.8% 3.53*
Agree (3) 41.0% 37.6%
Disagree (2) 6.3% 4.0%
Strongly disagree (1) 2.0% 0.6%

* Statistically significant increase in average perception of PT convenience between wave 1 and wave 2 according to the Wilcoxon signed-rank test

In-depth interviews

Though we did not observe a statistically significant increase in frequency of public transit use or in satisfaction with transit except for convenience, the interviews with respondents provide more insight into older Montréalers’ perspective on the free fare. Aligning with the City’s stated goal for the free fare to aid in countering the effect of inflation, one interviewee mentioned that older adults’ income is often fixed, and since they “lose every year [due to inflation], free transit helps compensate for it a bit.” However, many interviewees stated their appreciation of the free fare and the sense of freedom and convenience it provides, yet thought it could be an initiative better directed at lower-income residents rather than at older adults.

It is important to note that changes in travel behaviour might take longer to be observed, especially since older Montréalers benefited from a reduced fare beforehand (the reduced 65+ monthly fare was previously $28.25 CAD, or 30% of the regular fare). Though the sample size used in this study is limited, the findings can provide valuable insights into how the expectations of such an initiative can differ from the outcomes for this particular age group in the short term.


Acknowledgment

We would like to thank Merrina Zhang and Isabella Jimenez from the National Research Council of Canada (NRC) for their feedback on the survey design and Dr. Aryana Soliz for her help in conducting the in-depth interviews. Thanks to Yasser Kazma and Daniel Schwartz from McGill IT services for their support in managing the surveys. This research was funded by the National Research Council Canada’s grant Getting Around to Age in Place: Meeting Older Canadians Transport Needs (NRC AiP-023-1).

Submitted: November 11, 2023 AEST

Accepted: February 12, 2024 AEST

References

Alousi-Jones, M., T. Carvalho, A. Gerebtzoff, L. Johannson, R. Joly-Simard, M. Zhang, I. Jimenez, and A. El-Geneidy. 2023. “Getting around to Age in Place: Meeting Older Canadians’ Mobility Needs via Public Transportation.” Montréal, Canada: Transportation Research at McGill (TRAM). https:/​/​tram.mcgill.ca/​Research/​Surveys/​Aging/​Aging_in_place_NRC_2023.pdf.
Cervero, Robert. 1990. “Transit Pricing Research.” Transportation 17 (2): 117–39. https:/​/​doi.org/​10.1007/​bf02125332.
Google Scholar
D’Alessandro, Antonio. 2008. “Fare-Free Transit – A Strategy for Sustainable Transportation.” http:/​/​conf.tac-atc.ca/​english/​resourcecentre/​readingroom/​conference/​conf2008/​docs/​j1/​dallesandro.pdf.
Du Ruisseau, Olivier. 2022a. “La Gratuité Du Transport Collectif Pour Les Aînés, Une «fausse Bonne Idée»?” Le Devoir, 2022. https:/​/​www.ledevoir.com/​economie/​772437/​transport-collectif-la-gratuite-pour-les-aines-une-fausse-bonne-idee?
———. 2022b. “Le Transport Collectif Sera Gratuit Pour Les Aînés à Montréal Dès Juillet 2023.” Le Devoir, 2022. https:/​/​www.ledevoir.com/​societe/​transports-urbanisme/​771982/​le-transport-collectif-sera-gratuit-pour-les-aines-a-montreal-des-juillet-2023?utm_source=recirculation&utm_medium=hyperlien&utm_campaign=corps_texte.
Latham-Mintus, Kenzie, Matthew Manierre, and Keith Miller. 2021. “Staying Connected: Alternative Transportation Use, Neighborhoods, and Social Participation Among Older Americans.” The Gerontologist 62 (1): 75–88. https:/​/​doi.org/​10.1093/​geront/​gnab084.
Google Scholar
Mackett, Roger. 2014. “Has the Policy of Concessionary Bus Travel for Older People in Britain Been Successful?” Case Studies on Transport Policy 2 (2): 81–88. https:/​/​doi.org/​10.1016/​j.cstp.2014.05.001.
Google Scholar
Magder, Jason. 2022. “Public Transit Free for Seniors on the Island of Montreal as of July.” Montreal Gazette, 2022. https:/​/​montrealgazette.com/​news/​local-news/​public-transit-to-be-free-for-seniors-on-island-of-montreal-as-of-july-source-says.
Musselwhite, Charles B. A., and Ian Shergold. 2012. “Examining the Process of Driving Cessation in Later Life.” European Journal of Ageing 10 (2): 89–100. https:/​/​doi.org/​10.1007/​s10433-012-0252-6.
Google ScholarPubMed CentralPubMed
Saphores, Jean-Daniel, Deep Shah, and Farzana Khatun. 2020. “A Review of Reduced and Free Transit Fare Programs in California.” The University of California Institute of Transportation Studies. https:/​/​escholarship.org/​content/​qt74m7f3rx/​qt74m7f3rx_noSplash_cca76ce837d97ca240612898d7011cba.pdf?t=q4ipp5.
Vecchio, Giovanni, Ignacio Tiznado-Aitken, Bryan Castillo, and Stefan Steiniger. 2022. “Fair Transport Policies for Older People: Accessibility and Affordability of Public Transport in Santiago, Chile.” Transportation, November. https:/​/​doi.org/​10.1007/​s11116-022-10346-0.
Google ScholarPubMed CentralPubMed
Volinski, Joel, National Research Council, Transit Cooperative Research Program, Transportation Research Board, and National Academies of Sciences, Engineering, and Medicine. 2012. “Implementation and Outcomes of Fare-Free Transit Systems.” Washington, D.C.: Transportation Research Board. https:/​/​doi.org/​10.17226/​22753.
Wong, R.C.P., W.Y. Szeto, Linchuan Yang, Y.C. Li, and S.C. Wong. 2018. “Public Transport Policy Measures for Improving Elderly Mobility.” Transport Policy 63 (April):73–79. https:/​/​doi.org/​10.1016/​j.tranpol.2017.12.015.
Google Scholar

This website uses cookies

We use cookies to enhance your experience and support COUNTER Metrics for transparent reporting of readership statistics. Cookie data is not sold to third parties or used for marketing purposes.

Powered by Scholastica, the modern academic journal management system