


1. Questions
The COVID-19 pandemic disproportionately impacted older adults (Miller 2020), yet a gap remains in understanding how their travel behaviors specifically adapted to this unprecedented event. Although existing studies explore ridership recovery trends of the general population (e.g., Rowlands and Loh 2023), few research captures the nuances of how these patterns differ for older adults. We examined older adults’ transit usage before and during COVID-19 and the trends of recovery through a case study of subway travel by older adults in Washington, D.C. Three research questions frame our study:
-
What are the subway travel patterns of older adults before and after COVID-19?
-
How did the trend of recovery of subway ridership of older adults compare to that of the general public?
-
Which subway stations attract the largest number of older adults’ trips before and after COVID-19?
2. Methods
The Washington Metropolitan Area Transit Authority (WMATA) uses an electronic payment system called SmarTrip card, which users scan on a reader when entering and exiting the agency’s system. The agency offers a reduced fare program through its Senior SmartTrip card for travelers who are 65 and older (WMATA, n.d.), enabling researchers to capture older adults’ travel patterns only, separate from the rest of the system’s users. Most transit studies of older adults rely on questionnaire-based surveys (Ravensbergen et al. 2023; Truong and Somenahalli 2015), which are useful for understanding transit service quality but lack accuracy of travel behavior. Recent studies (e.g., Liu et al. 2021 on Japanese older adults) have used smart card data to understand older adults’s travel behavior. Our work extends this growing methodological exploration for older adult travel behavior analysis, making an important contribution to the field.
We examined the Senior SmarTrip card data for years 2018-2022, during the month of October, which is a representative month of analysis for the agency (G. Pincus, personal communication, September 21, 2023). Our data represents the entire number of subway trips (n = 548,699) taken by older adults who used the smart card. The data included date of travel, entry and exit hours, origin and destination stations, and the number of trips per origin-destination pair within a 15-minute period. The unit of analysis is an entry-exit (origin-destination) pair within a 15-minute period. We divided the five years into three periods: pre (2018 and 2019), early (2020), and late COVID (2021 and 2022), following the Centers for Disease Control and Prevention’s (CDC) timeline (CDC, 2023). We also used “points of interest” and “places of worship” data on Open Street Maps. This was merged with WMATA’s subway station map to understand the relationship between older adults’ travel and destinations that may attract them. Additionally, we used Metrorail ridership data for trips taken by all users published in WMATA’s Ridership Data Portal to compare COVID recovery patterns between older adults and all users.
3. Findings
Daily subway travel patterns before and after COVID
For the five years we examined, our findings confirm what is known about the travel patterns of older adults (e.g., in Shen et al. 2017) that: a) The largest proportion of their travel takes place during midday peak (10:00am – 4:00pm) during weekdays and weekends and b) they travel more on weekdays than weekends. We found this to be the case regardless of the pandemic.
Travel patterns of older adults showed drastic changes during COVID in our work as previous studies (e.g., Ravensbergen and Newbold 2020) demonstrated. We noticed the negative impact of COVID on subway usage, with the ridership dropping more than half compared to the pre pandemic level (Figure 1).
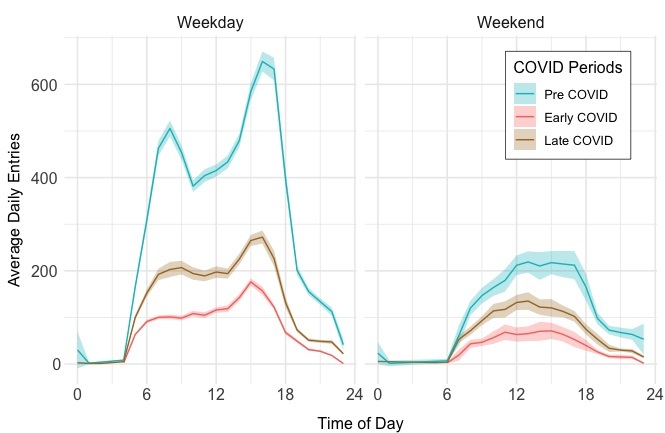
Weekday trips by older adults decreased 10% more than weekend trips during the early and late COVID periods. Pre COVID, weekday trips were 178% more than weekend trips on average while the average trips were 113% more on weekdays than weekends during the early and late COVID periods. The narrowing of the gap between weekday and weekend trips can be explained in terms of a higher reduction of weekday trips during the pandemic. A similar pattern by all users (i.e. higher reduction of weekday trips compared to weekend trips) is reported previously (e.g, Rowlands and Loh 2023).
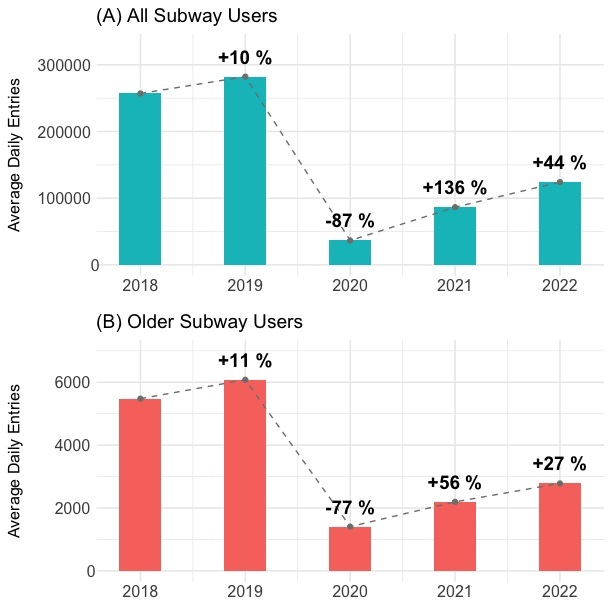
Our study reveals a new insight that the average number of all trips (weekend and weekday) by older adults fell 77% during early COVID (2020), which is lower than the drop for trips by all subway users (Figure 2). However, trips by older adults recovered slower than that of all users. Possible explanations include the higher proportion of non-discretionary trips (such as commuting to work and school) by the general public during the late COVID period compared to older adults. Additionally, older adults may choose to retire after COVID (D’Angelo et al. 2024; Marcus 2021).
What destinations attract older adults?
We examined areas near subway stations to understand what destinations attract older adults. Figure 3 highlights a map of stations that showed the highest number of exits from the subway system.

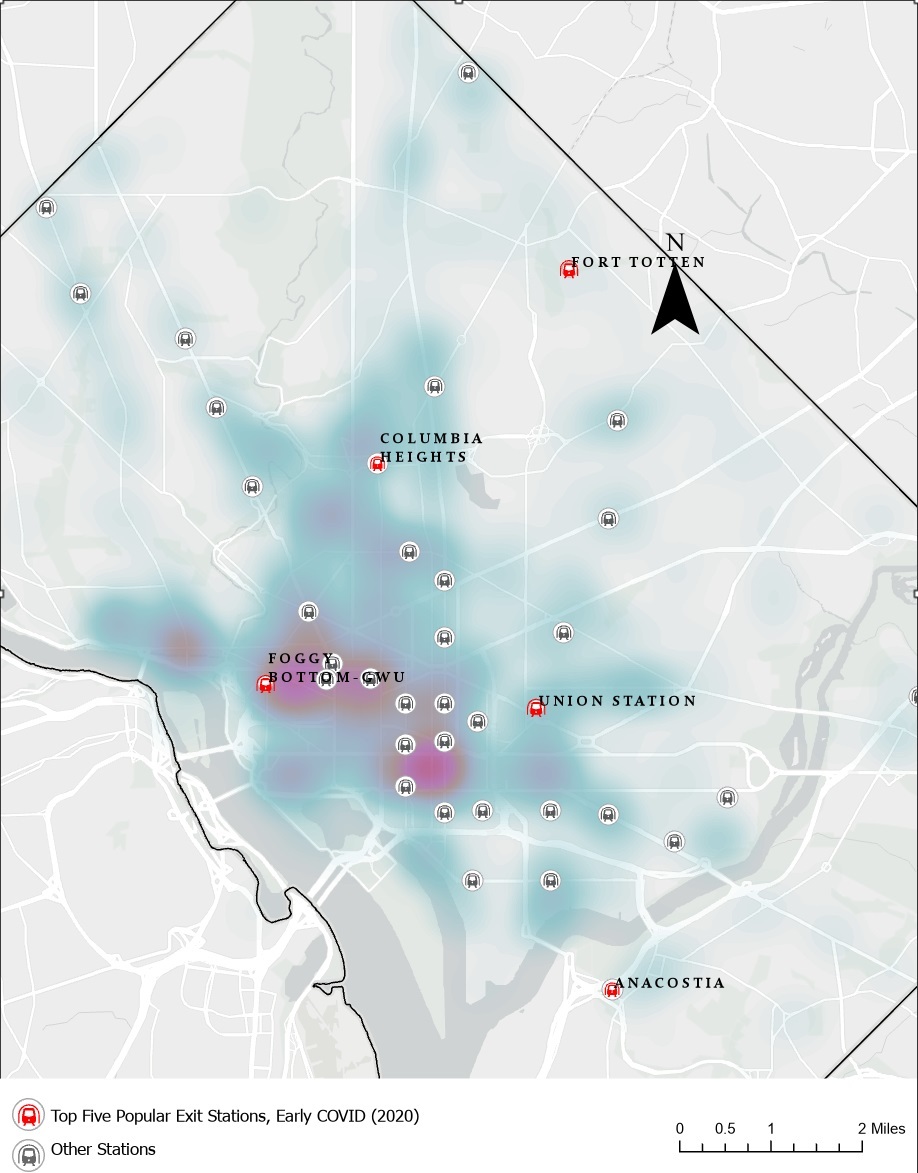
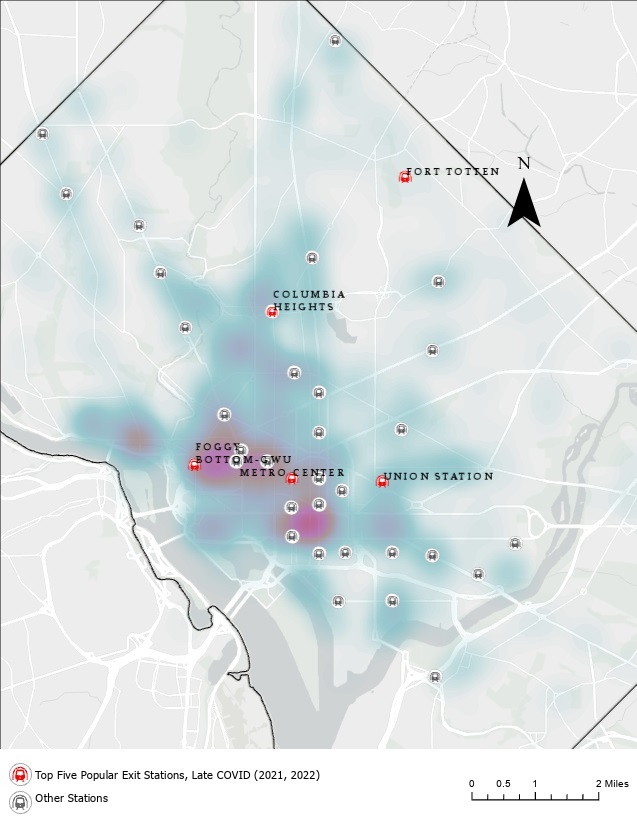
The underlying heat map in Figure 3 illustrates the spatial distribution of social activity hubs, including restaurants, cafes, shops, places of worship, and community services. These popular exit stations are clustered around the central area, aligning with the overall social activity hotspots across the city. An intriguing outlier is Fort Totten, located at a far distance from the central area and activity hubs. While this station serves as a junction for three metro lines (Green, Red, and Yellow), the unusually high volume of trip exits warrants further investigation, especially given that Fort Totten saw the highest number of trip exits during early and late COVID periods. The pattern of popularity of trip exit stations during early and late COVID periods are similar, implying that pandemic induced patterns persisted (Table 1).
Building on existing studies, our findings reveal three key insights into pandemic induced travel shifts among older adults. First, their weekday travel experienced a greater COVID impact compared to weekend trips. Second, their travel exhibited slower recovery from the pandemic compared to all users. Lastly, pandemic-induced changes in travel destinations remain present for older adults. These findings highlight the unique and persistent challenges faced by older travelers, requiring more targeted solutions from transit agencies to ensure equitable access to mobility.