
1. Questions
Speeding while driving increases the risk of collisions and the probability of serious injury and death when collisions occur (Aarts and van Schagen 2006; Vadeby and Forsman 2018). In order to deter speeding, New York City maintains the largest system of automated speed cameras in the United States (which have been associated with decreases in speeding elsewhere; Pilkington and Kinra 2005; Wilson et al. 2010), with roughly 2,500 cameras in operation as of 2022 (see Figure 1). However, penalties for camera-based speeding violations are lower than those manually written by police: drivers face fines of $50, which do not vary with how far above a speed limit an automobile travels, nor ramp as the number of violations increase. In addition, camera-based violations have no bearing on driver’s license suspensions, as do police-written ones (see Table 1). The introduction and expansion of automated speed cameras in New York City, along with a more-lenient penalty design relative to police-written violations generates the opportunity to evaluate extreme speeding recidivism.
._photo_by_the_author._**b_**_.jpg)
2. Methods
This study’s primary dataset is titled “Open Parking and Camera Violations,” which is available on New York City’s open-data portal. Of specific interest here are all records for camera-based speeding violations, meaning the automobile in question was recorded as traveling more than ten miles over the posted speed limit, between fiscal years 2014 to 2023. Subsequent analyses of this dataset use the ‘license plate’ and ‘state’ fields as unique identifiers, which enable isolating violations by specific automobiles within and across fiscal years. Each violation in the database also lists the cross streets of the camera which captured it, making spatial analysis possible after georeferencing camera locations. Violations also list an ‘issue date’ and ‘violation time,’ which allows for calculation of camera-based speed violations across dates and hours of the day. Speed cameras are primarily located on neighborhood streets (they must be installed within a ¼ of a mile from a school building), though some are placed on arterial or collector streets with multiple lanes of traffic. Unless otherwise marked, the speed limit for streets in New York City is 25 miles per hour, though some streets have speed limits as low as 15 MPH, whereas freeways and expressways are largely set at 50 MPH.
Automobiles that accrued 100 or more speeding violations within single fiscal years are defined as ‘super speeders.’ For those, additional non-speeding traffic violations were tabulated, as well as the balance of unpaid fines. Using the location of each speeding violation, the number of New York City boroughs in which a violation occurred was recorded for each super speeder, as well as the number of distinct speed-camera locations.
3. Findings
As the number of cameras increased, as well as the number of hours per week cameras were in operation, annual speeding violations in New York City grew from roughly 90,000 in FY 2014 to nearly 7,000,000 in FY 2023 (see Table 2). The first ‘super speeder,’ or automobile that accrued 100 or more speeding violations in a single fiscal year occurred in 2020. Each year thereafter the number of super speeders increased, with 186 documented in 2023. Super speeders average an additional 35 non-speeding traffic violations, including an average of 7 red-light camera violations. These automobiles owe an average of $11,083 each in unpaid fines. The maximum number of speeding violations for a single automobile grew steadily across this entire decade, from 12 violations for a single automobile in 2014, to 373 violations in 2023. Of the 220 distinct super speeders documented between fiscal years 2020 and 2023, 90% were vehicles with standard passenger license plates, with the remaining 10% comprised of rental cars (10), commercial vehicles (5), taxis (5), one motorcycle, and one bus. Analyzing the spatial data associated with each automobile finds that super speeders accrued speeding violations in an average of three New York City boroughs (of five total), and at an average of 58 distinct camera locations (SD = 22.5).
The onset of the COVID-19 pandemic in 2020 coincides with increases in camera-based speeding violations both generally and in terms of extreme recidivism; violations per camera-hour increased from 0.28 in FY 2019 to 0.68 in FY 2020, with the highest number of violations by a single vehicle jumping from 39 to 132. This tracks with other indications that the pandemic lead to increases in dangerous driving (Stiles et al. 2023).
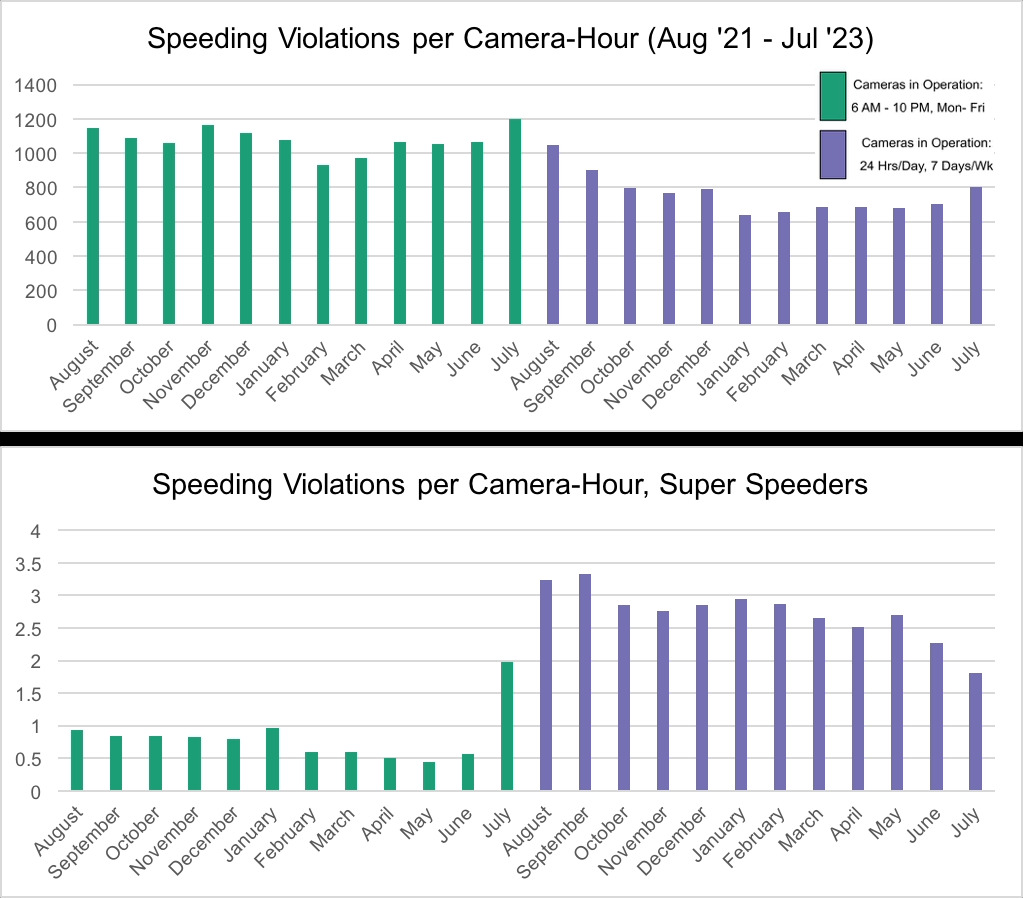
On August 1, 2022 New York City expanded the hours of operation for its speed cameras to 24 hours a day, seven days a week (compared to 6 AM to 10 PM on weekdays only). The speeding threshold for when violations are issued (more than 10 MPH above the posted limit) has remained the same throughout the program’s existence. In the 12 months leading up to August, 2022, there were an average of 1,077 speeding violations per camera-hour in New York City. In the 12 months following the enactment of expanded hours of operations, there were an average of 729 violations per camera hour (a 33% decrease), likely a combination of deterrence and less driving in late-night and early-morning hours. However, among automobiles accruing 100 or more violations per fiscal year, there was no analogous decrease in camera-based speeding violations. Indeed, super speeders averaged 0.82 violations per camera-hour in the 12 months prior to August, 2022, and 2.75 daily violations in the 12 months afterward (a 234% increase; see Figure 2). Critically, analyzing camera-based violations by time of day indicates that whereas among all vehicles, approximately 23% occurred between 10 PM and 6 AM (the newly-included hours beginning in August 2022), this time window accounted for 38% of violations among super speeders.
_and_after_(purple)_hours_of_operation_were_expanded.jpg)
The emergence and growth of super speeders indicates that New York City’s existing camera-based speed enforcement, including its penalty structure and enforcement, should be re-evaluated and potentially modified to better curb extreme recidivists. Though these vehicles represent a small percent of violations overall (less than 1% as of 2023), this level of recidivism calls into question allowing such automobiles to remain on the road, particularly when such vehicles are involved in fatal crashes (Aoraha 2023; Kois 2023). In terms of public-policy changes, municipalities which have installed speed cameras could treat such violations equivalently to police-written ones, by equalizing fine levels and suspending licenses following a set number of violations incurred. Second, they could also transition from a flat-fine approach for camera-based speeding violations toward ramped fines, in which fine amounts increase with each subsequent violation (e.g. $50, $100, $200, etc.). Third, cities could prevent automobiles from remaining on the road if they have accrued sizable unpaid speeding fines, especially in instances where fines are the only penalty. Drivers who realize there are no consequences for unpaid fines are unlikely to curb their speeding.
As to future research, experimenting with different penalty designs (including fine amounts as well as license-suspension thresholds) can determine if and to what extent super speeders are inelastic to camera-based speeding violations. Indeed, the decline in overall violations following the expansion of speed camera hours in 2022, but increase among super speeders, merits further study. Information regarding the drivers of these vehicles (such as income, employment category, or neighborhood) might also shed light on such dangerous driving.