
RESEARCH QUESTION AND HYPOTHESIS
This study is devoted to identifying twin trips in a city, i.e., pairs of travelers who make almost the same trips. Such travelers demonstrate the potential demand for shared mobility systems, especially possible trip-sharing services such as ridesourcing, shared taxis, ridesharing, etc. A major hypothesis of this study is to limit consideration to spatiotemporal features of the trips to assess their similarities and their potential for matching (Rayle et al. 2015). Other attributes such as cost, comfort, additional behavioral variables, or the characteristics of the transportation service are not yet accounted for (Zhan, Qian, and Ukkusuri 2016; Vazifeh et al. 2018).
METHODS AND DATA
The Chinese transport network company DiDi Chuxing has released two months’ worth of data consisting of more than 6 million trips performed by their drivers (Xu et al. 2019). For each trip this dataset gives access to the following information: departure time and location of the passenger(s) pick-up; arrival time and location of the drop-off. For this study, we only used a subset of the dataset by focusing on the peak hours of a regular day: approximately 10,000 trips from to on November 18, 2016. Moreover, we consider that these observations correspond to the desired departure/arrival times and origins/destinations of the travelers.
To identify the trips that can be made with the same vehicle, we use the following method. First, we define a function to express the similarity between two trips and This function must encompass the different spatiotemporal attributes of the trips. It should reproduce the trip information that two travelers can share if their origins and locations and also their departure and arrival times are close enough. To the authors’ best knowledge, this kind of similarity index is almost nonexistent in the literature (Ketabi, Alipour, and Helmy 2018). Consequently, we propose the following function: ¯S(i,j)=∑l∈[PU,DO]αle|fl(i,j)| where is a feasibility function and is a coefficient.
Function describes the service’s potential to operate the shared trips, i.e., the ability to pick up (or drop off) the two travelers before both of their desired departure times: fl(i,j)=|tli−tlj|−γd(pli,plj) where is the geodesic distance and is the average duration pace to connect travelers who wish to share a trip. This parameter is a general and synthetic formula to describe the operation of the service and the way in which this service gathers two demand requests into the same vehicle: defining a meeting point, successive pick-ups, etc. For example, if the first traveler must walk to the second traveler’s pick-up point, then is the inverse of the walking speed. If this distance is traveled by car, meaning that the service offers door-to-door service, then is the inverse of the vehicle speed. Consequently, is positive if the match is realized before the two desired departure times and whereas is negative if travelers must experience delays to make the match possible. Moreover, is equal to if and to otherwise because it is more disadvantageous to be delayed.
In addition to this measure of similarity excessive distances/durations for rendezvous are penalized. Thus, penalties and are added when, respectively, the distances between pick-up (or drop-off) locations and departure (or arrival) times of trips and exceed, respectively, specific thresholds and : θlx=ed(pli,plj)−δlx∀l / d(pli,plj)>δlxθlt=e|tli−tlj|.δlxδlt−δlt∀l / |tli,tlj|>δlt
Otherwise, these penalties are null. In this manner, defines a sharp function that enhances the differences between trips and facilitates identification of twin travelers in the dataset.
Next, trips are gathered using a clustering method. It is important to note that a cluster is not a region of the city but a set of trips that are similar based on their pick-up and drop-off attributes. These trips are related to travelers, i.e., demand, who may share a vehicle according to their origin/destination and departure/arrival time. For this study, a DB-SCAN approach with as the distance function is used. This makes it possible to fix the minimum number of points requested by cluster (Ester et al. 1996). Here, this minimal number is fixed at two, and we only select clusters with two elements because the study aims to determine pairs of similar trips. DB-SCAN also requires a threshold on the similarity function that is the radius of a neighborhood with respect to some point, i.e., the maximal dissimilarity authorized to determine if two trips can be paired. The parameters used to obtain the different figures in this article are summarized in Table 1.
FINDINGS
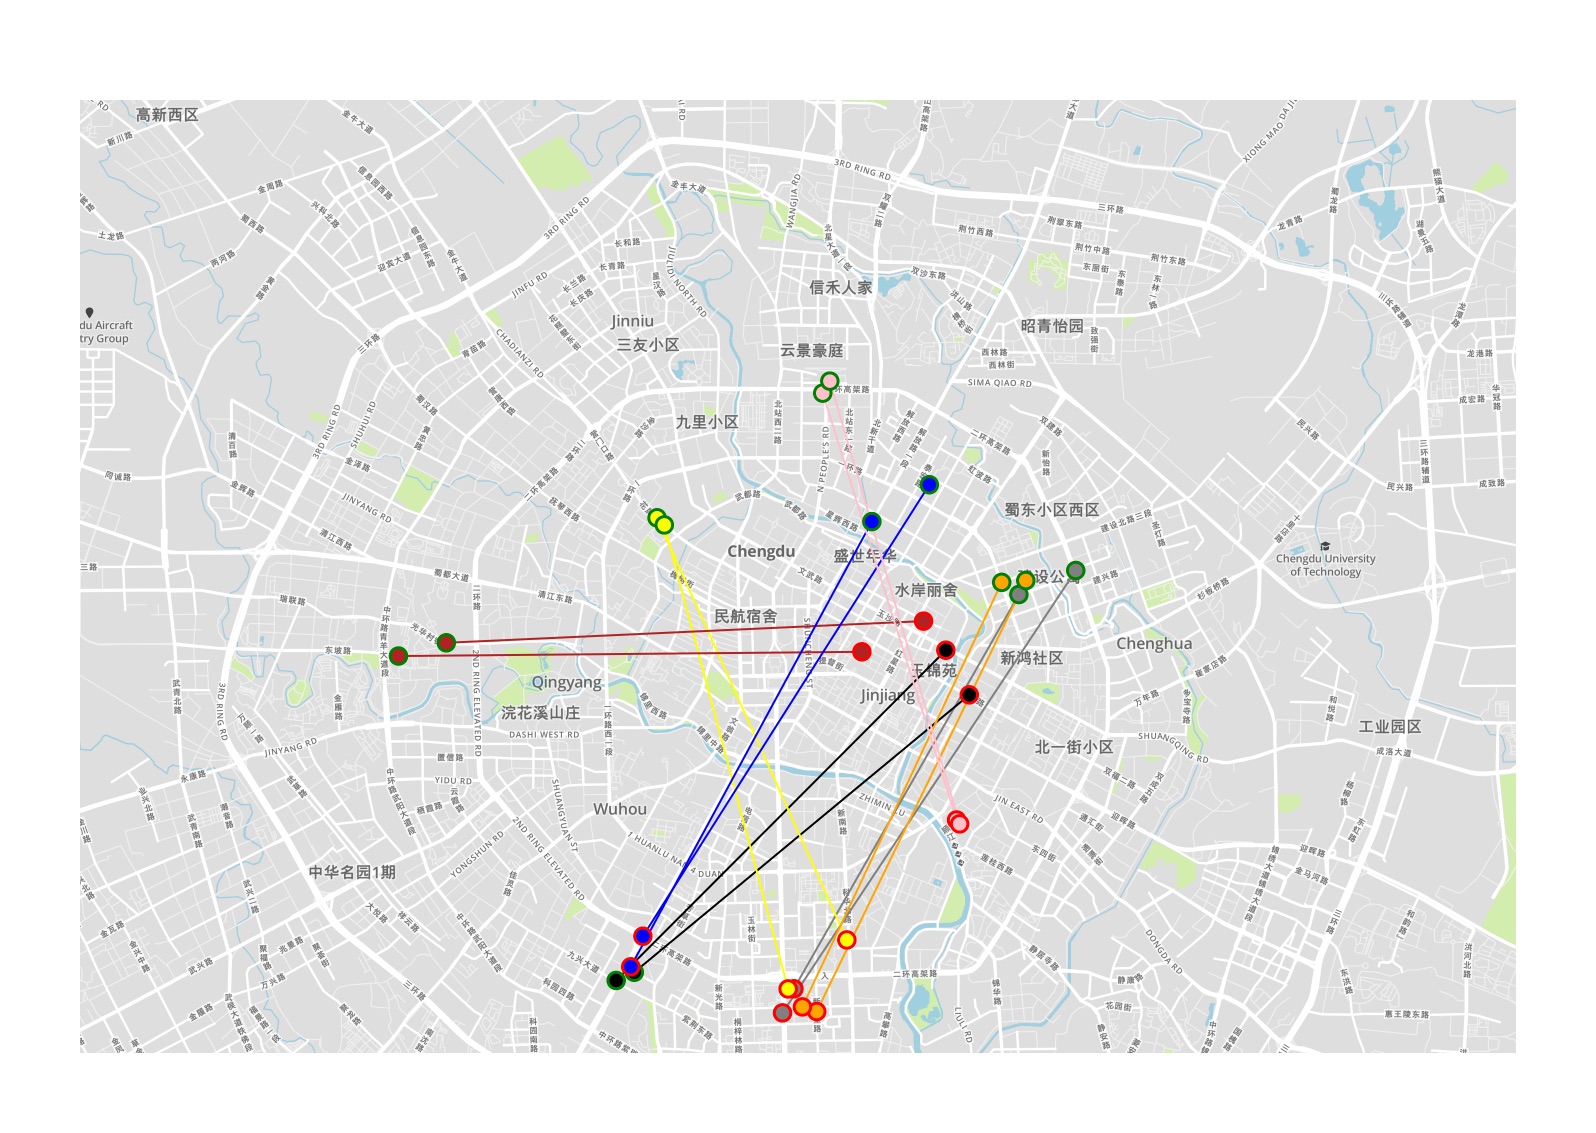
Figure 1 shows the trips of 7 different pairs of twin travelers projected on the roadmap of Chengdu, China. Visual inspection reveals that these results are very promising. Pick-up and drop-off locations are close (less than km, geodesic distance) while the differences in departure and arrival times remain low (less than min). Moreover, of the trips can be paired for the studied period. This is very interesting because the fleet size of DiDi, and, by extrapolation, the number of cars flowing in the network can be significantly reduced if vehicles are shared. This reduction can even be higher if more than two travelers share the same vehicle. The methodology can be extended to such cases by changing the minimal number of points in the clustering process. Even if the DiDi data is not fully representative of the complete traffic flow, these results highlight the fact that shared mobility may be a promising strategy to improve the transportation system’s performance.

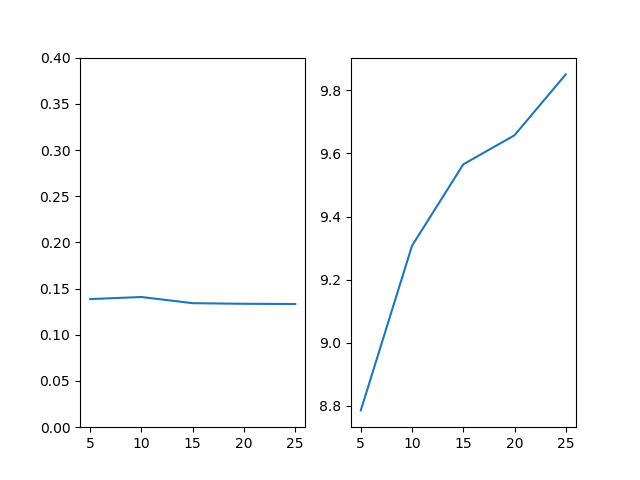
Visual observations are confirmed by Figure 2.a, which depicts the distribution of the average length of the trips for each pair whereas Figure 2.b shows the distributions of the average travel times In addition, Figures 2.c and 2.d present the distributions of the absolute difference in departure times and the absolute difference in the two arrival times It appears that all these values are entirely consistent with the natural idea of what the characteristics of similar trips should be:
-
The average length of the twin trips is equal to km/h (road distance). Notice that the dataset focuses on a subpart of Chengdu’s network (a circle with a km radius). The associated average travel time is around min, leading to an average speed of km/h. Consequently, trips are long enough to allow for the delay caused by sharing the vehicle with another traveler.
-
Consequently, the difference in the two departure times is on average equal to min and lower than min for of the trips.
-
The average estimated delay is equal to min and more than of the trips experience a delay of less than min.
-
Finally, it means that a traveler may find their twin to share a vehicle with an increase of only in travel time. This extra time could be drastically reduced by optimizing dispatch of the transportation supply (Mourad, Puchinger, and Chu 2019).
_distribution_of_the_average_length___bar_l__k__of_trips_within_the_cluster__k___(b)_di.jpg)
ACKNOWLEDGMENTS
The authors thank Dr. “MFD” Guilhem Mariotte for his valuable comments. Data source: DiDi Chuxing GAIA Open Dataset Initiative, available at: https://gaia.didichuxing.com