


1. Questions
Level of Traffic Stress (LTS) is widely used in bicycling research and planning to predict behaviour (Lowry, Furth, and Hadden-Loh 2016; Semler et al. 2017; Faghih Imani, Miller, and Saxe 2019; Murphy and Owen 2019; Chan, Lin, and Saxe 2022). LTS quantifies the relative stress of bicycling by assigning a stress rating to each road and path in a network based on factors such as roadway design, traffic volumes, and presence and quality of bicycle infrastructure. The amount of low-stress infrastructure in a region has been correlated with higher overall bicycling mode shares (Faghih Imani, Miller, and Saxe 2019), providing insight on where people could be expected to bicycle. However, few studies have examined the relationship between expected and actual bicycling outcomes and LTS at the network level, likely due to spatially incomplete data on bicycle ridership (Lee and Sener 2020).
Big data from GPS-enabled devices are enabling novel studies of bicycling at the network level (Lee and Sener 2020). Strava, a popular app for tracking bicycling activities, is one source generating such data. Strava data have been used to evaluate several aspects of bicycling, such as ridership outcomes related to infrastructure changes (Boss et al. 2018; Fischer, Nelson, and Winters 2022b) or safety risks (Ferster et al. 2021). While network level analyses of Strava data are growing (Battiston et al. 2023), to the best of our knowledge, no studies have integrated these data with LTS.
Our goal was to explore the relationship between LTS and Strava bicycle ridership. To meet this goal we first matched Strava counts to LTS ratings for all roads and paths in Toronto, Canada. We then measured and mapped the distribution of Strava ridership across the LTS-classified network. While focused on findings in Toronto, these methods could be applied in other cities and contexts.
2. Methods
Our primary data were Strava counts and Toronto’s road and path network labelled with LTS ratings. We obtained Strava data through the Strava Metro web platform (Strava 2022) for the period of Jan 1 - Dec 31, 2022. These data consist of a spatial network and tabular files containing aggregated monthly Strava bicyclist counts for each road and path in the network. We refer to roads and paths as “segments” throughout this paper.
Toronto’s LTS-labelled network was created by Lin et al. (Lin, Chan, and Saxe 2021) following the approach of Furth et al. (Furth, Mekuria, and Nixon 2016). LTS classifications were based on road type and width, presence of on-street parking, modelled motor vehicle speeds (Travel Modelling Group 2015) and posted speed limits, and bicycling infrastructure presence and type. We made manual edits to include new cycling infrastructure installed between 2021 and 2022. Table 1 describes the LTS rating scheme.
We calculated intersection LTS according to the LTS of the intersecting roads, and the presence of stop signs or traffic signals. An intersection without either was assigned the highest LTS of its intersecting roads. Stop signs reduced an otherwise LTS 2 intersection to LTS 1.
The LTS-labelled network uses road and path centrelines. Conversely, Strava uses OpenStreetMap (OSM) sourced basemaps which are more spatially detailed, including spatial lines for sidewalks, cycleways, and private roads in addition to roads and paths. To assign LTS ratings to Strava segments, we employed a spatial matching process, associating each LTS-labelled segment with parallel Strava segments within a 33-metre buffer. This buffer was chosen to capture all parallel lanes of the widest roadways in Toronto. We followed a methodology similar to Will et al. (Will 2014), with modifications to accommodate matching with less spatially detailed data. Figure S1 illustrates the two networks and the matching method outlined below:
-
Data Preparation
-
Apply Douglas-Peucker algorithm (Douglas and Peucker 1973) to simplify polylines, reducing breakpoints
-
Convert polylines into multiple smaller segments
-
Calculate segment angles
-
-
Matching
-
Create a 33 metre buffer around the LTS segment and identify all Strava segments within the buffer.
-
Identify Strava segments parallel to the LTS segment by considering only those with a difference in angle of less than
-
Identify Strava segments which are more than 50% inside the buffer
-
If a Strava segment is matched to multiple LTS segments, assign it the LTS segment closest to the Strava segment
-
Given the potential bias introduced by higher amounts of LTS 1 segments overall, for Figure 1 (C,D) the data was normalized by the LTS length in each LTS category similar to Fischer et al. (Fischer, Nelson, and Winters 2020). For each segment, Strava counts were multiplied by its length to calculate bicycle kilometres traveled (BKT). For each LTS category, the BKT values were summed and divided by the total LTS infrastructure length. The normalization is represented by
Normalized LTS X BKT =∑ni=1CiSi∑mj=1Lj
where for Strava segment is the count, is the segment length, and is the LTS segment length matched to Strava segment The numerator is the sum for the Strava segments in LTS category and the denominator is the sum for the LTS segments in LTS category The result is the normalized BKT in each LTS category for travelled segments in 2022.
After matching, 7.51% of BKT remained unmatched. Some Strava segments were located outside Toronto’s network boundary, while others, such as some gravel trails in parks, were over 33 metres from any LTS segment. Less than 1% (0.29%) of BKT had a path tag in OSM but were mislabelled as high-stress during matching to the LTS network due to their proximity to LTS 3 & LTS 4 roads; these were manually relabelled LTS 1. All calculations in this paper only consider matched segments.
Strava counts were correlated with City of Toronto bicyclist counts at intersections for the period of July to September 2022 (City of Toronto 2022). The correlation was similar to results in other Canadian cities of 0.69, Figure S2) (Fischer, Nelson, and Winters 2022a). Based on the fit, Strava counts represent approximately 14% of the overall ridership in Toronto.
3. Findings
3.1. Most Strava trips happen on a small fraction of low-stress roads and paths
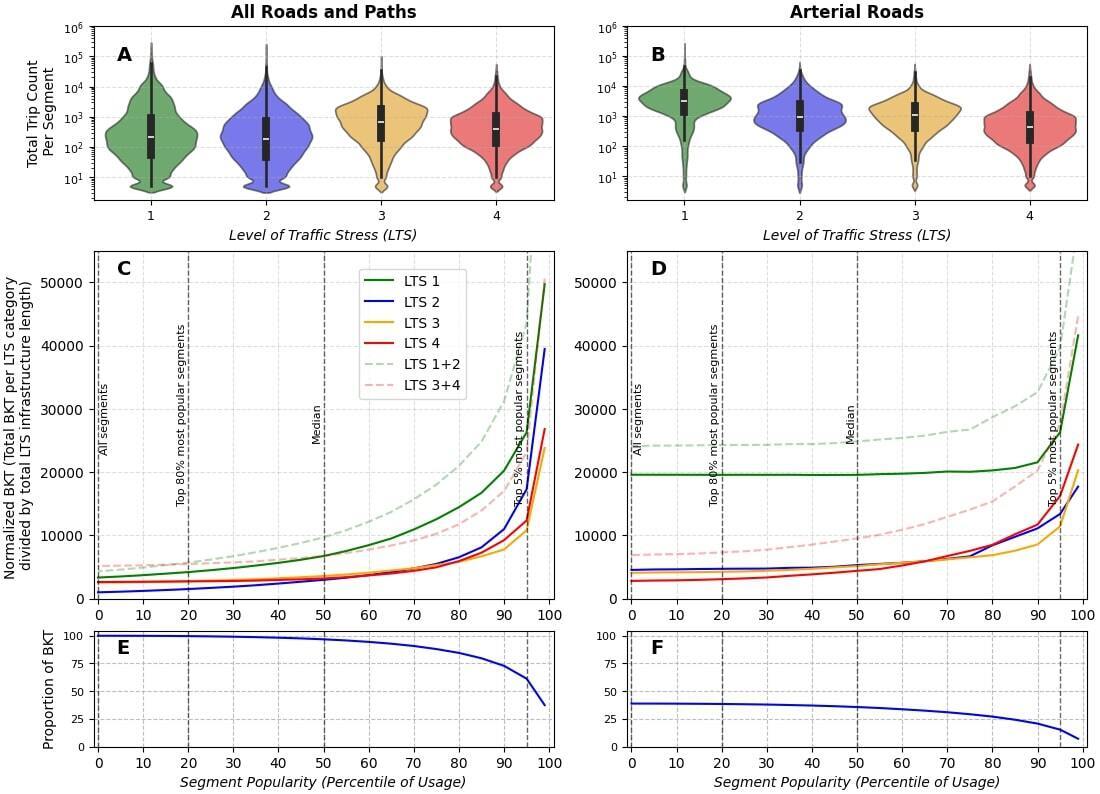
Toronto’s street network is varied with expressways, arterial, collector, local roads, and off-road paths, resulting in a wide distribution of Strava counts per segment. The most popular segment, West Road in High Park, had over 180,000 Strava counts in 2022, while the median across all segments (excluding segments with no counts) was 295. Due to this wide distribution, counts per segment in each LTS category lack a discernible pattern as a function of LTS (Figure 1A). Toronto has 3.5 times as many segments labelled low-stress (LTS 1-2) compared to high-stress (LTS 3-4, Table 2), many of which are residential streets disconnected from the cycling network, resulting in many low-count, low-stress segments overall. This pattern may shift the distribution downwards in low-stress categories. Contrastingly, segments within the same road class (i.e., with similar transportation functions) exhibit a clear trend; low-stress arterial roads, which typically have protected bicycling infrastructure, are more heavily used than high-stress arterial roads (Figure 1B).
Normalizing BKT to infrastructure length in each LTS category (equation 1) shows that LTS 1 segments have the highest ridership, followed by LTS 3, LTS 4, and LTS 2 (Figure 1C). When considering all segments, high-stress segments appear more popular than low-stress segments (Figure 1C). However, the majority of BKT is concentrated in a small fraction of roads and paths. The top 5% most popular segments accounted for over 60% of Strava BKT, where the normalized BKT for low-stress roads was 1.88 times higher than high-stress roads. For the 80% most-used segments, which represents over 99% of BKT and excludes the 20% least travelled segments, low-stress segments had higher normalized BKT than high-stress segments (Figure 1A,C).
3.2. Some high-stress routes have high bicycling demand
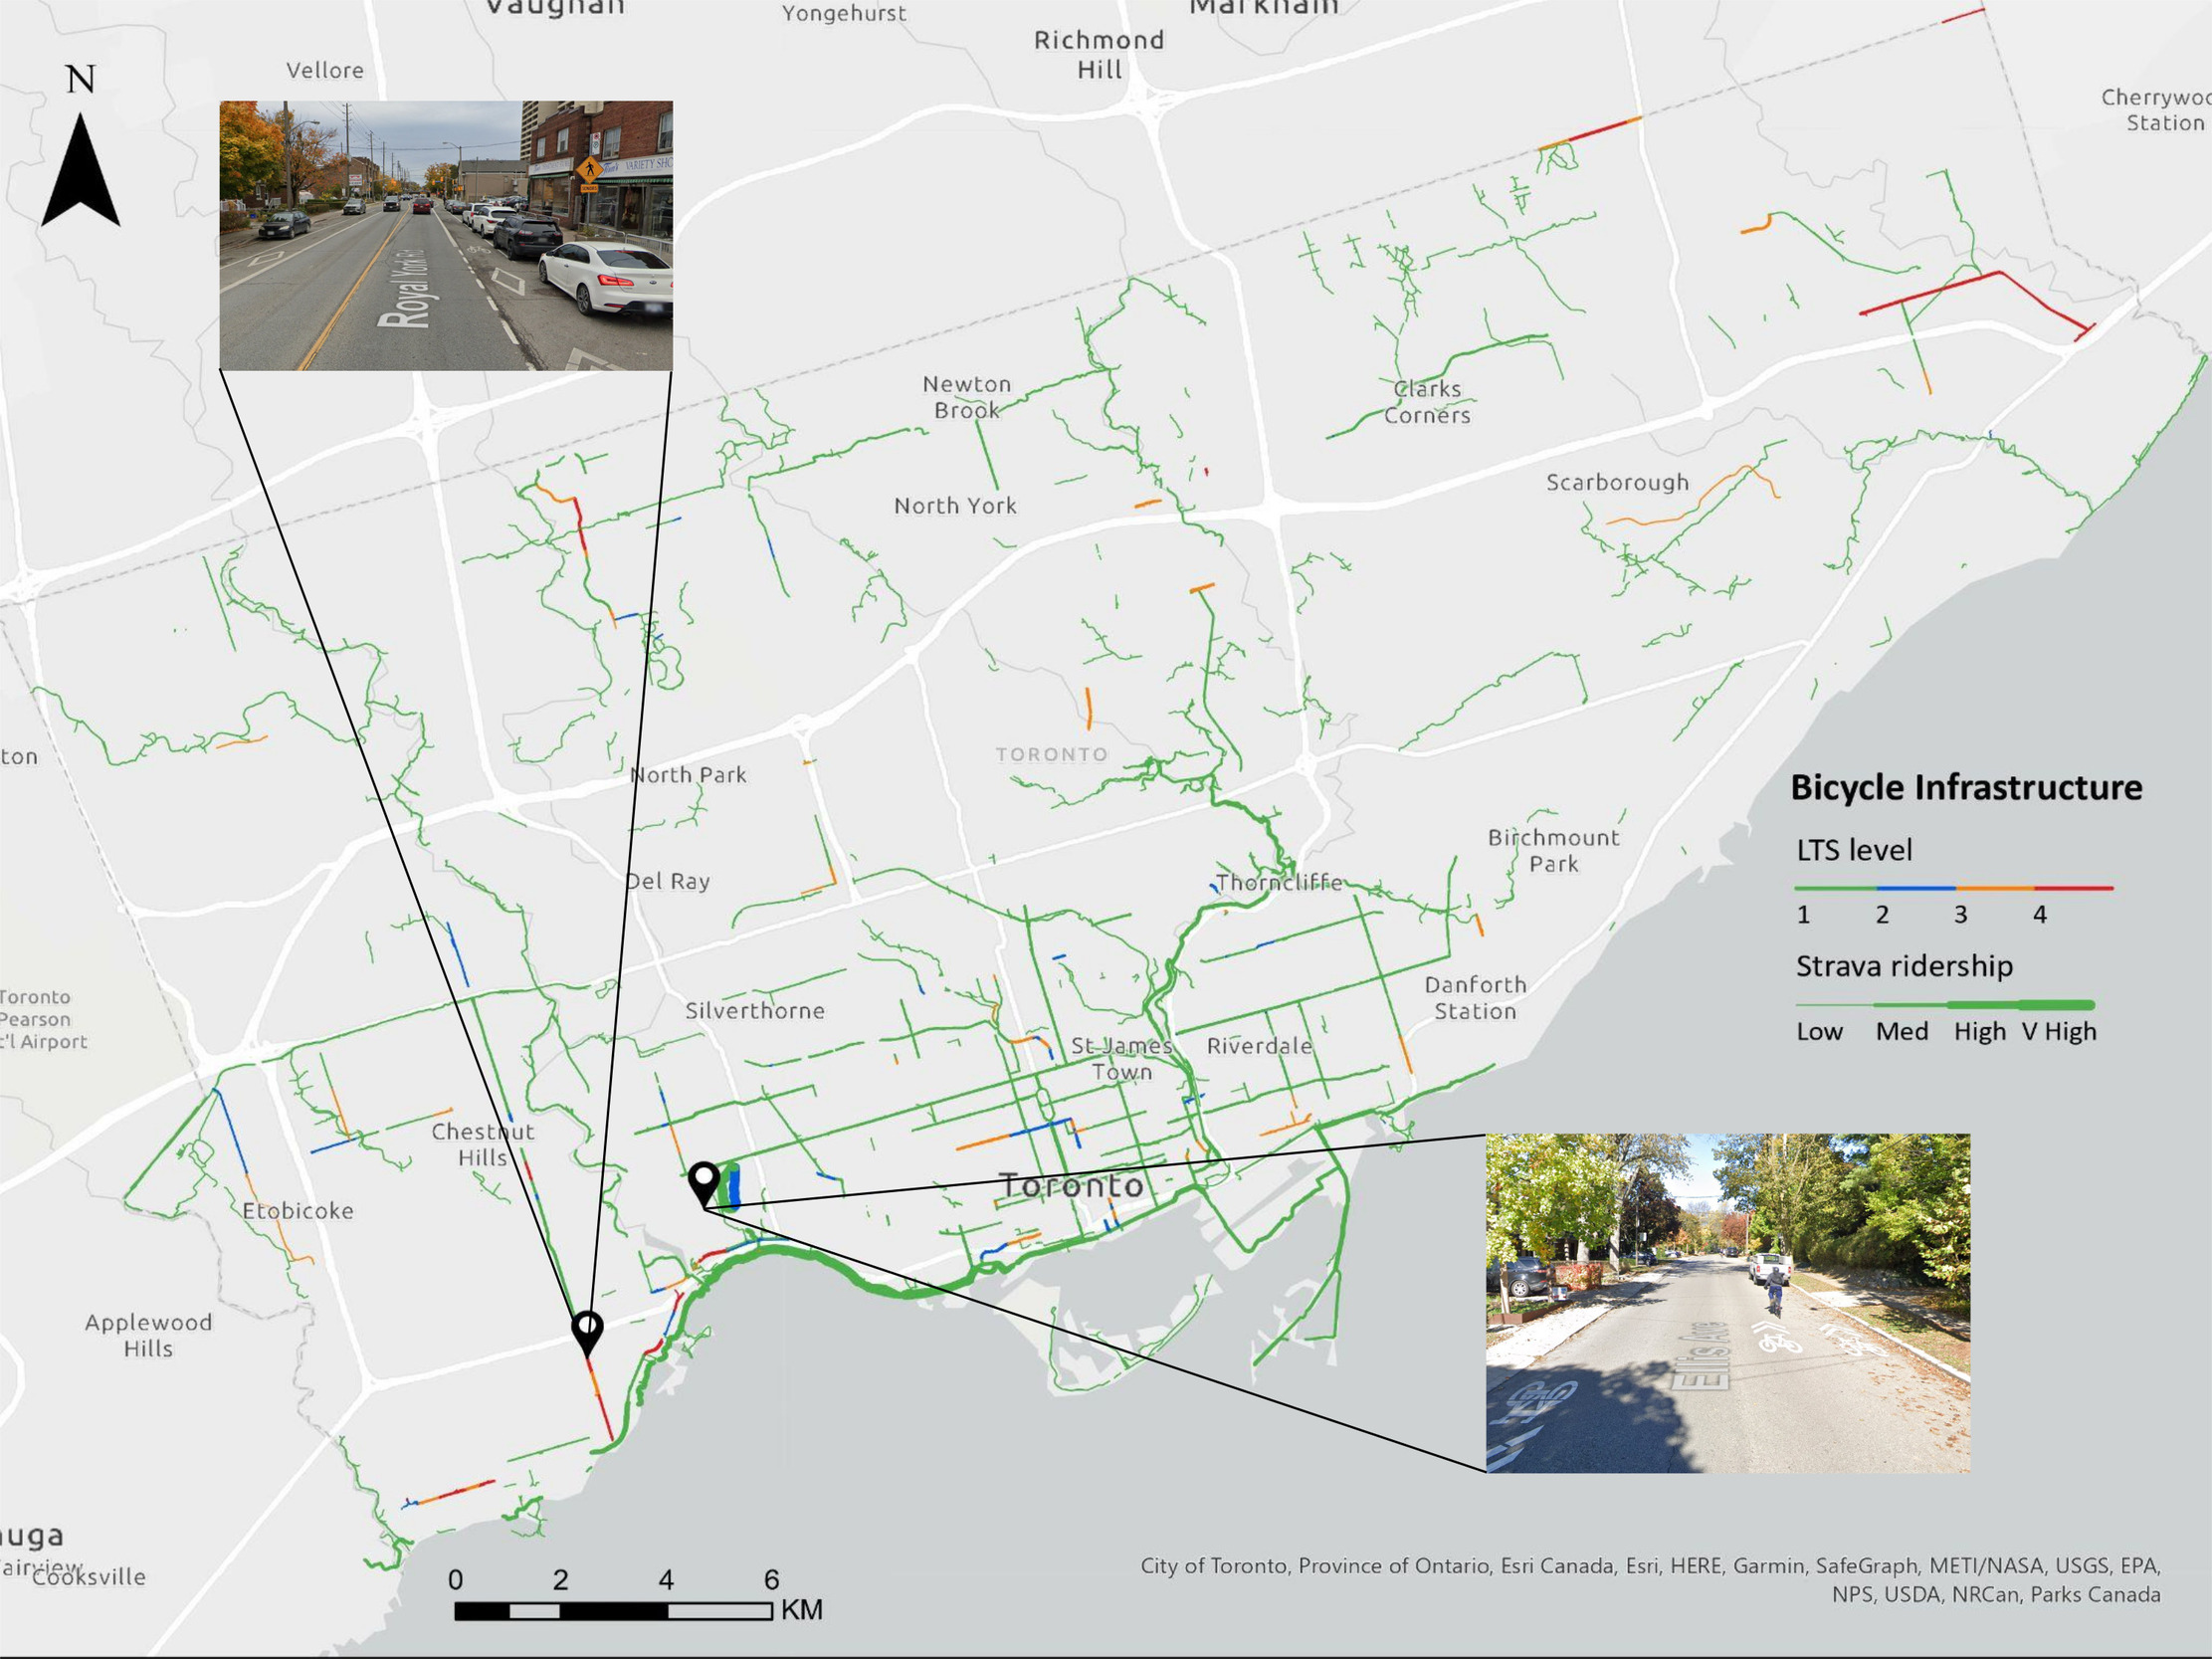
While the most popular segments are mainly low-stress, there are notably several high-stress routes even among the most-used (top 5%) segments (Figure 2). These popular LTS 3 and LTS 4 segments often cluster with other popular segments along arterial roads. In this instance, Strava data may be signalling high demand on missing links in the bicycle network despite them having high stress ratings. It is recommended to conduct further analysis using observational data (e.g., bicycle counts) to confirm if the spatial patterns observed in Strava align with overall ridership patterns.

3.3. The presence of bicycling infrastructure is not the only determinant of rate of use
Although most BKT in LTS 1 occurred on segments with bicycle infrastructure, some popular low-stress segments, particularly quiet residential streets such as Ellis Drive (Figure 3), do not have designated bicycle infrastructure. Indeed, 20% of BKT in LTS 1 and 84% in LTS 2 were on roads with no bicycling infrastructure (Table 2), indicating the importance of low-stress local streets in connecting a low-stress bike network and the importance of maintaining low stress on these roads - at risk as automobiles become larger and heavier. Some high-stress segments, such as Royal York Road (Figure 3), have bicycling infrastructure (most often painted lanes) but remain high-stress because the number of lanes, speed and/or volume of vehicles is large. These segments indicate a need for safe bicycling infrastructure that is matched to traffic conditions.
Our analysis shows that most Strava trips occur on a small fraction of low-stress roads and paths; some of these are quiet routes without bicycle infrastructure, indicating their importance in forming a low-stress bike network. Additionally, some high-stress segments also experience high BKT, suggesting potential missing links in Toronto’s network. A caveat is that Strava data are biased toward app users who may have different route preferences and risk tolerances than the overall population. Some studies have used subsets of the data (e.g., only Strava trips representing commuting, trips generated by women) to obtain a more representative sample (Fischer, Nelson, and Winters 2022b, 2022a). We use the full sample of Strava in this exploratory study, though future work might evaluate the relationship between LTS and subsets of Strava ridership. In general, we suggest that triangulating LTS with observed data such as bicycle counts and safety data could offer an effective means to plan future bicycling infrastructure to meet current demands.
Acknowledgements
This report includes aggregated and de-identified data from Strava Metro. This project is supported by the Data Sciences Institute at the University of Toronto, funding from the City of Toronto and a National Sciences and Engineering Research Council of Canada Alliance Grant (ALLRP 56121 - 20).