Loading [Contrib]/a11y/accessibility-menu.js
Skip to main content
null
Findings
  • Menu
  • Articles
    • Energy Findings
    • Resilience Findings
    • Safety Findings
    • Transport Findings
    • Urban Findings
    • All
  • For Authors
  • Editorial Board
  • About
  • Blog
  • covid-19
  • search

RSS Feed

Enter the URL below into your favorite RSS reader.

http://localhost:3455/feed
Transport Findings
January 17, 2024 AEST

Temporary versus Permanent Pandemic Transit Leavers: Findings from the 2022 US National Household Travel Survey

Julene Paul,
travel behaviorpublic transitpandemic travelwork from homedisabilitymode choice
Copyright Logoccby-sa-4.0 • https://doi.org/10.32866/001c.92046
Findings
Paul, Julene. 2024. “Temporary versus Permanent Pandemic Transit Leavers: Findings from the 2022 US National Household Travel Survey.” Findings, January. https:/​/​doi.org/​10.32866/​001c.92046.
Save article as...▾
Download all (3)
  • Figure 1. Predictive margins for nature of transit decline (based on disability status)
    Download
  • Figure 2. Predictive margins for nature of transit decline (based on frequency of working from home)
    Download
  • Figure 3. Predictive margins for nature of transit decline (based on household automobile access)
    Download

Sorry, something went wrong. Please try again.

If this problem reoccurs, please contact Scholastica Support

Error message:

undefined

View more stats

Abstract

Using data from the 2022 National Household Travel Survey, I explore the socio-demographic characteristics of Americans who reduced their use of public transit during the latter stages of the COVID-19 pandemic. I also examine differences between travelers whose reduced transit use was temporary versus permanent. Using adjusted Wald tests and multinomial logistic regression, I find significant differences between people who did not leave transit and those who did, as well as between temporary and permanent transit leavers. Notably, owning a vehicle, having a disability, and working from home were associated with leaving public transit permanently rather than temporarily.

1. QUESTIONS

In the aftermath of the COVID-19 pandemic in the US, public transit ridership has remained far below its pre-2020 levels. Research suggests that US travelers who left public transit in the early stages of the COVID-19 pandemic tended to have higher incomes and levels of education and were more likely to be non-Hispanic white (Parker et al. 2021; Paul and Taylor 2022). Whether and how any such differences persist can inform planning for emerging travel preferences. I thus address the following questions:

  1. Do US residents who decreased their use of public transit during the COVID-19 pandemic differ from other travelers?

  2. Do US residents who reported leaving public transit temporarily differ from those who reduced their use of transit permanently?

2. METHODS

I examined data from the 2022 National Household Travel Survey (NHTS), administered by the Federal Highway Administration (2023a). I analyzed the Person File, which includes data on traveler demographics, mode choice, and automobile access. I used a binary variable to distinguish between respondents who stated that they took public transit less in 2022 than before the pandemic and all others. I call the first group “transit leavers”[1] and the second group “all others.” Among people who reported that their transit use fell, I also coded travelers based on whether they stated that the reduction was temporary, permanent, or did not know. I used Stata 18.0 to compute all summary statistics, relying on frequency weights provided by the NHTS. Via Stata, I completed all modeling and other measures below, including goodness-of-fit and predictive margins.

I would prefer to compare people who left public transit due to COVID-19 with those who remained riding. However, the 2022 NHTS does not allow this. To the question about how their transit use had changed compared to before the pandemic, respondents could answer “the same” or “not applicable” (Federal Highway Administration 2023b). However, it is unclear how people who seldom (if ever) rode public transit – both before and since the pandemic – responded. FHWA staff stated respondents interpreted this question as they saw fit (Fisher 2023). Per summary statistics, however, it appears some former non-transit users responded “the same” and others “not applicable.” The reader should thus exercise caution in interpreting differences between transit leavers and non-leavers.

3. FINDINGS

Table 1 displays summary statistics for travelers based on whether they reported their use of transit use fell or did not (columns 2 and 3) and whether their characteristics differed at statistically significant levels based on adjusted Wald tests (column 4). It also shows statistics for people who reported that their reduced use of transit was temporary, permanent, or did not know (columns 5, 6, and 7, respectively). The final column shows the statistical significance of differences between temporary and permanent transit leavers.

Table 1.Summary statistics and adjusted Wald tests
All respondents Among transit leavers
Transit use fell All others Sig. Decline is temporary Decline is permanent Doesn't know Sig.^
Female 51% 51% 52% 53% 48%
Race/Ethnicity
Non-Hispanic White 53% 60% *** 52% 57% 50%
Hispanic 18% 19% 21% 17% 16%
Non-Hispanic Black 14% 11% ** 14% 14% 14%
Non-Hispanic Asian 8% 5% *** 11% 5% 8% ***
Has disability that affects travel 11% 5% *** 7% 14% 13% ***
High school education or greater 83% 73% *** 82% 88% 81%
College education or greater 43% 24% *** 44% 45% 38%
Employed 47% 53% ** 47% 46% 48%
Lives in Metropolitan Statistical Area (MSA) > 3 million 43% 30% *** 44% 45% 42%
Income below poverty line 10% 9% 13% 7% 9% *
Has limited English proficiency 2% 2% 2% 2% 3%
Attends school 14% 25% *** 14% 12% 14%
Owns home 67% 72% *** 65% 71% 64%
Child lives in household 35% 45% *** 34% 31% 41%
Age (mean) 47.3 40.4 *** 46.3 50.0 45.7 *
Household size (mean) 2.8 3.3 *** 2.8 2.7 2.9
Travel
Drives 79% 75% * 76% 82% 80% *
Lives in zero-vehicle household 11% 4% *** 16% 8% 9% ***
Takes transit to work 4% 1% *** 4% 5% 3%
Works from home at least weekly 31% 17% *** 31% 34% 26%
Took zero trips on survey day 25% 26% 23% 30% 24% *
Trips taken on survey day (mean) 2.3 2.0 ** 2.3 2.2 2.2
Household vehicles (mean) 1.7 2.2 *** 1.6 1.8 1.9 **
Ratio of vehicles to drivers (mean) 0.9 1.1 *** 0.8 0.9 1.1 *
In last 30 days…
Walked or bicycled 60% 32% *** 66% 57% 58% ***
Took transit 28% 7% *** 36% 21% 25% ***
Took rideshare/taxi 32% 13% *** 36% 27% 32% **
Received any deliveries 66% 52% *** 68% 68% 64%
Days used transit (mean) 2.0 0.7 *** 2.5 1.7 1.6 *
Home deliveries (mean) 5.9 4.3 *** 5.8 6.5 5.4
Due to COVID…
Takes fewer trips 13% 5% *** 16% 12% 11% *
Changes in online purchases 59% 29% *** 61% 65% 52%
Changes in travel to school 11% 5% 7% 6% 9%
Changes in travel to work 33% 15% *** 32% 34% 33%
N 3,189 13,808 1,022 1,045 917

Note. *, **, *** indicates statistical significance at the 95%, 99%, and 99.9% levels, respectively. Bold indicates significance of at least p<.05.
^Adjusted Wald test compares characteristics of people who reported reduced transit use was temporary versus permanent.

In 2022, US public transit leavers differed from non-leavers in several ways, including by race/ethnicity, education level, disability status, and age. This is likely because US pre-pandemic transit users differed significantly from non-users. For example, compared to non-users, US transit riders had lower average incomes, education, and automobile access levels in 2017, and were less likely to be non-Hispanic white (Federal Highway Administration 2018). Compared to non-leavers, post-pandemic transit leavers were more likely to travel via public transit and active modes in 2022. Transit leavers also reported larger changes in other travel behaviors specifically due to COVID-19.

Meanwhile, temporary transit leavers showed fewer differences from permanent leavers. Compared to permanent leavers, temporary leavers were poorer, less likely to have a disability, more likely to be non-Hispanic Asian, and were younger. In the past 30 days, temporary leavers reported greater use of alternative modes like active travel, rideshare/taxi, and public transit. Interestingly, temporary leavers took transit more often. Meanwhile, permanent leavers reported fewer instances of reduced travel due to COVID-19.

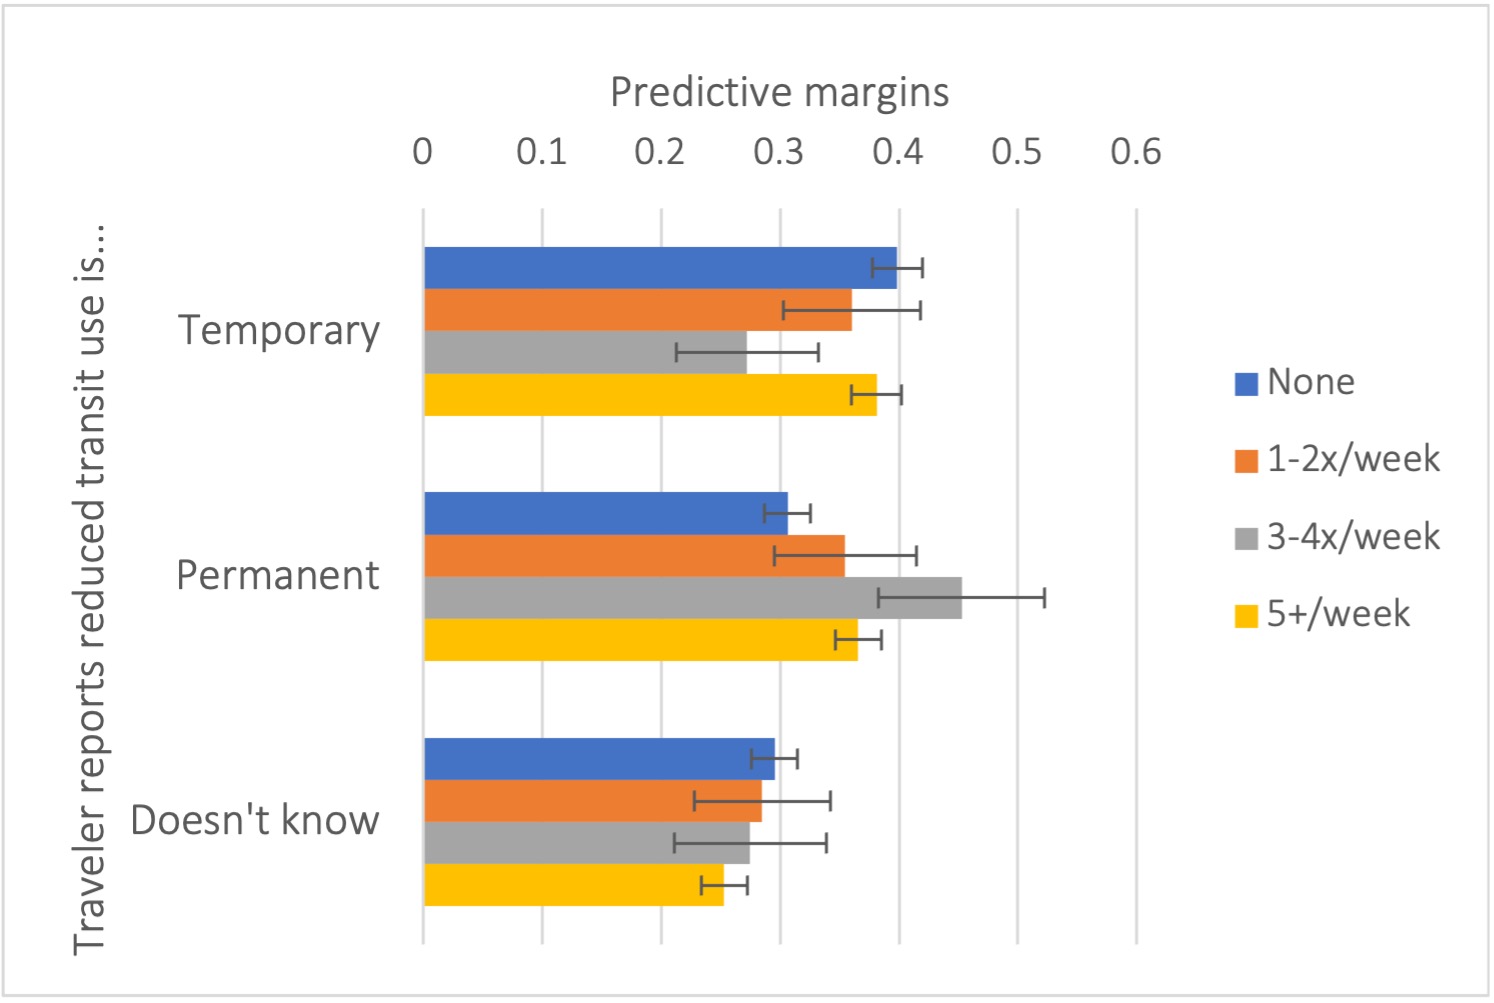
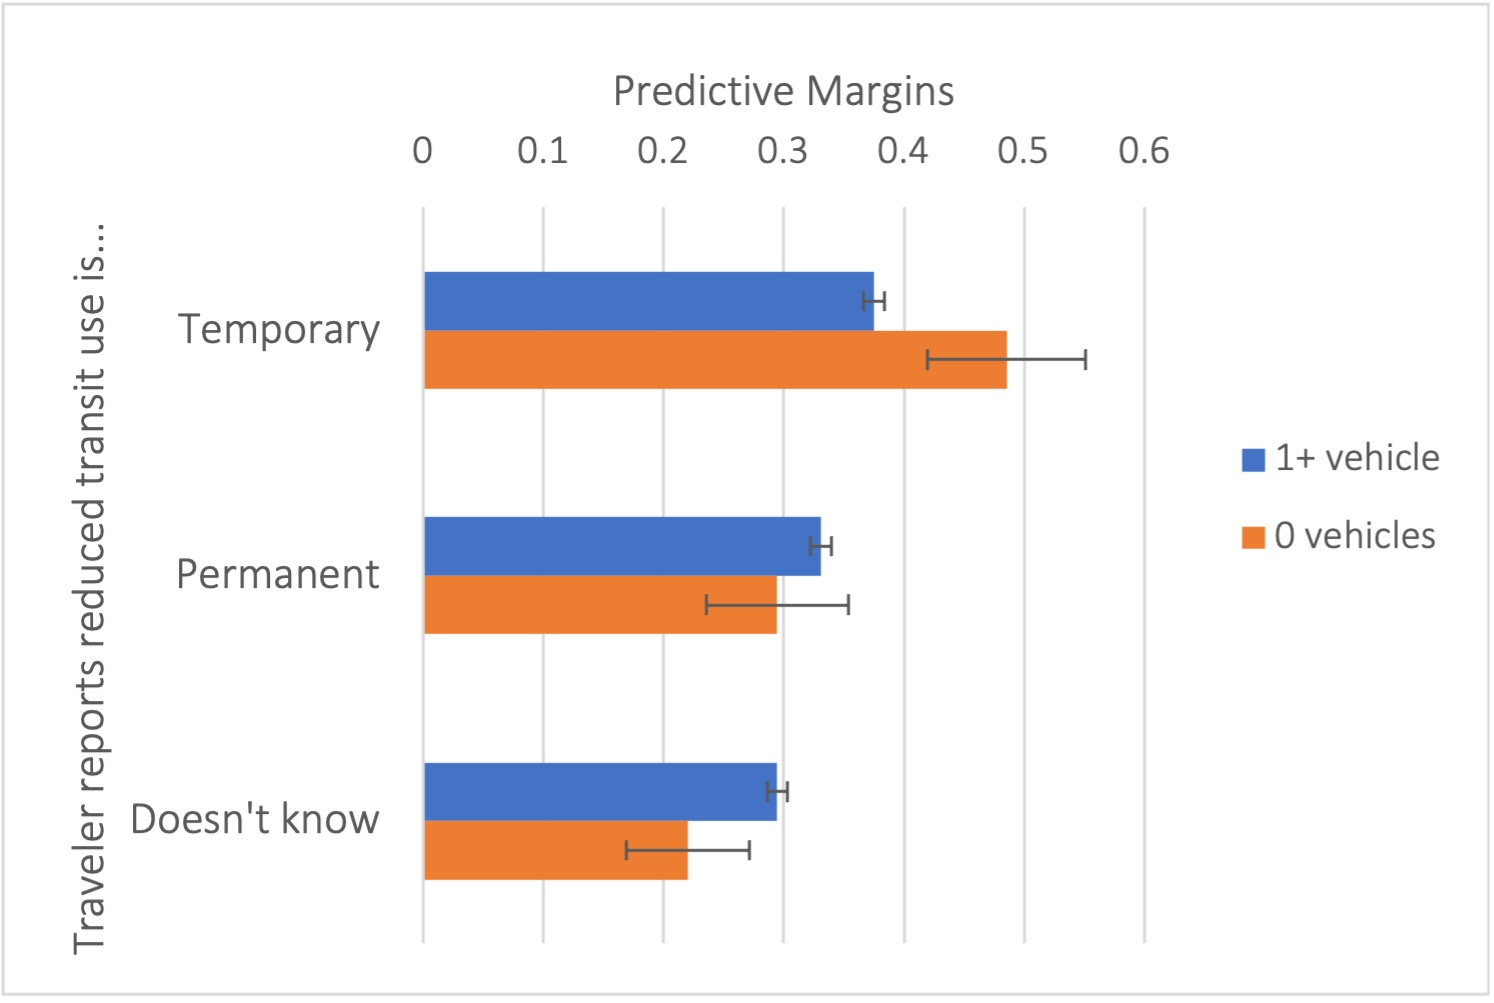
Table 2 shows the results of a multinomial logistic regression model that only includes respondents whose use of public transit declined since the COVID-19 pandemic began. In the reference category, the traveler reports a temporary decline in transit use; the two outcomes are (1) reporting a permanent decline in transit use and (2) being unsure. Most variables of interest are demographic characteristics; due to data limitations, the model does not control for transit service availability. Model results indicate differences between temporary and permanent decline in transit use in terms of disability, education, frequency of work from home, and household automobile access, all else equal. For ease of interpretation, Figures 1, 2, and 3 show predictive margins for some statistically significant variables.

Table 2.Multinomial logistic regression model of nature of transit decline (Reference: Reduced transit use is temporary)
Reduction is permanent Doesn't know
Coefficient Sig. Coefficient Sig.
Female -0.010 -0.063
Ethnicity/race (Reference: Non-Hispanic white)
Non-Hispanic Black 0.083 0.313
Hispanic -0.064 -0.028
Non-Hispanic Asian -0.492 ** -0.105
Other 0.456 0.231
Age 0.004 0.000
Has disability 1.168 *** 0.777 ***
Has limited English Proficiency 0.376 0.121
Child lives in household 0.129 0.029
Below poverty line -0.285 -0.254
Education (reference: less than high school)
High school 0.868 *** 0.731 ***
Some college 0.298 0.088
College/BA 0.423 * 0.187 **
Graduate degree 0.178 0.020
Lives in MSA 3M+ 0.115 -0.030
Lives in zero-vehicle household -0.394 ** -0.565 ***
Received at least one delivery in last 30 days 0.115 -0.122
Days worked from home (reference: None)
1-2 days per week 0.256 0.069
3-4 days per week 0.800 *** 0.326
5+days/entire week 0.230 -0.107
Constant -0.872 *** -0.115
Observations 3,184
Chi-square (degrees of freedom: 42) 175.88
Log-likelihood -3,388.03
Pseudo R² 0.0253

Note. *, **, *** indicates statistical significance at the 90%, 95%, and 99% level, respectively. Bold indicates significance of at least p<.05.

Figure 1
Figure 1.Predictive margins for nature of transit decline (based on disability status)

Note. Bars indicate 95% confidence intervals.

Figure 2
Figure 2.Predictive margins for nature of transit decline (based on frequency of working from home)

Note. Bars indicate 95% confidence intervals.

Figure 3
Figure 3.Predictive margins for nature of transit decline (based on household automobile access)

Note. Bars indicate 95% confidence intervals.

Compared to not working from home, doing so 3-4 times per week increases the likelihood that a transit leaver permanently reduced his transit use and decreases the likelihood that he temporarily did so. All else equal, people who owned automobiles were more likely to temporarily leave transit than people without them. Alternatives to public transit – both working from home and driving a private vehicle – may reduce the appeal of public transit over the long term. However, analyses of the NHTS data cannot establish causality. People who owned automobiles may have left transit permanently because they had more travel alternatives. Yet people inclined to leave transit permanently may have bought more automobiles. The issue of causality also holds with work-from-home behavior. Longitudinal data would help clarify these relationships.

Findings on the connections between disability and permanently leaving transit are intriguing. Among those who left transit during the pandemic, disability status is strongly related to doing so permanently; the reverse is true for doing so temporarily. Again, the direction of causality is not clear. Due to the pandemic, people with disabilities may have especially sought modes they viewed as safer or more convenient than public transit. However, exposure to COVID-19 may have led people to simultaneously leave transit and develop disabilities. Regardless, public agencies should consider how to effectively serve temporary transit leavers, especially travelers with limitations related to health or transportation resources. Agencies should also consider whether – and how – to encourage permanent or unsure leavers to return to their former levels of public transit use.


ACKNOWLEDGMENTS

The author is grateful to the Federal Highway Administration for collecting the NHTS data and making them publicly available.


  1. For brevity, I use the term “transit leavers.” However, many respondents reported only reducing their use of public transit, not foregoing it entirely.

Submitted: December 01, 2023 AEST

Accepted: January 05, 2024 AEST

References

Federal Highway Administration. 2018. 2017 National Household Travel Survey. https:/​/​nhts.ornl.gov/​.
Google Scholar
———. 2023a. 2022 National Household Travel Survey. United States Department of Transportation. https:/​/​nhts.ornl.gov/​.
Google Scholar
———. 2023b. 2022 NextGen NHTS Annotated Survey. United States Department of Transportation. https:/​/​nhts.ornl.gov/​.
Google Scholar
Fisher, M. Personal communication. 2023. “Question about 2022 NHTS Results,” November 17, 2023.
Parker, Madeleine E.G., Meiqing Li, Mohamed Amine Bouzaghrane, Hassan Obeid, Drake Hayes, Karen Trapenberg Frick, Daniel A. Rodríguez, Raja Sengupta, Joan Walker, and Daniel G. Chatman. 2021. “Public Transit Use in the United States in the Era of COVID-19: Transit Riders’ Travel Behavior in the COVID-19 Impact and Recovery Period.” Transport Policy 111 (September):53–62. https:/​/​doi.org/​10.1016/​j.tranpol.2021.07.005.
Google Scholar
Paul, Julene, and Brian D. Taylor. 2022. “Pandemic Transit: Examining Transit Use Changes and Equity Implications in Boston, Houston, and Los Angeles.” Transportation, October. https:/​/​doi.org/​10.1007/​s11116-022-10345-1.
Google Scholar

This website uses cookies

We use cookies to enhance your experience and support COUNTER Metrics for transparent reporting of readership statistics. Cookie data is not sold to third parties or used for marketing purposes.

Powered by Scholastica, the modern academic journal management system