1. QUESTIONS
The COVID-19 pandemic necessitated masking, physical distancing, and periods of ‘lockdown’. The World Health Organization (2020) and municipalities across the western world encouraged walking and cycling to the greatest extent possible in order to limit the risk of virus transmission. During the COVID-19 pandemic, many western cities implemented suites of street reallocation initiatives to facilitate more space for walking, cycling, and rolling to fulfill residents’ transportation and recreation needs (Buehler and Pucher 2022; Kraus and Koch 2021; Mitra et al. 2023). In the Canadian context, these initiatives included temporary on-street bike lanes, the closure of major roads to automobile traffic (sometimes on select days of a week) to allow for active transportation and recreation, and the implementation of residential streets that discouraged non-local traffic.
The restrictions borne by the pandemic, coupled with these street reallocations, may have encouraged more bicycling overall (Buehler and Pucher 2022; Kraus and Koch 2021). These initiatives offered an opportunity to improve our understanding of the effects of cycling facilities on travel behaviour. In this paper, we explored how frequently people in Canada’s most populous urban regions cycled during the COVID-19 pandemic compared to their self-reported pre-pandemic levels. We also examined the characteristics of those people who reported increased cycling during the pandemic.
2. METHODS
In July 2021, we administered a survey to 2,066 adults living in the cities of Toronto, Montréal, and municipalities in the Vancouver region (Vancouver, Surrey, Burnaby, New Westminster, District of North Vancouver, City of North Vancouver, West Vancouver, and White Rock), Canada. Collectively, the study area represents Canada’s largest urban regions with a total population of over 6.5 million people (Statistics Canada 2022). The market Research firm Canadian Viewpoint was hired to conduct an online survey where the sample represented population proportions of age (within ± 3%), median household income (within ± 1%), and gender (women represent 50% of all respondents). More details on the survey protocol can be found in Mitra et al. (2023). At the time of the survey, gradual re-openings were occurring in all three cities. The easing of restrictions included expanded outdoor gatherings and permitted limited indoor shopping, dining, and recreational fitness.
The survey asked respondents to self-report how often they cycled before (pre-March 2020) and during (March 2020 to July 2021) the pandemic, using the following scale: “I am unable to do this”, “never”, “less than once a month”, “once a month or more”, “once a week or more”, and “almost every day”. We categorized respondents who indicated cycling “once a week or more” or “almost every day” as frequent cyclists. Others were categorized as infrequent (or non-) cyclists. The survey also asked if street reallocation initiatives provided improved accessibility to respondents’ usual and/or desired destinations by active transportation.
The sample characteristics are summarized in Table 1. We examined the built environment characteristics of residential locations (dwelling density, point of interest density, and pre-pandemic cycling infrastructure density) within a 1 km network distance of each postal code (small geographical areas comprising an average of 19 households). To address multi-collinearity in built environment features we used a Principal Component Analysis (PCA), which identified one underlying construct. A factor analysis (using only one factor) produced a z-normalized neighbourhood characteristics score, where a higher score indicates a more urban neighbourhood. We also measured the total length of pandemic-time (i.e., newly constructed since the start of the pandemic) on-street bike lanes and major road closures (km) within a 2 km network buffer of each respondent’s residence.
We calculated the frequencies of self-reported cycling rates for pre-pandemic and pandemic-time periods. Next, we estimated a binomial logistic regression of the sub-sample who were infrequent cyclists pre-pandemic (n=1,688), to identify characteristics of those who reported a change to frequent cycling (“once a week or more” or “almost every day”) during the pandemic, versus those who did not. We estimated a Firth-adjusted binomial logistic regression model (Firth 1993) to avoid issues of separation due to the small “success rate” in the dependent variable.
3. FINDINGS
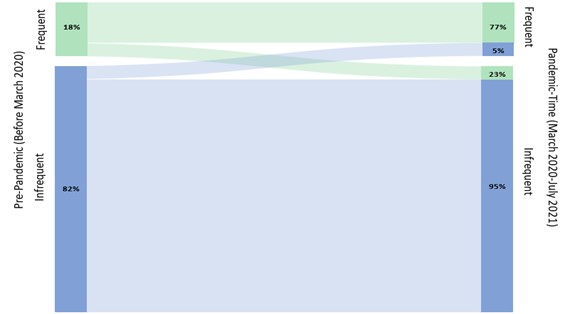
Prior to the pandemic, 18% of respondents reported cycling frequently (at least weekly), while 82% were infrequent cyclists (less than once per week). We found that of those who were frequent cyclists prior to the pandemic, 77% (n=290/358) remained frequent cyclists during the pandemic (Figure 1). In contrast, 5% (n=88/1,688) of respondents who indicated they were infrequent or non-cyclists prior to the pandemic became frequent cyclists during the first year of the pandemic. Our modelling focuses on this group who reported a shift to increased cycling, as a target group for future policy to improve population-level cycling rates.

The logistic regression estimated the odds of infrequent (or non-) cyclists becoming frequent cyclists during the pandemic, based on self-reported cycling frequency data. Those aged 30 to 59 years (Odds Ratio, OR = 3.7), and who identified as male (OR = 1.96) were more likely to become frequent cyclists. Also, those living in more urban neighbourhoods (OR = 1.26) were more likely to report cycling frequently during the pandemic (Table 2). The amount of pandemic-time cycling facilities was not associated with self-reported cycling frequency change, but those who felt that the new cycling facilities provided better access to their usual and/or desired locations were more likely to report cycling frequently during the pandemic (OR = 2.45). Self-reported cycling behaviour change was similar across racial and income groups, all else being equal.
Taken altogether, our findings suggest that most respondents (91%, n=1,890) did not self-report a change in their cycling frequency from before to during the pandemic. However, focusing on pre-pandemic infrequent cyclists (82%, n=1,688), we found that self-reported increases in cycling frequency were more likely among those who were male, aged between 30-59 years, and living in more urban neighbourhoods. Perceived improved accessibility provided by new cycling facilities also played an important role in potentially encouraging frequent cycling during the pandemic, especially when compared to the amount of new cycling facilities that were implemented during that same time. Our findings underscore the importance of strategic investment in cycling infrastructure to improve accessibility.
ACKNOWLEDGEMENTS AND DISCLAIMER
The research was funded by a Social Sciences and Humanities Research Council of Canada (SSHRC) Insight Grant (#435-2021-1044). The Canadian Active Living Environments Index (Can-ALE), indexed to DMTI Spatial Inc. postal codes, were used to measure some of our built environment variables. The index was accessed via CANUE (Canadian Urban Environmental Health Research Consortium) Data Portal: https://www.canuedata.ca/. Jeneva Beairsto at Simon Fraser University assisted with some GIS measures.