Processing math: 100%
Skip to main content
null
Findings
  • Menu
  • Articles
    • Energy Findings
    • Resilience Findings
    • Safety Findings
    • Transport Findings
    • Urban Findings
    • All
  • For Authors
  • Editorial Board
  • About
  • Blog
  • covid-19
  • search

RSS Feed

Enter the URL below into your favorite RSS reader.

http://localhost:54963/feed
Urban Findings
February 13, 2024 AEST

Comparison of Embodied Carbon of 3D-printed vs. Conventionally Built Houses

Costanza Rossi, Fabian Reitemeyer, Oliver Heidrich, Diego Rybski,
3d-printinghousesbuildingsembodied emissions
Copyright Logoccby-4.0 • https://doi.org/10.32866/001c.89707
Findings
Rossi, Costanza, Fabian Reitemeyer, Oliver Heidrich, and Diego Rybski. 2024. “Comparison of Embodied Carbon of 3D-Printed vs. Conventionally Built Houses.” Findings, February. https:/​/​doi.org/​10.32866/​001c.89707.
Save article as...▾
Download all (2)
  • Figure 1. Greenhouse gas emissions associated with the construction of 3D-printed houses com-pared to conventional ones.
    Download
  • Figure 2. Composition of greenhouse gas emissions associated with the construction of 3D-printed houses compared to conventional ones.
    Download

Sorry, something went wrong. Please try again.

If this problem reoccurs, please contact Scholastica Support

Error message:

undefined

View more stats

Abstract

The construction sector makes a considerable contribution to global greenhouse gas emissions. Considering the ongoing urbanization trends and climate change urgency, the exploration of alternative construction techniques should be a mandate. 3D-printing represents an emergent technology and more and more specimen are being built. We collect data of raw material use for houses that have already been built using 3D-printing. Assessing the construction related emissions, we find that the four examples, for which we could obtain the data, do have less emissions per square meter than conventionally built houses (10 international examples). We argue that 3D-printing represents an interesting alternative, but further research is necessary, not just in terms of environmental implications but also to better understand the social implications, e.g. health and safety or labor.

1. Questions

Ongoing global population growth and urbanization require tremendous amounts of raw materials for urban infrastructure (Churkina et al. 2020). Globally, 36 % of energy related greenhouse gas emissions (GHG) are caused by buildings and their construction (UNEP 2021). In particular, 74 % to 81 % of the greenhouse gas emissions from the production of concrete are due to cement (Flower and Sanjayan 2007). It has been estimated that a global population of 9.3 billion by 2050 will require 35 % to 60 % of the carbon budget to stay below the 2∘C limit (Müller et al. 2013). Accordingly, the way new buildings are constructed can make significant contributions to reduce carbon emissions.

A new technology in the construction sector is 3D-printing. Instead of building brick walls or pour concrete into formwork, a robot applies concrete layer by layer to construct walls. While walls made from bricks and mortar are labor intensive and pouring concrete imposes constraints on shapes, 3D-printing is less demanding and round walls can be built easily. But what about its environmental impacts? Previous studies showed that 3D-printed houses tend to perform better in terms of environmental impacts than conventional buildings (Alhumayani et al. 2020; Mohammad et al. 2020). How do the resource demands in terms of concrete and GHG emissions of 3D-printed houses – those that have actually been built – compare with those of similar houses that have been built conventionally?

2. Methods

We contacted manufacturers of 3D-printers and companies that already erected houses, asking for specifications and resource use of the construction, see Tab. I. Then, we analyze data on the building materials used in the construction of fourteen houses, of which ten were built using conventional construction techniques (Tab. II) and four houses that were 3D-printed. The only components that are 3D-printed are the foundations and the outer and inner walls, and all the rest is built in the same way as conventional buildings. Only the materials used for these components are considered in this study, i.e. only considering the amount of materials that ended up in the buildings and not accounting for material loss during construction. We feed the data into SimaPro tool (PRé Sustainability, n.d.), and perform the Life-Cycle Assessment, to calculate the GHG emissions (CO2-equivalent) from the building materials. Emissions resulting from raw materials extraction, processing, and transport were included, as were those from the construction process itself, while the emissions from the rest of the life cycle (use and disposal) were out of scope for this study. We used 1 m2 usable living space as the functional unit for comparisons (Rossi 2022).

Table I.Inventory of inputs per functional unit of 3D-printed buildings. The transportation of the printer and the weight are given as absolute values and not per functional unit.
Black Buffalo Hous3Druck COBOD WASP
Location USA, FL Germany Denmark Italy
Size [sqm] 31 160 50 20
Cement [kg] 218.19 334.31 122.40 0.00
Aggregate [kg] 416.00 622.12 227.60 56.25
Clay [kg] 0.00 0.00 0.00 131.25
Lime [kg] 0.00 0.00 0.00 75.00
Polypropylene fibres [kg] 1.28 2.19 0.40 0.00
Water [kg] 64.27 90.69 33.20 75.00
Electricity [kWh] 10.60* 10.60* 10.60* 10.60*
3D-printer transport [km] 250.00 534.00 0.80 0.00
3D-printer weight [kg] 19000.00 5390.00 5390.00 150.00

*) For the electricity consumption of the 3D-printers we use a uniform lump sum based on the value retrieved from WASP.

Table II.Inventory of inputs per functional unit of conventional constructed buildings.
Germany 1 Germany 2 Canada 1 Canada 2 USA Switzerland Spain Colombia Cameroon 1 Cameroon 2
Size [sqm] 257 880 236 4160 317 353 160 140 95 69
Concrete [kg] 283.62 899.19 136.46 3287.16 497.55 962.99 194.99 187.33 671.58 283.35
Cement [kg] 103.89 379.38 43.18 129.22 34.44 84.54 12.45 13.58 86.36 46.07
Aggregate [kg] 79.38 202.72 0.00 0.00 111.91 73.15 0.00 0.00 2.61 1.83
Brick [kg] 242.80 1289.10 22.36 0.00 0.00 51.35 87.74 71.98 0.00 197.91
Timber [kg] 6.23 17.90 20.06 441.36 21.17 23.15 2.18 10.70 0.91 0.00
Steel [kg] 14.79 98.44 7.31 34.24 3.23 21.71 3.62 5.72 0.00 0.00
Electricity [kWh] 68.00* 68.00* 68.00* 68.00* 68.00* 68.00* 68.00* 68.00* 68.00* 68.00*

*) For the electricity consumption we use an estimate obtained from SimaPro which includes the operation of equipment.

3. Findings

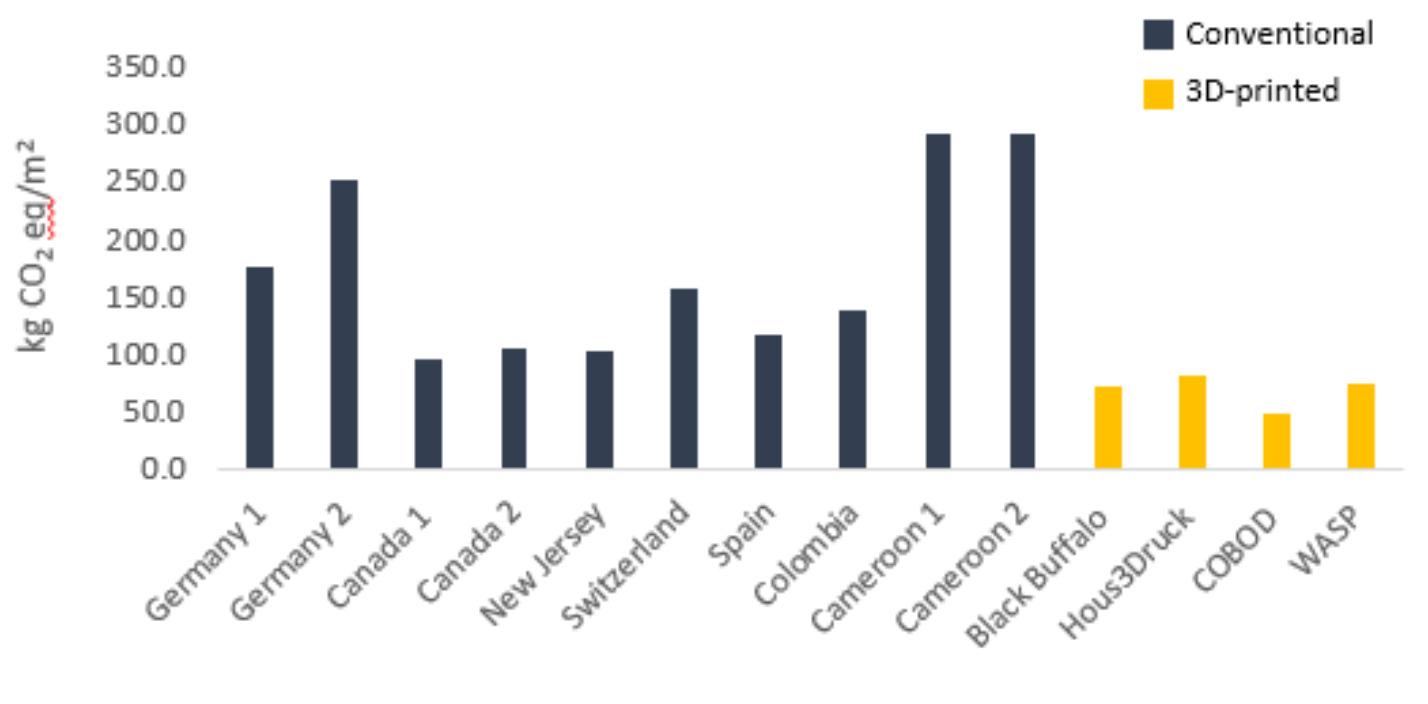
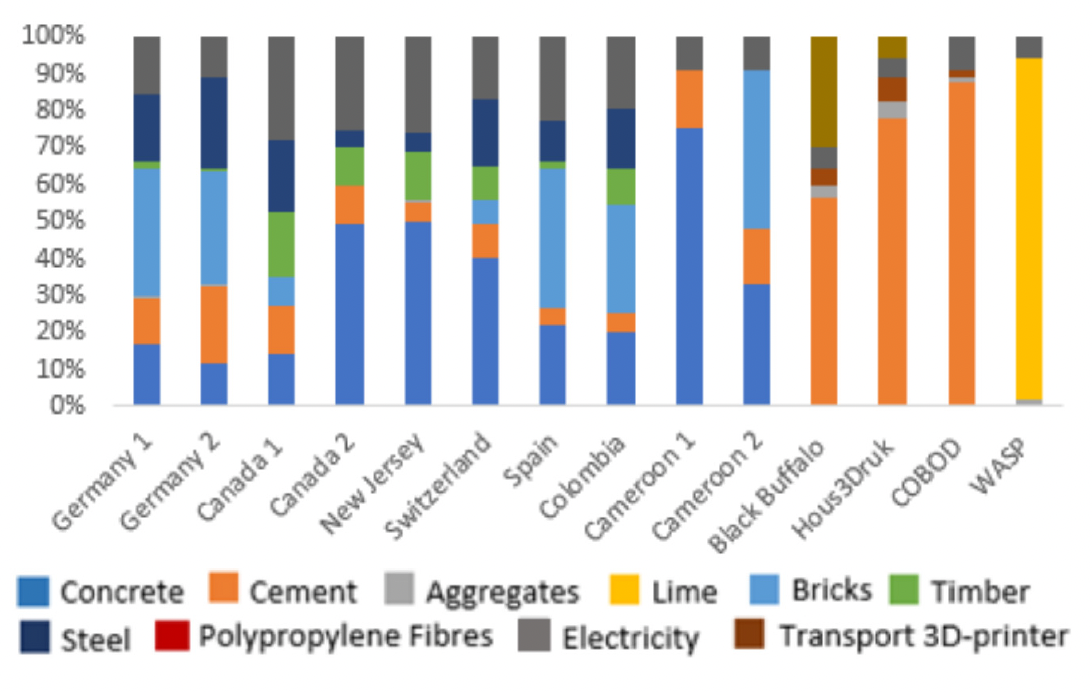
We find that the contribution of GHG emissions from the four 3D-printed houses are lower than that of the conventionally built ones (Fig. 1). The average contribution is 58 kg CO2-eq/m2 for the 3D-printed houses, and 147 kg CO2-eq/m2 for the conventional houses. This discrepancy of approximately a factor of 2 is probably due to the amount and the different raw materials that are used. As can be seen in Fig. 2, in conventional buildings a large share of emissions come from the use of bricks, concrete, and steel. In 3D-printed buildings, fewer materials are needed, mostly special compositions of concrete, so the emissions are lower. Ready-mixed concrete can be used by some printers, but specially designed compositions are usually preferred to meet the requirements in terms of printability and resistance (Siddika et al. 2019). The standard deviation is 15 kg CO2-eq/m2 for 3D-printed houses and 78 kg CO2-eq/m2 for conventional ones. The high variability of emissions from conventional buildings can be attributed to different techniques and materials that are used in the various cultural and climatic settings. We also find that the emissions per square meter from 3D-printed houses are lower than those from the conventional building regardless of the cement used.

Figure 1
Figure 1.Greenhouse gas emissions associated with the construction of 3D-printed houses com-pared to conventional ones.

GHG emission values per square meter living space are compared for various locations and examples. 3D-printed buildings (right, yellow) are overall responsible for less emissions than conventional ones (left, grey). As the rest of the buildings are mostly equiv-alent, only foundations and walls have been taken into account. The locations of the 3D-printed houses are Hous3Druck, Germany; WASP, Italy; Black Buffalo, Florida; and COBOD, Denmark. Conventional construction stems from buildings since the 1980s (e.g. for Germany the information refers to the period 1991-2010 of Ecological Urban and Development [2022]). The low emissions of Canada 1 are due to the reduced concrete use.

Figure 2
Figure 2.Composition of greenhouse gas emissions associated with the construction of 3D-printed houses compared to conventional ones.

The contribution (as percentage) of various building materials and energy to the total emissions of CO2-eq/m2 is provided for each considered house (see Fig. 1). While conventional houses have variable contributions but largely from concrete and bricks, for 3D-printed ones cement dominates.

One may object that the 3D-printed houses are not truly comparable to the conventionally built ones because perimeter and area might not be linearly related. Future research will be necessary to control differences in materials intensity for different homes due to various factors, including the size and the number of rooms. Moreover, the conventional buildings considered in our study are built for different climate conditions and as such the indoor thermal comfort generally requires different levels of insulation and air-tightness. Thus, strictly speaking, Hous3Druck and COBOD can only be compared with the Germany 1 and Germany 2 examples – which in any case results in a better balance of the 3D-printed houses. Future research will be necessary to control for insulation levels and similar aspects.

If nothing changes it is estimated that by 2060, global emissions caused by cement will account for 12 % (UNEP-IRP 2019), which is at odds with the 1.5∘C limit, and massive GHG reductions of 80 % to 90 % must be achieved in the buildings sector in 2050 (Coninck et al. 2018). Despite the emissions efficiency of 3D-printing, a large scale impact on the reduction of emissions is only feasible if the technology is used where there is a large demand in the construction sector, i.e. in the Global South (Hoornweg and Pope 2016). While progress is made regarding the number of printable floors, 3D-printing is still in its infancy and scalability is challenging. It is also worth mentioning that the social implications of the diffusion of this technology are unclear. Less personnel are needed for 3D-printing a house compared to a conventional one, but the employees need to be more specialized. This could be another reason for the limited application in the Global South. Nevertheless, to deliver the housing and infrastructure needs of the future in a low carbon world 3D-printing might be a new technology that needs closer attention and scaling beyond the niche it currently holds in the construction sector.


Acknowledgments

D. Rybski thanks the Alexander von Humboldt Foundation for financial support under the Feodor Lynen Fellowship.

Submitted: April 26, 2023 AEST

Accepted: November 02, 2023 AEST

References

Alhumayani, Hashem, Mohamed Gomaa, Veronica Soebarto, and Wassim Jabi. 2020. “Environmental Assessment of Large-Scale 3d Printing in Construction: A Comparative Study between Cob and Concrete.” Journal of Cleaner Production 270 (October):122463. https:/​/​doi.org/​10.1016/​j.jclepro.2020.122463.
Google Scholar
Churkina, Galina, Alan Organschi, Christopher P. O. Reyer, Andrew Ruff, Kira Vinke, Zhu Liu, Barbara K. Reck, T. E. Graedel, and Hans Joachim Schellnhuber. 2020. “Buildings as a Global Carbon Sink.” Nature Sustainability 3 (4): 269–76. https:/​/​doi.org/​10.1038/​s41893-019-0462-4.
Google Scholar
Coninck, H. de, A. Revi, M. Babiker, P. Bertoldi, M. Buckeridge, A. Cartwright, W. Dong, J. Ford, S. Fuss, and J.-C. Hourcade. 2018. “Strengthening and Implementing the Global Response,” 313–443.
Google Scholar
Flower, David J. M., and Jay G. Sanjayan. 2007. “Green House Gas Emissions Due to Concrete Manufacture.” The International Journal of Life Cycle Assessment 12 (5): 282–88. https:/​/​doi.org/​10.1065/​lca2007.05.327.
Google Scholar
Hoornweg, Daniel, and Kevin Pope. 2016. “Population Predictions for the World’s Largest Cities in the 21st Century.” Environment and Urbanization 29 (1): 195–216. https:/​/​doi.org/​10.1177/​0956247816663557.
Google Scholar
Leibniz Institute of Ecological Urban and Regional Development. 2022. “Information Portal for Structural Data, One- and Two-Family House from 1991 to 2010.” 2022. http:/​/​ioer-bdat.de/​en/​structural-data/​domestic-buildings/​otfh-1991-2010/​.
Mohammad, Malek, Eyad Masad, Thomas Seers, and Sami G. Al-Ghamdi. 2020. “High-Performance Light-Weight Concrete for 3d Printing.” RILEM Bookseries, 459–67. https:/​/​doi.org/​10.1007/​978-3-030-49916-7_47.
Google Scholar
Müller, Daniel B., Gang Liu, Amund N. Løvik, Roja Modaresi, Stefan Pauliuk, Franciska S. Steinhoff, and Helge Brattebø. 2013. “Carbon Emissions of Infrastructure Development.” Environmental Science & Technology 47 (20): 11739–46. https:/​/​doi.org/​10.1021/​es402618m.
Google Scholar
PRé Sustainability. n.d. “SimaPro.” https:/​/​simapro.com.
Rossi, C. 2022. “Environmental Impacts of 3D-Printed and Conventional Houses and Applicability of 3D-Printing to Provide Sustainable Housing in Developing Countries.” Master thesis, Nijmegen, Netherlands: Faculty of Science, Radboud University Nijmegen.
Siddika, Ayesha, Md. Abdullah Al Mamun, Wahid Ferdous, Ashish Kumer Saha, and Rayed Alyousef. 2019. “3d-Printed Concrete: Applications, Performance, and Challenges.” Journal of Sustainable Cement-Based Materials 9 (3): 127–64. https:/​/​doi.org/​10.1080/​21650373.2019.1705199.
Google Scholar
UNEP. 2021. “Global Status Report for Buildings and Construction: Towards a Zero‑emission, Efficient and Resilient Buildings and Construction Sector.” 2021. https:/​/​globalabc.org/​resources/​publications/​2021-global-status-report-buildings-and-construction.
UNEP-IRP. 2019. Global Resources Outlook 2019: Natural Resources for the Future We Want.
Google Scholar

This website uses cookies

We use cookies to enhance your experience and support COUNTER Metrics for transparent reporting of readership statistics. Cookie data is not sold to third parties or used for marketing purposes.

Powered by Scholastica, the modern academic journal management system