Loading [Contrib]/a11y/accessibility-menu.js
Skip to main content
null
Findings
  • Menu
  • Articles
    • Energy Findings
    • Resilience Findings
    • Safety Findings
    • Transport Findings
    • Urban Findings
    • All
  • For Authors
  • Editorial Board
  • About
  • Blog
  • covid-19
  • search

RSS Feed

Enter the URL below into your favorite RSS reader.

http://localhost:35864/feed
Transport Findings
November 15, 2023 AEST

Exploring Pedestrian Injury Severity by Incorporating Spatial Information in Machine Learning

Shaila Jamal, K. Bruce Newbold, Darren Scott,
pedestrian injuryspatial filteringmachine learningrandom forest
Copyright Logoccby-sa-4.0 • https://doi.org/10.32866/001c.89416
Findings
Jamal, Shaila, K. Bruce Newbold, and Darren Scott. 2023. “Exploring Pedestrian Injury Severity by Incorporating Spatial Information in Machine Learning.” Findings, November. https:/​/​doi.org/​10.32866/​001c.89416.
Save article as...▾
Download all (2)
  • Figure 2. Mean Decrease Accuracy plots of the RF models
    Download
  • Supplemental Information
    Download

Sorry, something went wrong. Please try again.

If this problem reoccurs, please contact Scholastica Support

Error message:

undefined

View more stats

Abstract

Using the random forest classification technique, this study explored the role of different factors such as demography, pedestrian and drivers’ conditions, collision characteristics, road characteristics, and weather in predicting pedestrian injury severity from automobile-related collisions in Toronto. Spatial information was incorporated in the models to capture spatial autocorrelation. The results revealed the importance of spatial information in predicting pedestrian injury severity. Other important predictors of pedestrian injury severity include aggressive driving, driver’s conditions (e.g., inattentive, slowly stopping, driving properly, failing to yield right of way), pedestrian conditions (e.g., normal, inattentive) and dark lighting conditions.

1. Questions

Pedestrian safety is a major concern in the transportation industry since pedestrians are the most vulnerable group to be injured in motor vehicle-related traffic collisions (Beck, Dellinger, and O’neil 2007; Toronto Public Health 2012, 2015; Pour-Rouholamin and Zhou 2016). In Toronto, Ontario, pedestrians accounted for 44% and 62% of all fatalities from traffic collisions in 2022 and in 2023 (as of October 16, 2023), respectively (City of Toronto 2023). An understanding of the relevant factors that contribute to injury severity due to collisions can provide insights to improve pedestrian safety. Accordingly, by incorporating spatial information, this study explored the role of different factors such as demography, pedestrian and drivers’ conditions, collision characteristics, road characteristics, and weather in predicting pedestrian injury severity from automobile-related collisions.

2. Methods

The traffic collision data of the City of Toronto from 2006 – 2022 is obtained from the Toronto Police Service’s public safety data portal (http://data.torontopolice.on.ca/datasets/ksi/data). The injury severity of each individual involved in the collision was recorded in five categories: None – Minimal – Minor – Major – Fatal. Collision-related data were also available in the database, including age of the individual(s) involved, type of vehicle(s) involved, condition(s) of the individuals involved, time of occurrence, visibility, lighting condition, collision location (e.g., intersection, non-intersection, near private driveway), type of traffic control at the collision location, road condition, etc. As this study focused on automobile-related pedestrian injury, collision data involving other vehicle types were excluded from the analysis. The information on drivers’ and vehicle passengers’ injury levels in pedestrian-automobile collisions were also excluded but drivers’ age and information on their conditions during the collision (e.g., impaired driving, inattentiveness, etc.) were included to explore whether these factors contribute to pedestrian injury severity. Finally, 2021 observations were selected for analysis. The distribution of injury severity class is – Fatal: 13%, Major: 80%, Minor: 4%, Minimal: 2%, None: 1%. Please refer to the Supplemental Information to be informed about the class imbalance in the dataset and how it has been resolved.

The analysis was conducted using a non-parametric machine learning technique known as random forest (RF) classification model which is widely used in injury severity analysis (e.g., Li et al. 2017; Rezapour et al. 2021). Predictor variables used in model development are presented in Table 1. As multicollinearity does not affect the prediction accuracy in RF algorithm, no tests were conducted to check for multicollinearity among the predictors.

Table 1.Predictors used in pedestrian injury severity in RF models.
Predictor Note Percentage
Non-spatial predictors
Major_Arterial Dummy variable. 1 if the collision occurred on a major arterial road. 72%
ACCLOC_Intersection Dummy variable. 1 if the collision occurred in an intersection. 70%
TRAFFCTL_NoControl Dummy variable. 1 if there is no traffic control at the collision location. 44%
TRAFFCTL_TrafficSignal Dummy variable. 1 if there is a traffic signal at the collision location. 46%
VISIBILITY_Rain Dummy variable. 1 if it was raining at the time of collision. 16%
LIGHT_Dark Dummy variable. 1 if the light condition at the time of collision was dark. 43%
RDSFCOND_Wet Dummy variable. 1 if the road surface condition was wet at the time of collision. 24%
PED_0_to_19years Dummy variable. 1 if the age of the pedestrian was between 0 to 19 years. 11%
PED_20_to_34years Dummy variable. 1 if the age of the pedestrian was between 20 to 34 years. 25%
PED_35_to_49years Dummy variable. 1 if the age of the pedestrian was between 35 to 49 years. 20%
PED_50_to_64years Dummy variable. 1 if the age of the pedestrian was between 50 to 64 years. 18%
PED_65_to_79years Dummy variable. 1 if the age of the pedestrian was between 65 to 79 years. 16%
PED_80years_n_above Dummy variable. 1 if the age of the pedestrian was 80 years or above. 10%
PEDCOND_Normal Dummy variable. 1 if the pedestrian was in normal condition. 58%
PEDCOND_Impaired_Alcohol_Drugs Dummy variable. 1 if the pedestrian was ability impaired due to alcohol or drug use. 2%
PEDCOND_HadbeenDrinking Dummy variable. 1 if the pedestrian had been drinking at the time of collision. 7%
PEDCOND_Inattentive Dummy variable. 1 if the pedestrian was inattentive at the time of collision. 16%
PEDCOND_Disability Dummy variable. 1 if the pedestrian had a medical and physical disability. 2%
DRV_15_to_19years Dummy variable. 1 if the age of the driver was between 15 to 19 years. 5%
DRV_20_to_34years Dummy variable. 1 if the age of the driver was between 20 to 34 years. 24%
DRV_35_to_49years Dummy variable. 1 if the age of the driver was between 35 to 49 years. 19%
DRV_50_to_64years Dummy variable. 1 if the age of the driver was between 50 to 64 years. 18%
DRV_65_to_79years Dummy variable. 1 if the age of the driver was between 65 to 79 years. 16%
DRV_80years_n_above Dummy variable. 1 if the age of the driver was 80 years and above. 9%
DRV_Going_Ahead Dummy variable. 1 if the driver was going ahead. 55%
DRV_Turning_Left Dummy variable. 1 if the driver was turning left. 27%
DRV_Turning_Right Dummy variable. 1 if the driver was turning right. 6%
DRV_Slowing_Stopping Dummy variable. 1 if the driver was slowing or stopping. 3%
DRV_Driving_Properly Dummy variable. 1 if the driver was driving properly. 44%
DRV_Failed_ROW Dummy variable. 1 if the driver failed to yield the right of way. 31%
DRV_Disobeyed_TRAFFCTRL Dummy variable. 1 if the driver disobeyed traffic control. 4%
DRV_Improper_Turn Dummy variable. 1 if the driver was making an improper turn. 4%
DRV_Lost_CTRL Dummy variable. 1 if the driver lost control of the vehicle. 4%
DRVCOND_Normal Dummy variable. 1 if the driver was in normal condition. 61%
DRVCOND_Impaired_Alcohol_Drugs Dummy variable. 1 if the driver was ability impaired due to alcohol or drug use. 2%
DRVCOND_HadbeenDrinking Dummy variable. 1 if the driver had been drinking at the time of collision. 2%
DRVCOND_Inattentive Dummy variable. 1 if the driver was inattentive at the time of collision 20%
Aggressive_Driving Dummy variable. 1 if the collision was caused due to aggressive driving. 46%
Spatial predictors
Latitude Latitude of the collision location
Longitude Longitude of the collision location
EV Vector of all approximated eigenvectors extracted by applying spatial filtering approach.

Note: One of the reasons behind creating dummy variables is to tackle the missing information in certain categories such as the age of the driver, collision location, conditions of the persons involved, etc.

One of the frequently reported limitations of machine learning models is that there is no standard method of incorporating spatial information into the model, and as a result, they cannot minimize spatial autocorrelation (Islam et al. 2022). To address this limitation, a RF model for pedestrian injury severity prediction in pedestrian-automobile collisions was developed first without incorporating spatial information (model 1). To incorporate spatial information, two different approaches were followed. First, a RF model was developed where latitude and longitude were used directly as predictors (model 2). Second, the eigenvector spatial filter method was applied to extract approximated eigenvectors from spatial coordinates of the collision location [see Supplemental Information section]. Later, the vector for all approximated eigenvectors (EV) was extracted and included as a predictor within the random forest model (model 3). A comparison of three RF models was made to determine which model demonstrates better performance in terms of predicting pedestrian injury severity in pedestrian-automobile collisions.

The RF models were developed based on 80% of the observations (training dataset: 1617 observations) and tested on the remaining 20% (testing dataset: 404 observations). Two hyperparameters (mtry and ntree) were specified. The mtry parameter controls how many predictors are to be considered in a decision tree at any given point in time. The ntree parameter represents the number of decision trees to be developed for the RF models. A 10-fold cross-validation procedure is used to select the optimal hyperparameter values which involves testing multiple values of the hyperparameters and selecting the optimal values[1] (Ahmed and Roorda 2021). The values tested for the hyperparameters are: mtry = 1 to 10 and ntree = 100, 150, 200, 300, 400, 500, 1000. Based on the results of the cross-validation procedure, the following hyperparameter values were selected[2]:

  • Model 1 (includes no spatial information): mtry = 4, ntree = 100,

  • Model 2 (includes latitude and longitude): mtry = 5, ntree = 400.

  • Model 3 (includes EV): mtry = 6, ntree = 150.

The R package “spmoran” (Murakami 2023) was used to extract the vector for all approximated eigenvectors (EV), “ROSE” (Lunardon, Menardi, and Torelli 2014, 2021) was used to resolve the data imbalance issue, and “randomForest” (Liaw and Wiener 2022) was used to develop the RF models.

3. Findings

Table 2 shows the prediction accuracy of the three models on both training and testing datasets. Prediction accuracy was calculated by developing a confusion matrix of the actual injury classes and predicted injury classes based on the developed models. The inclusion of spatial information in the RF model improves the prediction performance of the models in the training dataset. In all three models, prediction accuracy is slightly degraded in the testing datasets compared to the corresponding training models. However, the testing dataset is the real-life field data which was not used in the training of the prediction models. Based on the results, it can be concluded that the trained models 1, 2 and 3 will be able to predict out-of-sample injury severity class with 83.17%, 84.9% and 81.69% accuracy, respectively.

Table 2.RF model prediction results on training and testing datasets.
Model Prediction accuracy (%)
Training dataset Testing dataset
Model 1 (no spatial information) 91.51%
[OOB estimate of error rate: 11.75%]
83.17%
Model 2 (includes latitude and longitude) 97.09%
[OOB estimate of error rate: 8.04%]
84.9%
Model 3 (includes EV) 97.03%
[OOB estimate of error rate: 8.84%]
81.69%

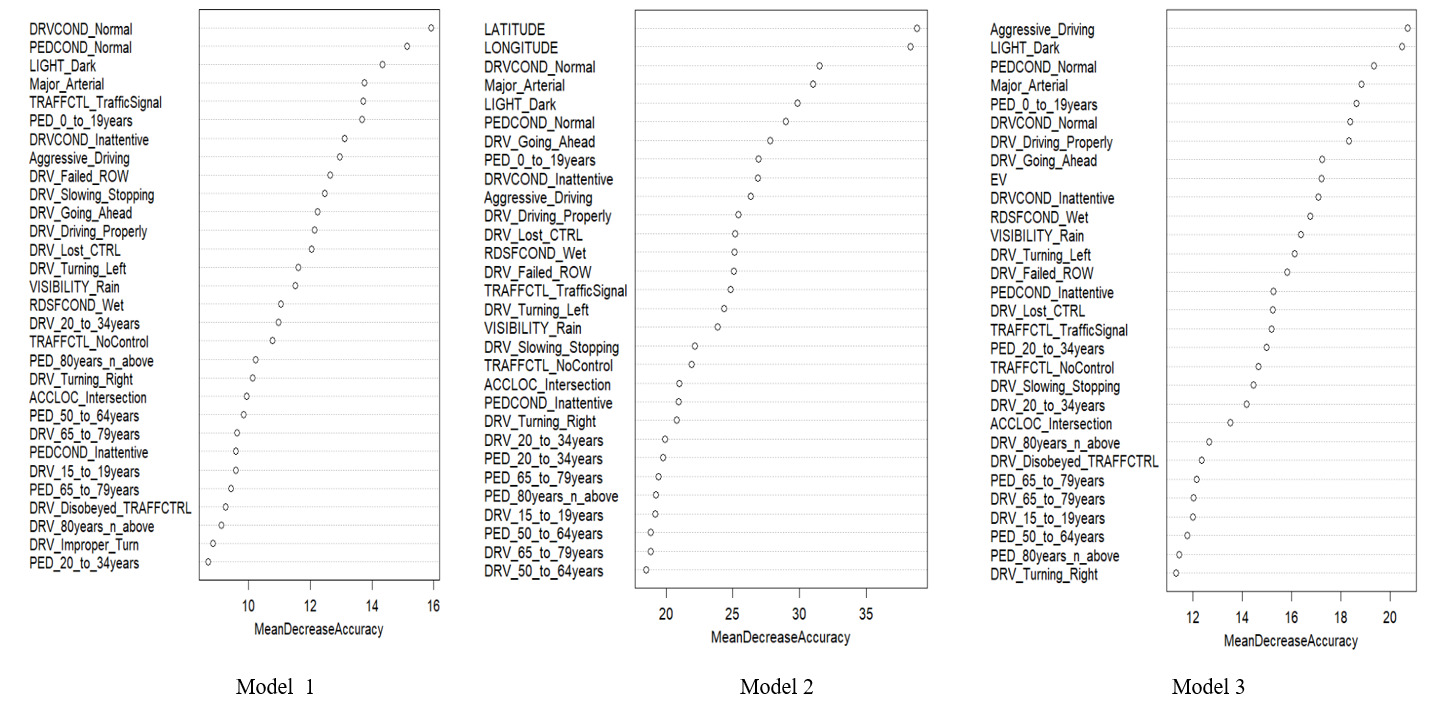
The Mean Decrease Accuracy plots of the three RF models are presented in Figure 2. These plots express how much accuracy the models lose by excluding each predictor.[3] The plots for both models 2 and 3 show the importance of spatial information in predicting pedestrian injury severity. Direct use of latitude and longitude plays a more important role in predicting injury severity than EV as model predictors.

Figure 2
Figure 2.Mean Decrease Accuracy plots of the RF models

The developed model can be used in predicting injury severity in pedestrian-automobile collisions in Toronto. The study results also indicate the importance of developing appropriate countermeasures to increase pedestrian safety, especially related to aggressive driving, and drivers’ and pedestrian conditions. In terms of future work, other machine learning techniques such as gradient boost, XGBoost, and support vector machine (SVM) can be developed and a comparison of the prediction accuracies of the models can be used to determine the optimal prediction model for pedestrian injury severity in pedestrian-automobile collisions in Toronto.


  1. It is expected that enough trees and parameters (in each tree) are considered to stabilize the prediction error and optimize model performance, but using too many trees or parameters involves more computational time.

  2. A slight difference in hyperparameter values is expected as there were differences in variables (i.e., spatial information) included in the dataset.

  3. The first thirty predictors are presented in descending order. The more the accuracy suffers, the more important the predictor is for the successful prediction of classification.

Submitted: September 12, 2023 AEST

Accepted: October 28, 2023 AEST

References

Ahmed, Usman, and Matthew J. Roorda. 2021. “Modeling Freight Vehicle Type Choice Using Machine Learning and Discrete Choice Methods.” Transportation Research Record 2676 (2): 541–52. https:/​/​doi.org/​10.1177/​03611981211044462.
Google Scholar
Beck, L. F., A. M. Dellinger, and M. E. O’neil. 2007. “Motor Vehicle Crash Injury Rates by Mode of Travel, United States: Using Exposure-Based Methods to Quantify Differences.” American Journal of Epidemiology 166 (2): 212–18. https:/​/​doi.org/​10.1093/​aje/​kwm064.
Google Scholar
City of Toronto. 2023. “Vision Zero Dashboard.” https:/​/​www.toronto.ca/​services-payments/​streets-parking-transportation/​road-safety/​vision-zero/​vision-zero-dashboard/​fatalities-vision-zero/​.
Islam, Md. Didarul, Bin Li, Carl Lee, and Xiaoguang Wang. 2022. “Incorporating Spatial Information in Machine Learning: The Moran Eigenvector Spatial Filter Approach.” Transactions in GIS 26 (2): 902–22. https:/​/​doi.org/​10.1111/​tgis.12894.
Google Scholar
Li, Duo, Prakash Ranjitkar, Yifei Zhao, Hui Yi, and Soroush Rashidi. 2017. “Analyzing Pedestrian Crash Injury Severity under Different Weather Conditions.” Traffic Injury Prevention 18 (4): 427–30. https:/​/​doi.org/​10.1080/​15389588.2016.1207762.
Google Scholar
Liaw, A., and M. Wiener. 2022. randomForest: Breiman and Cutler’s Random Forests for Classification and Regression. R package version 4.7-1.1. https:/​/​cran.r-project.org/​web/​packages/​randomForest/​.
Google Scholar
Lunardon, Nicola, Giovanna Menardi, and Nicola Torelli. 2014. “ROSE: A Package for Binary Imbalanced Learning.” R Journal 6 (1): 79. https:/​/​doi.org/​10.32614/​rj-2014-008.
Google Scholar
———. 2021. “ROSE: A Package for Binary Imbalanced Learning. R-Package Version 0.0-4.” 2021. https:/​/​cran.r-project.org/​web/​packages/​ROSE/​.
Murakami, D. 2023. Spmoran: Fast Spatial Regression Using Moran Eigenvectors. R package version 0.2.2.9. https:/​/​cran.r-project.org/​web/​packages/​spmoran/​index.html.
Google Scholar
Pour-Rouholamin, Mahdi, and Huaguo Zhou. 2016. “Investigating the Risk Factors Associated with Pedestrian Injury Severity in Illinois.” Journal of Safety Research 57 (June):9–17. https:/​/​doi.org/​10.1016/​j.jsr.2016.03.004.
Google Scholar
Rezapour, Mahdi, Ahmed Farid, Sahima Nazneen, and Khaled Ksaibati. 2021. “Using Machine Leaning Techniques for Evaluation of Motorcycle Injury Severity.” IATSS Research 45 (3): 277–85. https:/​/​doi.org/​10.1016/​j.iatssr.2020.07.004.
Google Scholar
Toronto Public Health. 2012. “Road to Health: Improving Walking and Cycling in Toronto.” https:/​/​www.toronto.ca/​legdocs/​mmis/​2012/​hl/​bgrd/​backgroundfile-46520.pdf.
———. 2015. “Pedestrian and Cycling Safety in Toronto.” https:/​/​www.toronto.ca/​legdocs/​mmis/​2015/​hl/​bgrd/​backgroundfile-81601.pdf.

This website uses cookies

We use cookies to enhance your experience and support COUNTER Metrics for transparent reporting of readership statistics. Cookie data is not sold to third parties or used for marketing purposes.

Powered by Scholastica, the modern academic journal management system