Loading [Contrib]/a11y/accessibility-menu.js
Skip to main content
null
Findings
  • Menu
  • Articles
    • Energy Findings
    • Resilience Findings
    • Safety Findings
    • Transport Findings
    • Urban Findings
    • All
  • For Authors
  • Editorial Board
  • About
  • Blog
  • covid-19
  • search

RSS Feed

Enter the URL below into your favorite RSS reader.

http://localhost:54963/feed
Resilience Findings
October 27, 2023 AEST

Activity Reduction as Resilience Indicator: Evidence with Filomena Data

Enrique Santiago-Iglesias, Jan Dirk Schmöcker, Jose Carpio-Pinedo, Juan Carlos García-Palomares, Wenzhe Sun,
adaptabilitydisruptionmobilityMadridextreme weather eventresilience
Copyright Logoccby-sa-4.0 • https://doi.org/10.32866/001c.88980
Findings
Santiago-Iglesias, Enrique, Jan Dirk Schmöcker, Jose Carpio-Pinedo, Juan Carlos García-Palomares, and Wenzhe Sun. 2023. “Activity Reduction as Resilience Indicator: Evidence with Filomena Data.” Findings, October. https:/​/​doi.org/​10.32866/​001c.88980.
Save article as...▾
Download all (2)
  • Figure 1. Kernel densities of the number of POI/Ha broadcasting live weighted by the average occupancy of the “Shopping-basic” category at the top and “Shopping-leisure” at the bottom, for each of the weeks in the 2020-2021 period.
    Download
  • Figure 2. Temporal evolution and its standard error of the activity compared with second week of February for low-income (LI) and high-income (HI) neighborhoods
    Download

Sorry, something went wrong. Please try again.

If this problem reoccurs, please contact Scholastica Support

Error message:

undefined

View more stats

Abstract

We explore how different socioeconomic groups adapt to the snowstorm Filomena that occurred in Madrid in 2021. A reverse interpretation of the resilience triangle is proposed, where smaller triangle areas indicate less resilient populations continuing to travel despite disruptions, while larger demand losses indicate greater adaptability. Using Google Popular Times data, the study measures activity levels in neighborhoods, focusing on essential and non-essential trips. Vulnerable groups with lower incomes show limited adaptability, resulting in a smaller reduction in commercial activities compared to affluent neighborhoods. The study emphasizes the significance of considering demand adaptability and socioeconomic factors in assessing resilience.

1. Questions

Resilience is in general defined in terms of adaptability of a system and how quickly the system can recover. A distinction can be made between resilience to supply disruptions and to demand variations (Hosseini, Ivanov, and Dolgui 2019; Shekarian and Mellat Parast 2021). For supply disruptions, there are several studies that propose different indices for calculating resilience and that are contrasting resilience versus efficiency (Ganin et al. 2017). Resilience indices draw often on recursive-ness, redundancy, and speed (Cimellaro, Reinhorn, and Bruneau 2010). Furthermore, a common concept that captures the recovery period is the “resilience triangle” (e.g. Mudigonda, Ozbay, and Bartin 2019). The area covered by the triangle defines the loss of functionality in terms of scale of impact as well as time of impact. The larger the area, the less resilient the system is considered.

The measurement of “functionality” is, however, difficult and often simplified to “supply loss” which then leads to problems: If the demand can adapt to a disruption, then the supply loss will overestimate the impact of the disruption. In that case, approaches that capture the demand and supply interaction are required.

Loss of functionality can also occur in case a network is fully operational (no supply loss) but the mobility pattern is being “disrupted”. The COVID pandemic is the most prominent example of this as here the transportation network has been not affected or only in response to it and in order to control the demand. Other examples are extreme weather conditions (Hong et al. 2021) where possibly the transport network is still operating, or only non-operational for a short time, but people prefer to not use it.

We suggest that the larger the potential to adapt behavior, the less the loss area of a supply-demand resilience triangle appears to capture the disruption impact. In particular, this seems to be the case if people can avoid or postpone making a journey. We propose that in this case, in fact, a reverse thinking is required: The smaller the resilience triangle area the less resilient the population. That is, a population that is forced to keep travelling has less possibility to adapt and might be hence called less resilient. Or, vice versa, the more a population adapts, i.e., the larger the demand loss during the time of the disrupting event, the more resilient the population is. Our research question is hence: Can this ability to adapt be observed during a short-term disruption? As an index of vulnerability, we consider income and ask further: Can we observe that lower income groups have less adaptability in their travel patterns compared to richer population groups? Finally, to further test the difference in ability to adapt we ask: Can we observe differences between essential trips and non-essential trips? Our hypothesis is that demand adaptation to non-essential trips is larger.

2. Methods

To answer these questions, we use data during the storm Filomena. Filomena was an event that occurred in Madrid in January 2021, characterized by a heavy snowfall that paralyzed the entire city for two weeks.

To measure the level of activities we have used data from Google Places API and Google Popular Times (GPT) that measure the busyness of “Points of Interests” (POIs) on a scale from 0 to 100 every hour and have also been used in other studies to estimate activity engagement (Capponi et al. 2019; Mahajan, Cantelmo, and Antoniou 2021; Vongvanich, Sun, and Schmöcker 2023). For example, a restaurant or shop that is “as busy as it gets” obtains a score of 100 and a closed location obtains a zero score.

We collected data from 4277 POIs in Madrid during the Filomena period which have been classified into six different categories (Dining, Entertainment, Tourist attractions, Public facilities, Shopping, Other). For this study, we have specifically selected the POIs from the Shopping category, summing up 2012 POIs. This choice was made because this category allows us to distinguish what are likely to be essential trips and what are likely less essential trips. We define essential trips as “Shopping-Basics” and include supermarkets, convenience stores, etc. (1164 POIs). The remaining shopping facilities, such as, for example, hair-salons, beauty-salons, clothes stores, book stores or shopping malls are defined as “Shopping Leisure” (848 POIs)

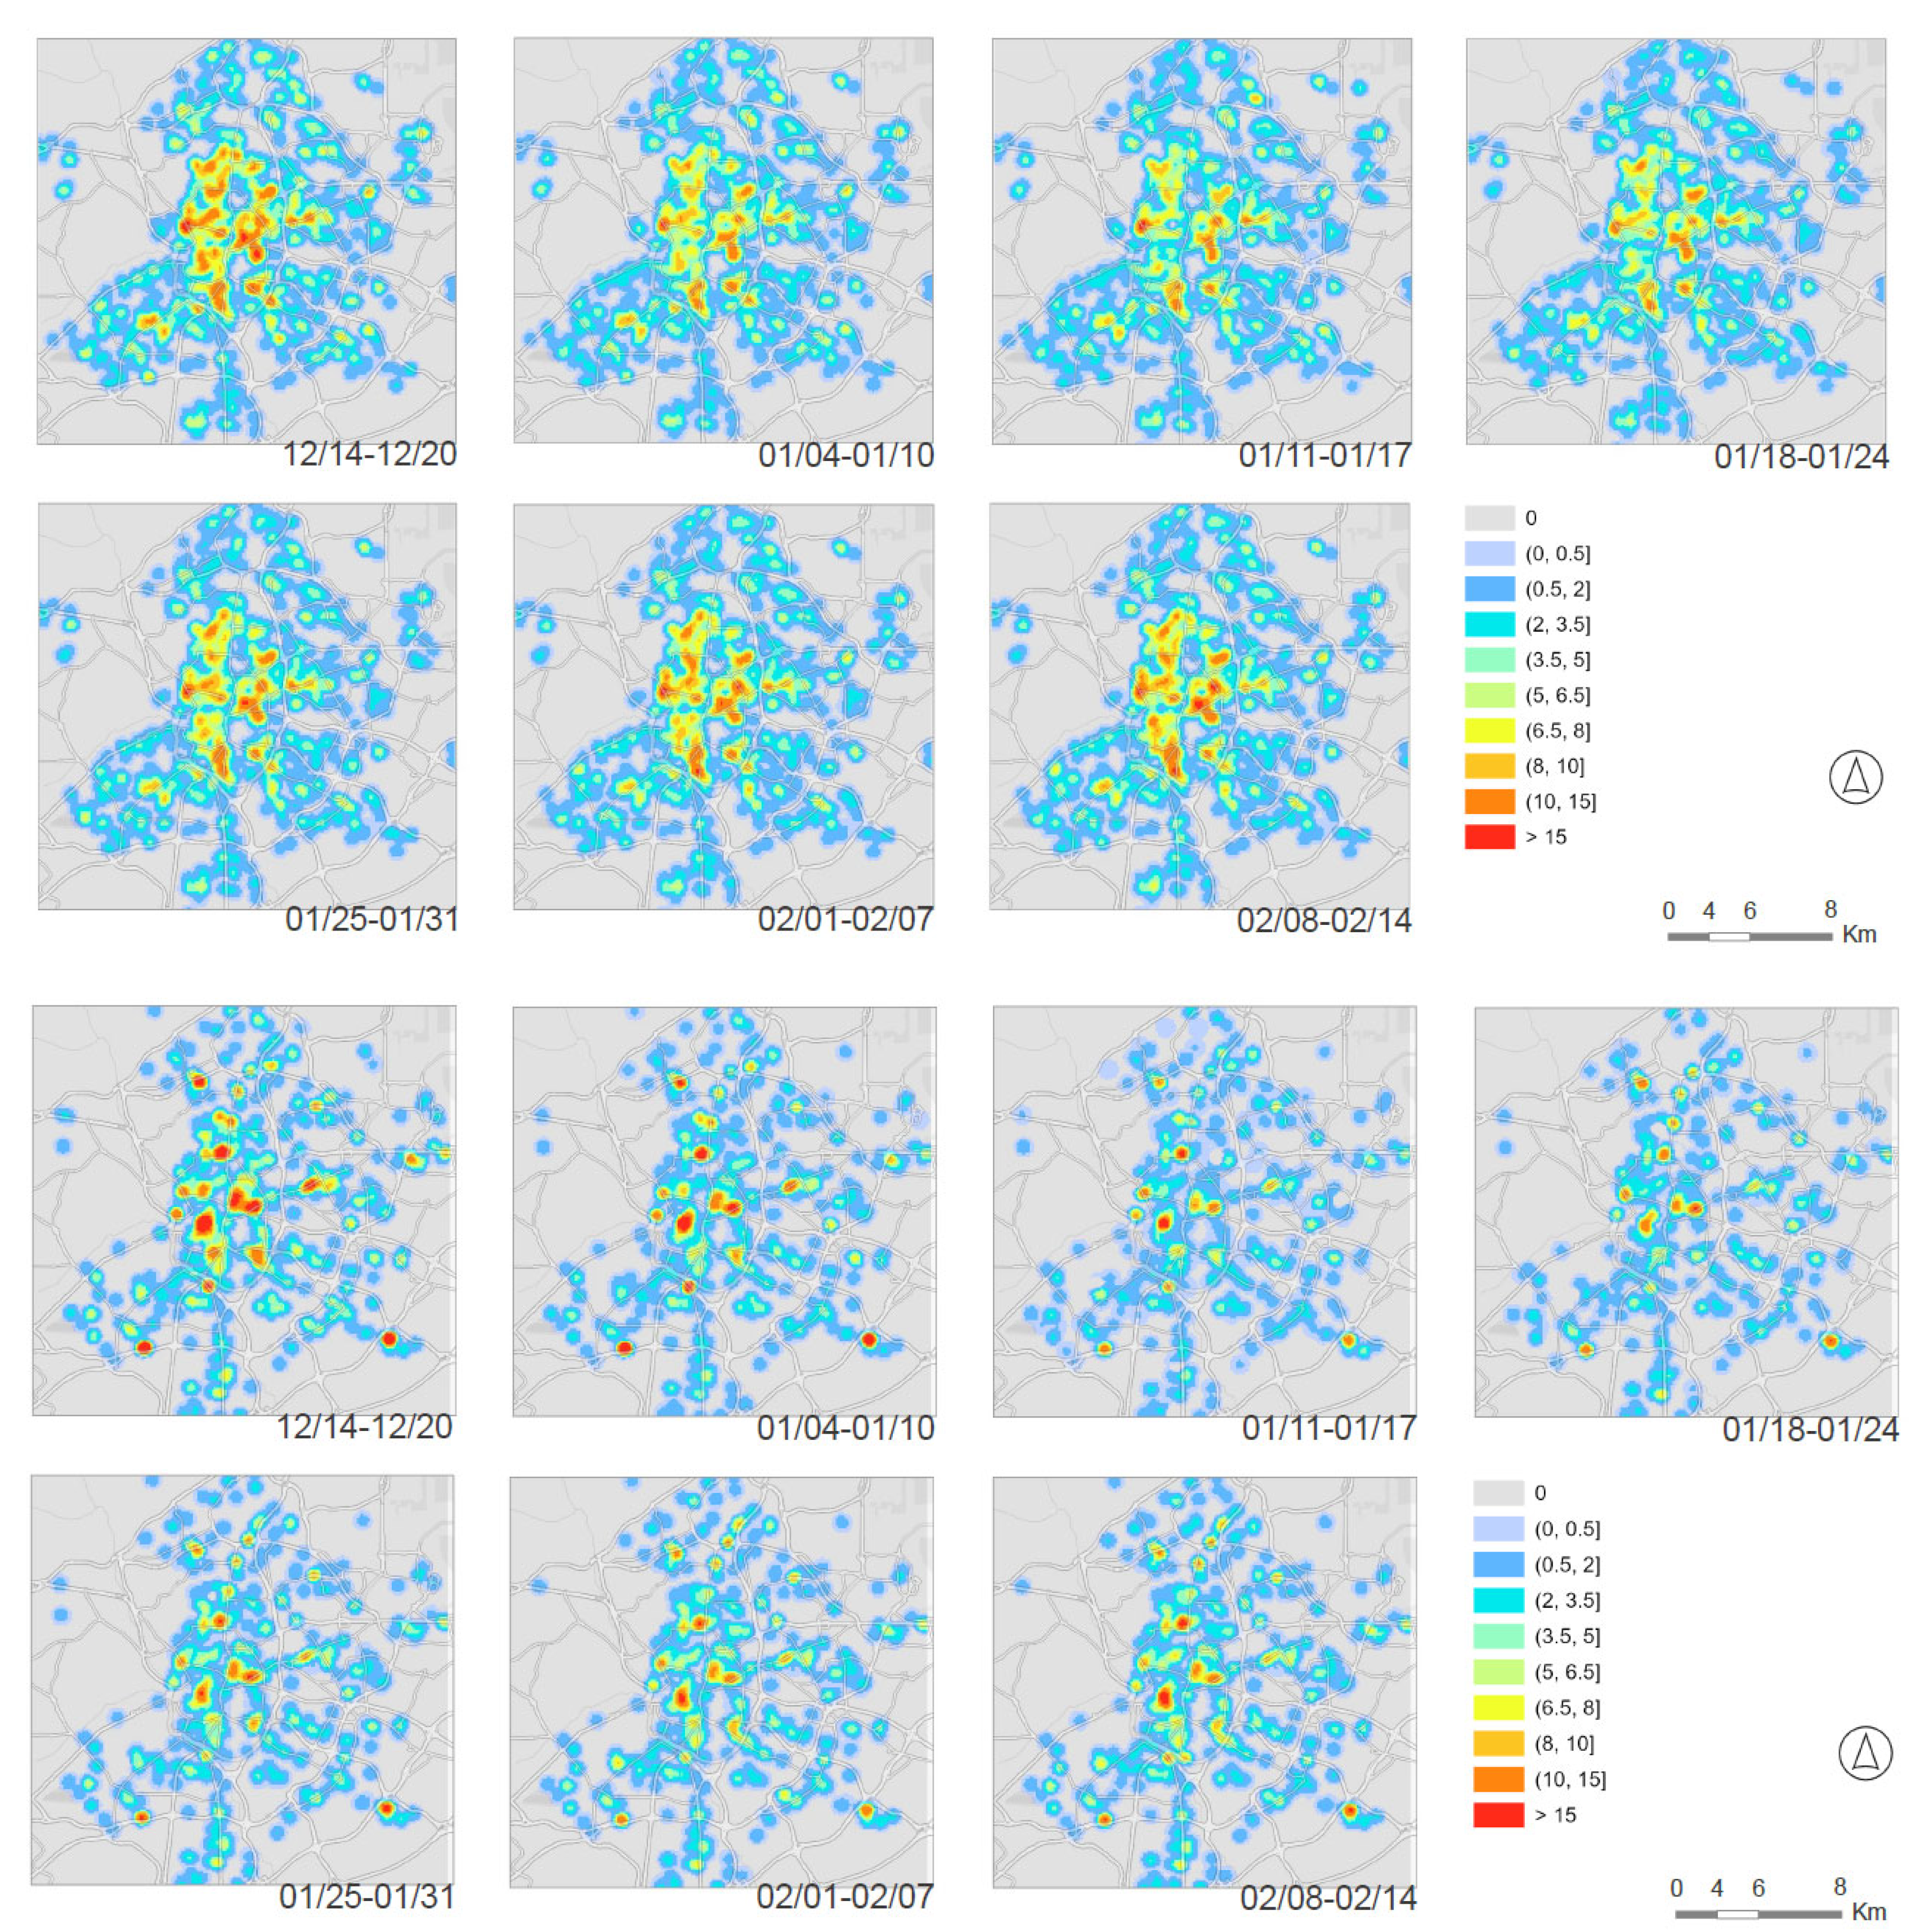
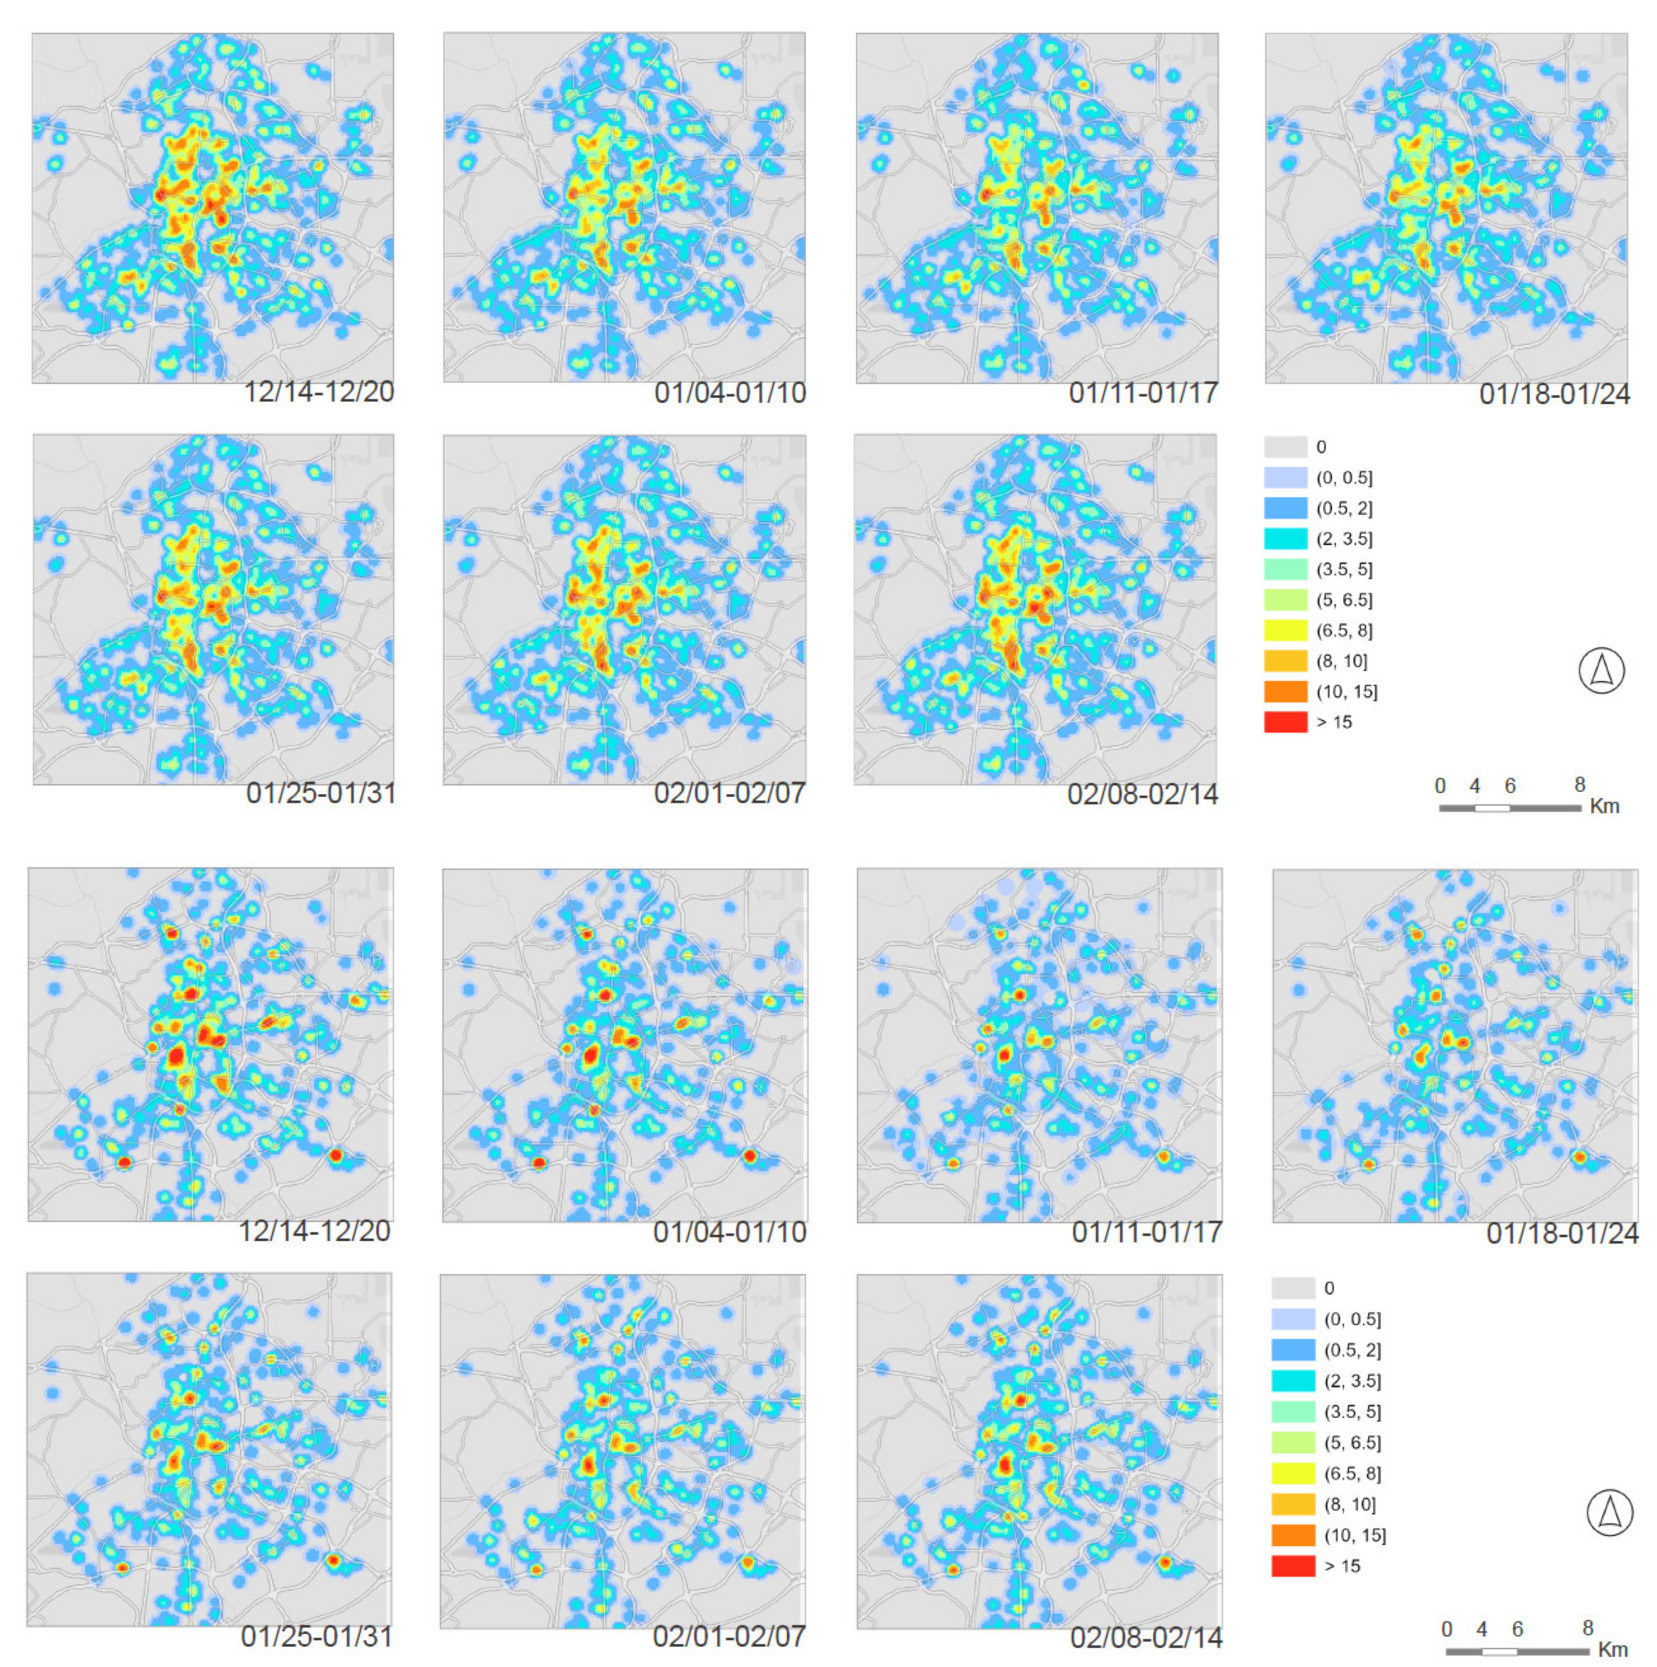
To analyze the impact of the snowfall on commercial activity, the densities of POIs that were live-streaming on the Google website during the study period were calculated. These POIs refer to stores where real-time occupancy could be observed. These densities were further weighted based on the live-streamed occupancy for the two categories (Fig.1).

Figure 1
Figure 1.Kernel densities of the number of POI/Ha broadcasting live weighted by the average occupancy of the “Shopping-basic” category at the top and “Shopping-leisure” at the bottom, for each of the weeks in the 2020-2021 period.

Source: Own elaboration from Google Places – Google Popular Times.

The economic component was obtained by downloading the data corresponding to the average household income in the neighborhoods of the municipality of Madrid from the National Institute of Statistics of Spain. Madrid consists of 131 neighborhoods that offer vibrant and diverse internal dynamics, enabling residents to engage in social interactions and participate in cultural, commercial, and social endeavors. We proceeded to classify the neighborhoods into clusters, taking into account the distance to the center and the average household income. This classification resulted in five distinct groups. To note is that Madrid lends itself for our case study because of its high socio-economic segregation (Leal and Sorando 2017; Musterd et al. 2017) and the diversity of commercial environments (Carpio-Pinedo 2020; Carpio-Pinedo et al. 2022; Carpio-Pinedo and Gutiérrez 2020).

3. Findings

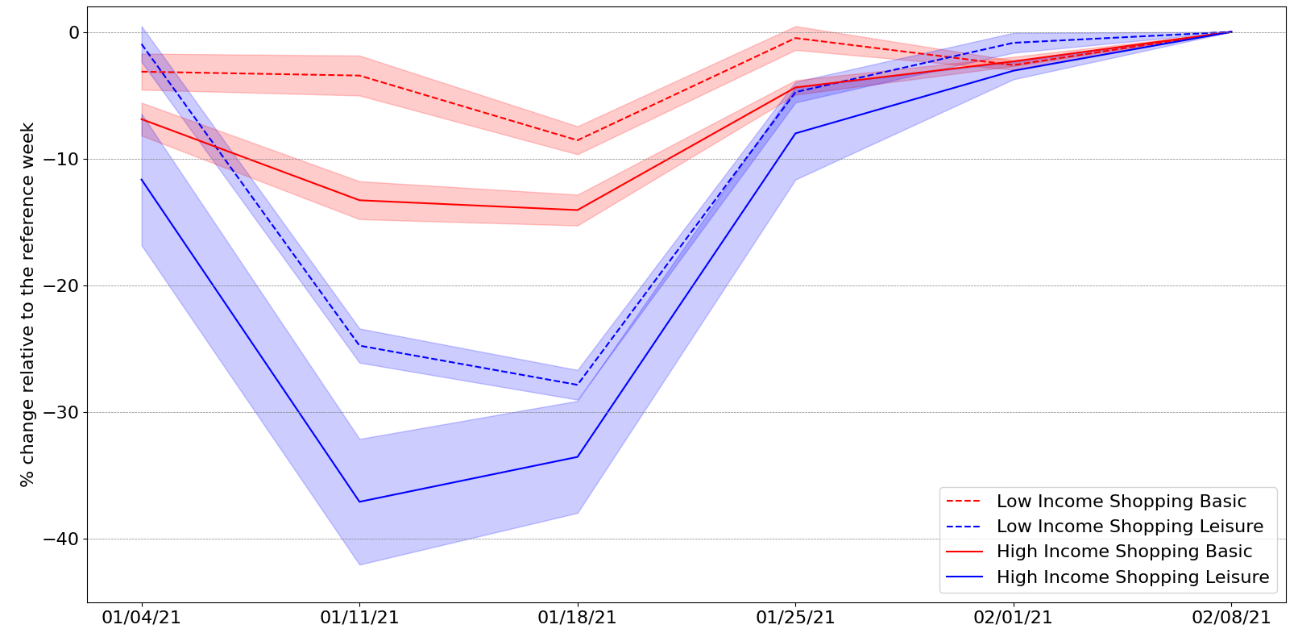
We have separated the temporal evolution of neighborhoods with the lowest (LI) and highest income (HI), using the second week of February as a reference and examining the change in activity in the Shopping-Leisure and Shopping-Basic categories (Fig. 2).

Figure 2
Figure 2.Temporal evolution and its standard error of the activity compared with second week of February for low-income (LI) and high-income (HI) neighborhoods

The difference in reduction of basic and leisure shopping can be clearly seen. Further, it can be observed that there are significant differences in the impact between high-income and low-income neighborhoods. In the week following the event, high-income neighborhoods experience a decline of 13.29% and 37.09% in shopping basic and shopping leisure activities, respectively, which is 9.84% and 12.32% higher than low-income neighborhoods..

Based on these findings, it can be concluded that more vulnerable groups have, as hypothesized, less adaptive capacity and are unable to afford to halt their daily activities in response to such climatic events. Consequently, there is a lower reduction in commercial activities in these neighborhoods, in contrast to high-income neighborhoods where individuals have the option to stay at home and wait for the storm to pass. We hence suggest that the “reverse interpretation of the resilience triangle” can be indeed considered as an index to define demand adaptability. Further studies should develop this approach.


ACKNOWLEDGEMENTS

This publication is part of the DARUMA R+D+i project (PCI2020-120706-2/AEI/10.13039/501100011033/). This work was also supported by the EIG CONCERT-Japan DARUMA project, Grant Number JPMJSC20C4 funded by JST SICORP, Japan.

Submitted: May 31, 2023 AEST

Accepted: August 29, 2023 AEST

References

Capponi, Andrea, Piergiorgio Vitello, Claudio Fiandrino, Guido Cantelmo, Dzmitry Kliazovich, Ulrich Sorger, and Pascal Bouvry. 2019. “Crowdsensed Data Learning-Driven Prediction of Local Businesses Attractiveness in Smart Cities.” 2019 IEEE Symposium on Computers and Communications (ISCC), 1–6. https:/​/​doi.org/​10.1109/​iscc47284.2019.8969771.
Google Scholar
Carpio-Pinedo, José. 2020. “Spaces of Consumption in the Mobile Metropolis: Symbolic Capital, Multi-Accessibility and Spatial Conditions for Social Interaction.” Universidad Politécnica de Madrid. https:/​/​doi.org/​10.20868/​upm.thesis.65613.
Carpio-Pinedo, José, and Javier Gutiérrez. 2020. “Consumption and Symbolic Capital in the Metropolitan Space: Integrating ‘Old’ Retail Data Sources with Social Big Data.” Cities 106:102859. https:/​/​doi.org/​10.1016/​j.cities.2020.102859.
Google Scholar
Carpio-Pinedo, José, Gustavo Romanillos, Daniel Aparicio, María Soledad Hernández Martín-Caro, Juan Carlos García-Palomares, and Javier Gutiérrez. 2022. “Towards a New Urban Geography of Expenditure: Using Bank Card Transactions Data to Analyze Multi-Sector Spatiotemporal Distributions.” Cities 131:103894. https:/​/​doi.org/​10.1016/​j.cities.2022.103894.
Google Scholar
Cimellaro, Gian Paolo, Andrei M. Reinhorn, and Michel Bruneau. 2010. “Framework for Analytical Quantification of Disaster Resilience.” Engineering Structures 32 (11): 3639–49. https:/​/​doi.org/​10.1016/​j.engstruct.2010.08.008.
Google Scholar
Ganin, Alexander A., Maksim Kitsak, Dayton Marchese, Jeffrey M. Keisler, Thomas Seager, and Igor Linkov. 2017. “Resilience and Efficiency in Transportation Networks.” Science Advances 3 (12): 1–9. https:/​/​doi.org/​10.1126/​sciadv.1701079.
Google ScholarPubMed CentralPubMed
Hong, Boyeong, Bartosz J. Bonczak, Arpit Gupta, and Constantine E. Kontokosta. 2021. “Measuring Inequality in Community Resilience to Natural Disasters Using Large-Scale Mobility Data.” Nature Communications 12 (1). https:/​/​doi.org/​10.1038/​s41467-021-22160-w.
Google ScholarPubMed CentralPubMed
Hosseini, Seyedmohsen, Dmitry Ivanov, and Alexandre Dolgui. 2019. “Review of Quantitative Methods for Supply Chain Resilience Analysis.” Transportation Research Part E: Logistics and Transportation Review 125 (March): 285–307. https:/​/​doi.org/​10.1016/​j.tre.2019.03.001.
Google Scholar
Leal, Jesús, and Daniel Sorando. 2017. “Economic Crisis, Social Change and Segregation Processes in Madrid.” In Socio-Economic Segregation in European Capital Cities, edited by Tiit Tammaru, Maarten van Ham, Szymon Marcińczak, and Sako Musterd. London: Routledge.
Google Scholar
Mahajan, Vishal, Guido Cantelmo, and Constantinos Antoniou. 2021. “Explaining Demand Patterns during COVID-19 Using Opportunistic Data: A Case Study of the City of Munich.” European Transport Research Review 13 (1). https:/​/​doi.org/​10.1186/​s12544-021-00485-3.
Google ScholarPubMed Central
Mudigonda, Sandeep, Kaan Ozbay, and Bekir Bartin. 2019. “Evaluating the Resilience and Recovery of Public Transit System Using Big Data: Case Study from New Jersey.” Journal of Transportation Safety & Security 11 (5): 491–519. https:/​/​doi.org/​10.1080/​19439962.2018.1436105.
Google Scholar
Musterd, Sako, Szymon Marcińczak, Maarten van Ham, and Tiit Tammaru. 2017. “Socioeconomic Segregation in European Capital Cities. Increasing Separation between Poor and Rich.” Urban Geography 38 (7): 1062–83. https:/​/​doi.org/​10.1080/​02723638.2016.1228371.
Google Scholar
Shekarian, Mansoor, and Mahour Mellat Parast. 2021. “An Integrative Approach to Supply Chain Disruption Risk and Resilience Management: A Literature Review.” International Journal of Logistics Research and Applications 24 (5): 427–55. https:/​/​doi.org/​10.1080/​13675567.2020.1763935.
Google Scholar
Vongvanich, Teethat, Wenzhe Sun, and Jan-Dirk Schmöcker. 2023. “Explaining and Predicting Station Demand Patterns Using Google Popular Times Data.” Data Science for Transportation 5 (2). https:/​/​doi.org/​10.1007/​s42421-023-00072-z.
Google Scholar

This website uses cookies

We use cookies to enhance your experience and support COUNTER Metrics for transparent reporting of readership statistics. Cookie data is not sold to third parties or used for marketing purposes.

Powered by Scholastica, the modern academic journal management system