1. Questions
Volunteering occurs when an individual donates their time to assist others (Omoto and Packard 2016). It generates a range of benefits, including improved health and psychological well-being for volunteers and greater social integration and social capital in local communities (Piliavin and Siegl 2007; Putnam 1995; Saja et al. 2018; Chadwick and Fadel 2020).
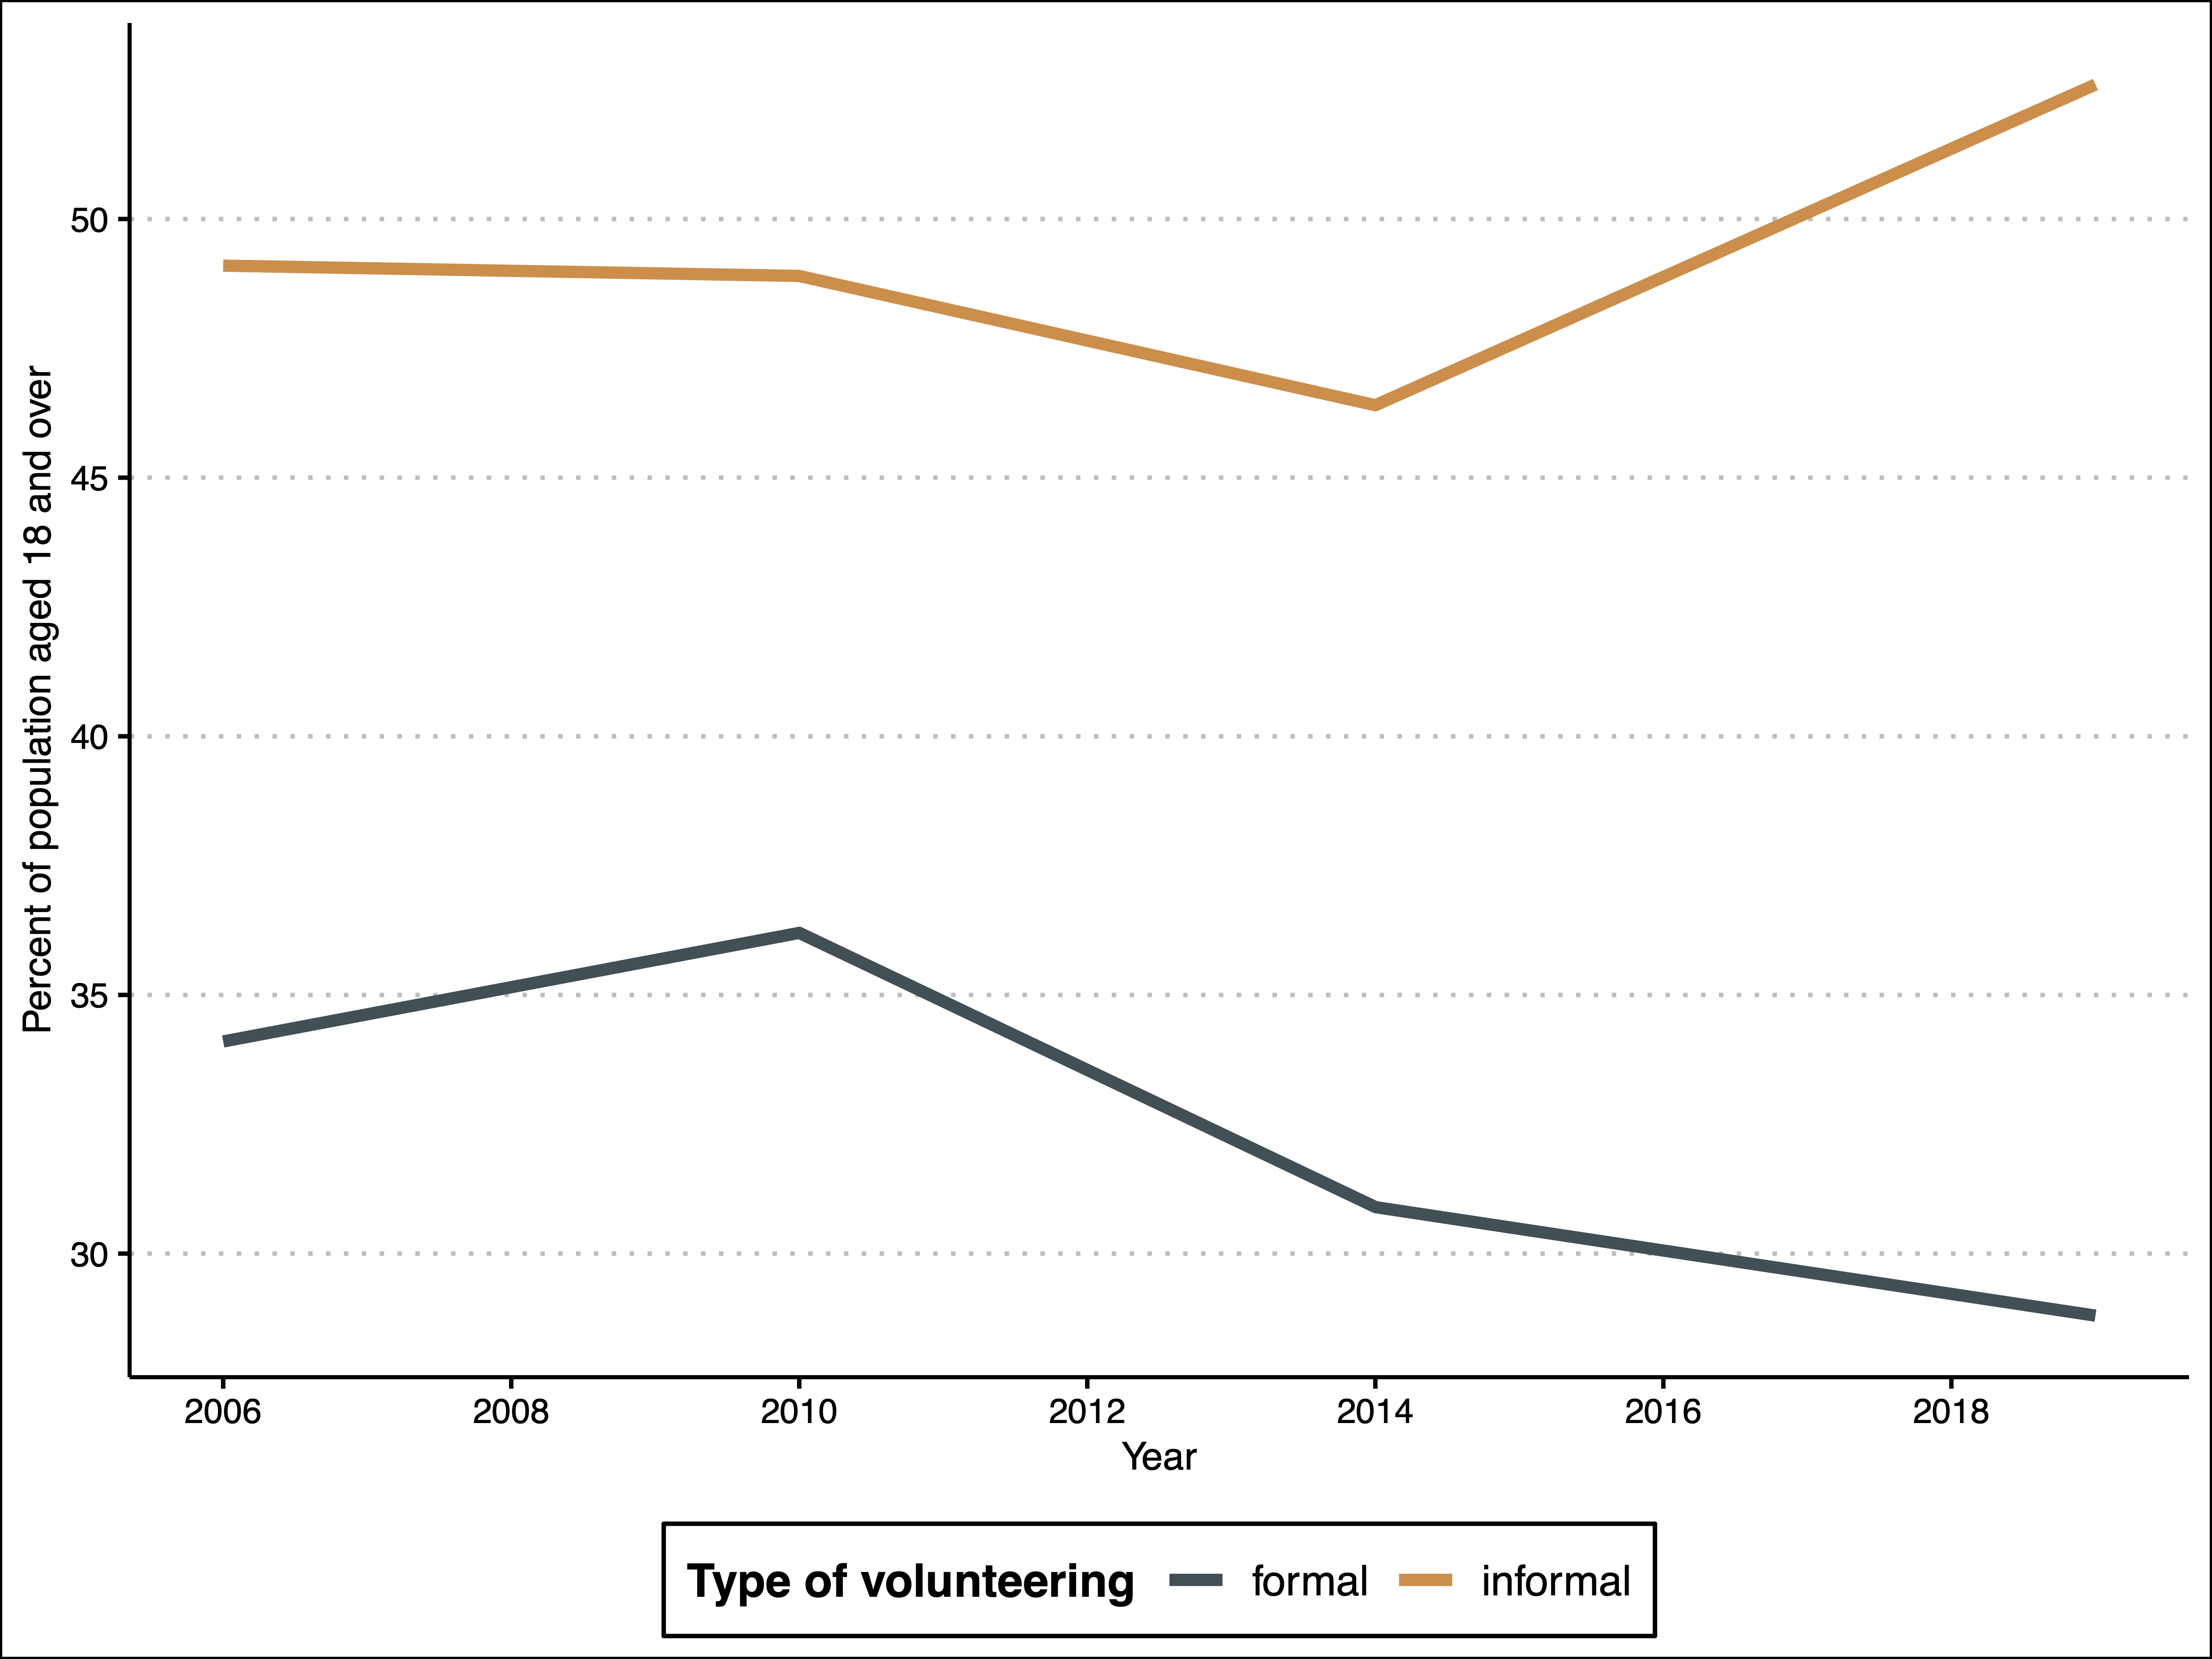
Volunteering can be both formal and informal (Lee and Brudney 2012). Formal volunteering is structured and organized (e.g. being a member of a volunteer fire brigade or animal rescue organization). In contrast, informal volunteering is more ad hoc (e.g. helping out at a school fair or assisting a neighbor). Formal volunteering typically requires a higher level of commitment than informal volunteering (Zappalà 2000). Figure 1 shows that between 2006 and 2010, 34% to 36% of Australians aged 18 and over reported volunteering through an organization in the previous 12 months (Australian Institute of Health and Welfare 2021). By 2019, this proportion had decreased to 29%. The proportion of people engaged in informal volunteering increased from 49% in 2006 to 53% in 2019. These trends suggest people are shifting from formal volunteering to informal volunteering, perhaps due to increasing time constraints (McLennan, Whittaker, and Handmer 2015).

The goal of our study is to determine whether the amount of time workers spend commuting materially affects their volunteering levels. Specifically, we test the hypothesis that workers who travel longer commute distances have lower volunteering rates (where commute distance is a proxy for time spent commuting). To test this hypothesis, we use spatially aggregated census data to quantify the relationship between workers’ commute distances and volunteering rates across the Greater Sydney Region, Australia.
2. Methods
2.1. Data
For the 2016 census, the Australian Bureau of Statistics (ABS) collected data on individuals’ place of residence, place of work, employment status, and volunteering activity (Australian Bureau of Statistics 2016a, 2016b). The finest level of spatial aggregation at which the ABS publishes these census data is Statistical Area 2 (SA2), which typically represents a suburb or town containing between 3,000 and 25,000 individuals (Australian Bureau of Statistics 2021). We used these data to compute the following spatially aggregated variables for the workers that live in SA2 and work in SA2 for each SA2 pair :
-
The number of full-time workers
-
The number of full-time workers who volunteer
-
The number of part-time workers
-
The number of part-time workers who volunteer
We then computed the approximate commute distance between each pair of SA2s as the distance between their centroids.
2.2. Models
Since volunteering levels are represented by counts of volunteers, we used negative binomial regression models to estimate the relationship between commute distance and volunteering level. We fitted these models to the spatially aggregated data on employment and volunteering described in the previous section.
Each observation in the spatially aggregated data we modeled relates to a group of workers that live in the th SA2 and work in the th SA2. The full data set covers all SA2 pairs in the region, where We excluded observations where workers have the same home and work SA2 – our method assigns them a commute distance of zero and therefore does not capture within-home SA2 variation in commute distance.
We modeled full-time workers separately from part-time workers to isolate the effect of commute distance on volunteering. Pooling full-time and part-time workers together in the same model makes it difficult to separate the effect of part-time work on volunteering from the effect of commute distance on volunteering. This difficulty arises because part-time workers tend to have higher volunteering rates (likely due to having more spare time) and shorter commute distances (see Table 1). As a result, SA2 pairs with a large proportion of part-time workers tend to have shorter commute distances and higher volunteering rates (Table 1), which leads to multicollinearity in the regression model and unreliable estimates.
To estimate the effect of commute distance on volunteering levels, we fitted the following negative binomial regression model to data for the Greater Sydney Region data:
log(E[Yij])=β0+β1Dij+β2Vi+log(Zij)
where:
-
The response variable is the count of full-time (or part-time) working volunteers that live in SA2 and work in SA2
-
The predictor of interest is the commute distance between SA2s and
-
is the proportion of non-workers in the th SA2 that volunteer, based on census data
-
is the count of full-time or part-time workers that live in SA2 and work in SA2
In this model, the estimate of shows the effect of commute distance on the volunteering rate, conditional on being held constant. Since the availability of volunteering opportunities near home is likely a driver of a worker’s decision to volunteer, we wanted to control for this factor in the model. Due to the lack of available data on volunteering opportunities, we used as a proxy for volunteering opportunities in the th SA2 on the assumption that the proportion of non-workers that volunteer is positively correlated with the availability of volunteering opportunities across the SA2s.
Our SA2 pairs have varying numbers of people working full-time (or part-time). We included the offset term log in our models to account for this difference. This adjustment allows us to focus on volunteering rates instead of just the total number of volunteers. Using an offset term like this is a standard method when dealing with count data (like the number of volunteers) for groups that are not all the same size (Gagnon et al. 2008; Loomis 2005).
3. Results
Table 1 provides descriptive statistics for the Greater Sydney Region. Part-time workers have shorter average commute distances and higher volunteering rates than full-time workers. The table also shows that there is a reasonable degree of variation in workers’ commute distances. Our model relies on this variation to estimate the effect of commute distances on volunteering levels.
Note we fitted separate models for full-time and part-time workers. For each worker type, we fitted three models: a model that uses the full data set on commuting between all SA2 pairs, a model that uses a reduced data set on commuting to the city centre (which accounts for 19.9% and 11.6% of full-time and part-time workers respectively that commute to outside of their home SA2), and a model that uses a reduced data set on commuting to outside the city centre. Here, we define the city centre as the SA2 labeled Sydney-Haymarket-The Rocks. These models provide information on the relationship between commute distance and volunteering rates for different types of commuters.
Table 2 provides the regression estimates for all six models. For Models 1 to 4 and 6, the estimated coefficient of commute distance is negative and statistically significant, indicating that greater commute distances are associated with lower volunteering rates for both full-time and part-time workers across Greater Sydney. The exception is Model 5 for part-time workers who commute to the city centre. This model indicates no relationship between commute distance and volunteering rate. Table 2 also shows that is positive and statistically significant in all models, indicating that greater availability of volunteering opportunities (based on the proxy increases the volunteering rates of workers, as expected.
Table 3 shows the estimated effect of a 1km decrease in commute distance on the level of volunteering for each model (the 95% confidence intervals are shown in parentheses). Based on the models that use the full data set on commuting between all SA2 pairs (models 1 and 4), we see that a 1km decrease in commute distance is associated with 1.0% and 1.7% increases in the numbers of full-time and part-time workers respectively that volunteer. The results for the other models show that the effect of commute distance on volunteering is much larger for workers that commute to locations outside the city center than for workers that commute to the city center.
4. Findings
Our modeling indicates that, after controlling for spatial variation in the availability of volunteering opportunities, longer commute distances tend to reduce the volunteering rates of full-time and part-time workers, particularly for workers commuting to locations outside the city centre. We repeated our analysis for the greater Melbourne and Brisbane regions to confirm this finding. Our results for these two other regions confirm what we see in the Greater Sydney Region: Marginal constraints on workers’ spare time, such as commute time, affect their volunteering behavior.
Our results imply that policies affecting workers’ commute time are likely to impact social capital and workers’ well-being. For example, employers’ policies regarding working from home can shape workers’ volunteering behavior, with implications for workers’ health and well-being and social capital in their local communities. Policies regarding the location of industrial, commercial, and residential precincts and the transport systems connecting them have similar implications.
This study has limitations. First, since data on workers’ commute times are unavailable, we use commute distance as a proxy for commuting time. While commute distance is likely to be highly correlated with commute time, data on actual workers’ commute times would enable direct modeling of the relationship of interest. Data on actual worker’s commute times should also account for different modes of commuting, e.g., commuting by car, train, or bicycle. Second, our use of spatially aggregated data on workers’ volunteering rates and commute distances limits the variation in both variables. Individual-level data would provide greater variation and enable more precise estimates of the effect of commute distance or time on volunteering. Individual-level data would also enable the model to capture the effect of within-SA2 commute distance on volunteering rates. Further work addressing these limitations of our study would likely improve our understanding of the link between commute times and volunteering.