
1. Questions
The accurate prediction of electricity consumption is important to allocate resources more effectively, for example between power plants, transmission lines, and fuel supplies (Derrible 2019). In addition, it can help providers manage infrastructure and supply costs. The role consumer’ behavior plays is critical to understand the nature of electricity consumption patterns, which can ultimately be useful to plan, design, and implement electricity efficiency policies. Using data from ComEd, Chicago’s primary provider, we ask: how do people consume electricity in the Chicago area? Are there patterns, if so, can they be identified and explained?
2. Methods
Our study area focuses on northeastern Illinois, comprising the Chicago region within the state of Illinois and periurban areas (see map in Figure 1), which is the area served by ComEd (the sole electric provider in the region). We use electricity consumption data from 2019, the most recent available data before the Covid-19 pandemic. The data contain electricity consumption at the zip code level in 30-minute intervals for the entire year. In addition, we used demographic census data from the Census Bureau, also aggregated by zip code.

Using this dataset, we extracted data for January 30, 2019. From this, we obtained a normalized electricity consumption time series for each of the 466 available zip codes. We used Self Organizing Maps (SOM) time series clustering to identify clusters showing similar consumption patterns and used a silhouette curve to determine the best number of clusters, which resulted in 6 clusters.
Once each zone was assigned to a consumption cluster, we implemented Gradient Boosting Machine (GBM) (Chen and Guestrin 2016) to model the assigned cluster as a target class (i.e., dependent variable) using travel times obtained from the Census Bureau as an explanatory variable. The Census Bureau data contains the number of people whose commute times to work are within specific ranges given in minutes and used certain travel mode at each zip code area. Specifically, we calculate the percentages of population within each range and mode with respect to the total population in each zone and then use these as the only predictors in the GBM model.
3. Findings
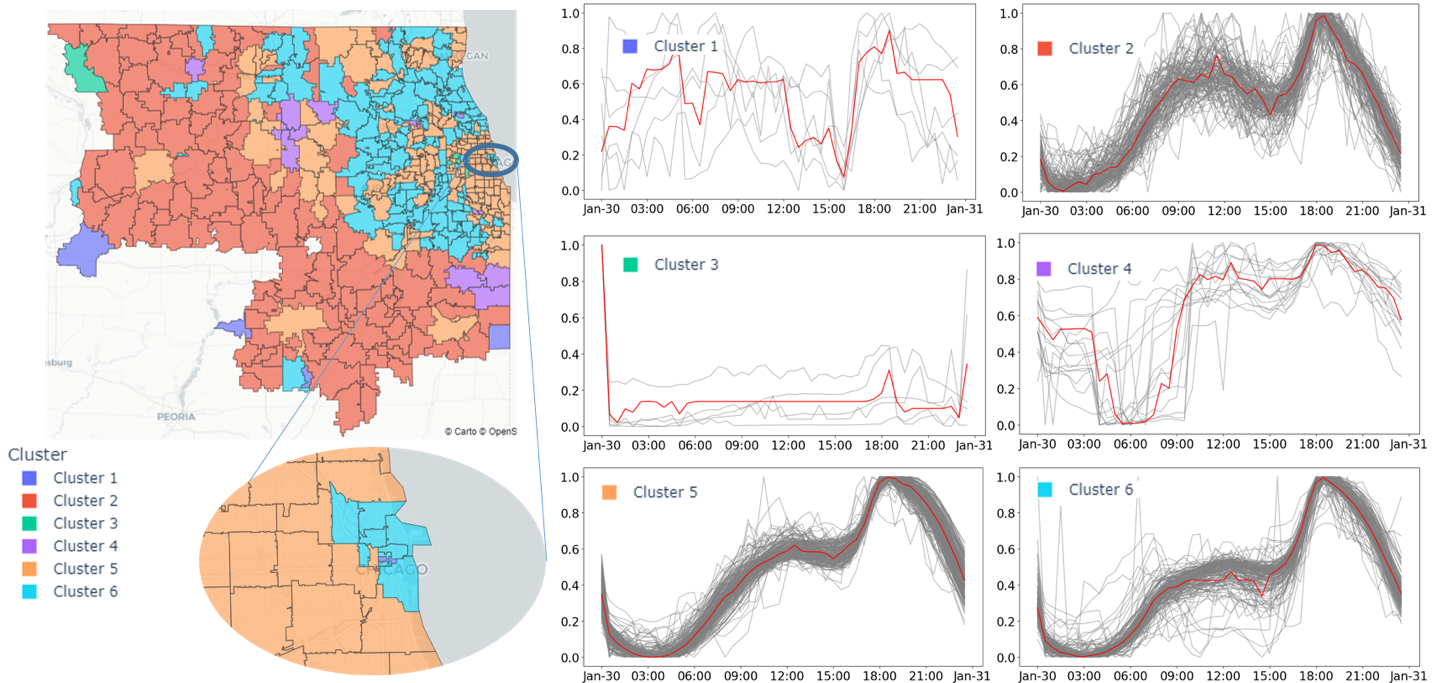
Figure 1 presents the results of the SOM clustering and the shape of the average consumption pattern in each cluster. We can see the emerging spatial aggregation, with in particular three important observations. First, cluster 2 includes suburban zip codes only. Second, cluster 5 predominantly includes urban zip codes. Third, cluster 6 strictly includes Chicago’s downtown core and the immediate vicinity of the city limits. These three clusters present similar consumptions patterns, and the difference between them cannot be overlooked. Cluster 2 has a higher morning peak around 11 am, followed by a steep drop in the afternoon hours. These two features are not present in clusters 5 and 6. Although subtle, the main difference between clusters 5 and 6 lies in the morning. Cluster 6 does not present a peak, but a flat, sustained consumption throughout the morning and until the afternoon. In contrast, cluster 5 presents a morning peak around noon, which is lower in magnitude than the morning peak of cluster 2 and higher that all consumption values in the morning curve of cluster 6.
The consumption patterns of clusters 1, 3, and 4 are completely different than the three other clusters discussed above. Cluster 1 shows a highly varying pattern with a clear drop during the afternoon hours. In contrast, cluster 4 shows a similar drop during the morning. Cluster 3 shows a sustained consumption values that increase at the end of the day. These three clusters have in common that they are all found exclusively in sparse suburban zones.
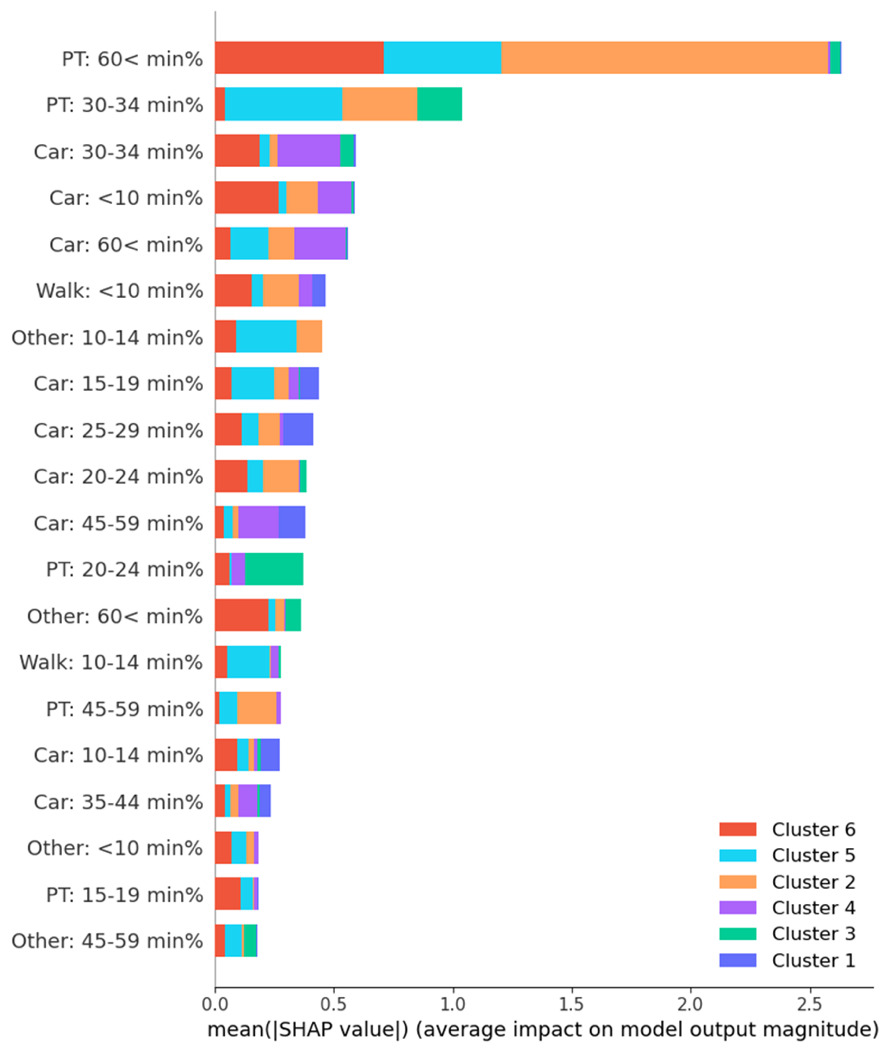
In order to explain the differences between these consumption patterns, using GBM, we modelled the cluster as a target class using commute times by mode percentages per zone as explanatory variables since consumption and traffic demand are interrelated (Movahedi and Derrible 2021). From this, we were able to obtain an estimation of the impact of each variable on each cluster thanks to SHapley Additive exPlanations (SHAP) (Lundberg and Lee 2017); results shown in Figure 2. Here we can see that the long public transport (PT) commute (over 60 minutes) variable has the highest impact on the model. This effect is especially important in clusters 2, 5, and 6, which means that the proportion of long PT trips is highly determinant in urban and suburban contexts in terms of electricity consumption, either by their presence or their absence.
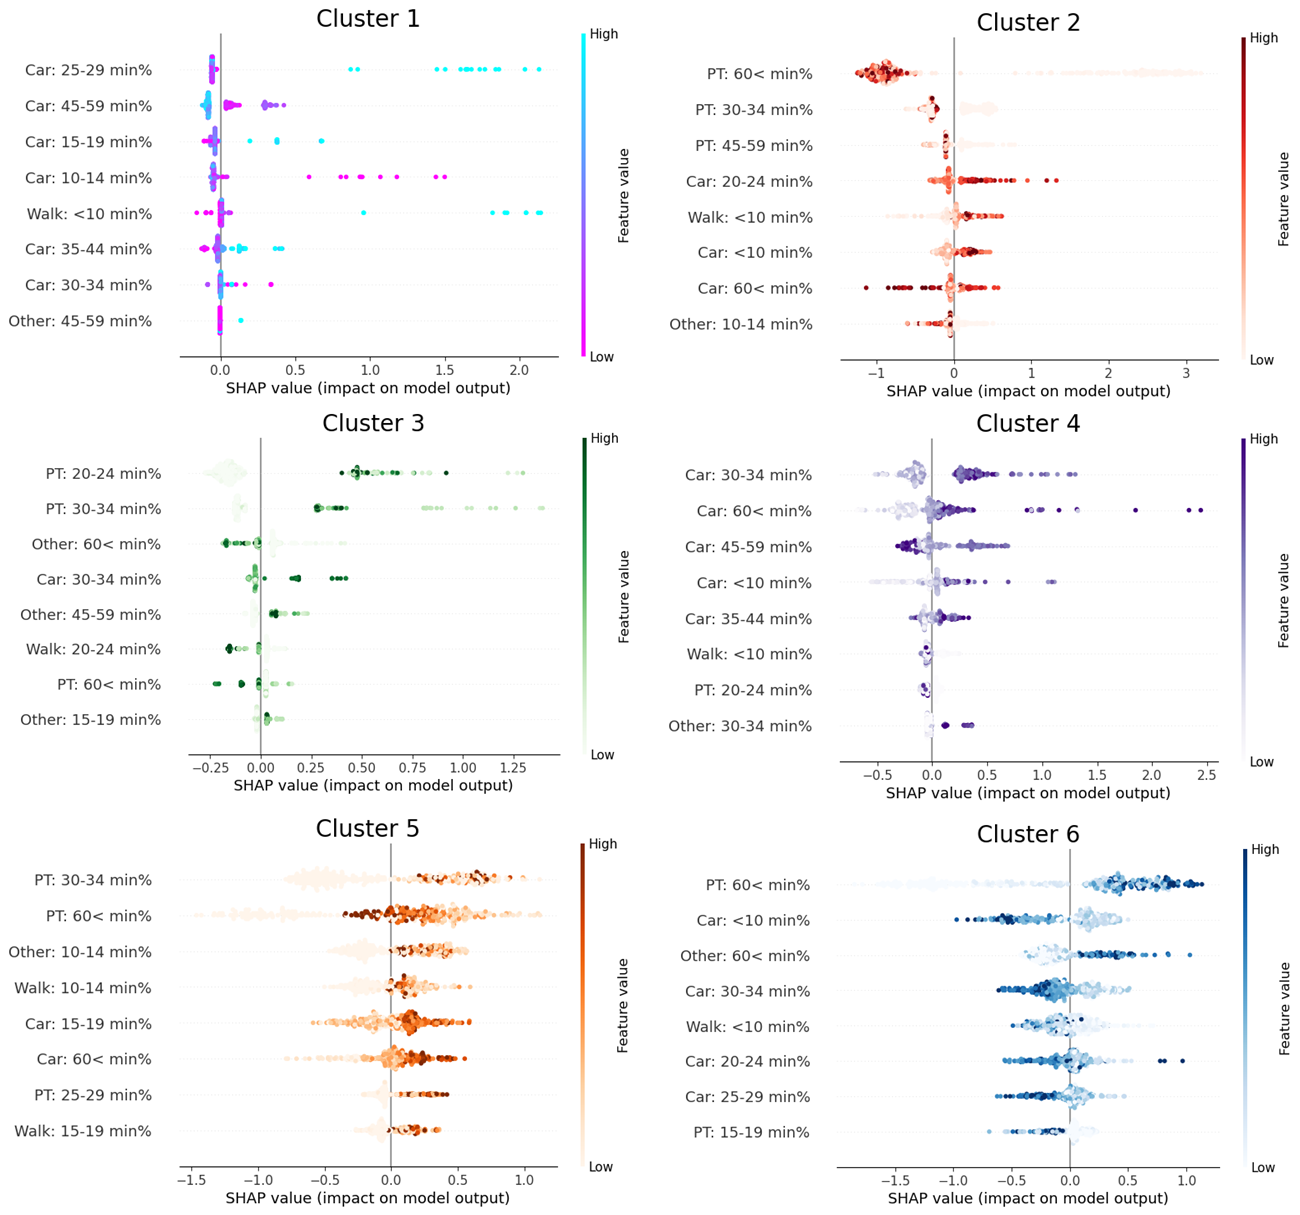
In order to understand this effect better, we built beeswarm plots (Figure 3) to display information-dense representations of the effect of each feature on each cluster. We can see that PT commutes have the highest impact on clusters 2, 3, and 5, which is consistent with Figure 2. We can also observe that a high presence of long PT commutes will decrease the likelihood of being classified in cluster 2 and will have the opposite effect on clusters 5 and 6. This means a high number of long-time PT commutes in an area decreases the chances of having a consumption pattern with a more pronounced morning peak, associated also with suburban areas. Another aspect worth pointing out is that the most relevant features in Cluster 1 are almost exclusively related to overall car usage and short walking trips.

In summary, the absence of long duration PT commutes in suburban and periurban areas is associated with more pronounced electricity consumption peaks, whereas a higher proportion of long duration commutes is associated with a flat morning electricity consumption pattern. The presence of interrelationships is in line with similar findings present in other utility sectors, including for the consumption of water and gas (Cordova et al. 2019; Movahedi et al. 2023).