
SUPPLEMENTAL INFORMATION
Supplemental information for this article is available at https://github.com/higgicd/Accessibility_Toolbox. This repository contains an interactive version of the Accessibility Toolbox article in R Notebook format, the Accessibility Calculator Python toolbox for ArcGIS, tool source code, and a sample accessibility analysis using data for New York City.
RESEARCH QUESTIONS AND HYPOTHESES
Accessibility can be defined as the potential for reaching spatially distributed opportunities while considering the difficulty involved in traveling to them (Páez, Scott, and Morency 2012). Several families of accessibility measures have been established since the pioneering work of Hansen (Hansen 1959), including infrastructure-based, person-based, place-based, and utility-based measures (Geurs and van Wee 2004). Of these, place-based measures are arguably the most common and can be operationalized as:
Ai=∑jOjf(tij)
where the accessibility of origin is the sum of all opportunities available at destinations weighted by some function of the travel time between and
Despite several decades of research into place-based accessibility, researchers, students, and practitioners interested in accessibility analysis face practical and empirical challenges. On the practical side, compared to simple isochrones, analyses of spatial interaction undertaken in the popular ArcGIS environment require many time-consuming and tedious steps. On the empirical side, questions persist over the selection of an impedance function and cost or cut-off parameters. Ideally, these statistical parameters should be derived from calibrated trip generation models; however, in the absence of such data, Kwan (Kwan 1998) argues that the use of customized functions and parameters based on theory is preferable to arbitrary assignment.
This article details a new Accessibility Toolbox for R and ArcGIS to promote a more convenient solution for accessibility analyses. The Python toolbox for ArcGIS simplifies the steps involved in a place-based accessibility workflow and comes coded with 5 impedance functions and 28 impedance measures for accessibility calculation. The interactive R Notebook version of this article visualizes the function families and specifications, allowing users to customize parameters of the ArcGIS tool’s Python code in accordance with theory and experience with their study area.
METHODS AND DATA
The accessibility toolbox implements the five different impedance functions from Kwan (1998):
- Inverse Power:
f(tij)={1 for tij<1t−βij otherwise
- Negative Exponential:
f(tij)=e(−βtij)
- Modified Gaussian:
f(tij)=e(−t2ij/β)
- Cumulative Opportunities Rectangular:
f(tij)={1 for tij≤¯t0 otherwise
- Cumulative Opportunities Linear:
f(tij)={(1−tij/¯t) for tij≤¯t0 otherwise
The inverse power, negative exponential, and modified Gaussian functions continuously discount the weight of opportunities as travel time increases using an impedance parameter that accounts for the cost of travel. With a foundation in early gravity models of spatial interaction (Stewart 1948; Zipf 1949), the inverse power function produces a rapid decline in the weight of opportunities as travel time increases. While power functions draw analogs to Newtonian physics, their theoretical relevance to human travel behavior has been questioned (Sen and Smith 1995). The negative exponential function is more gradual and based on its strong theoretical foundations in entropy maximization (Wilson 1971) and choice behavior theory (Fotheringham and O’Kelly 1989), this function appears to have become somewhat of a de facto standard in applied accessibility analysis. The modified Gaussian function exhibits a much more gradual rate of decline around its origin and a slower rate of decline overall. While Ingram (Ingram 1971) argues that these properties make the function superior to its inverse power and negative exponential counterparts for explaining observed travel behavior, it appears to be rarely used in the applied literature.
The cumulative rectangular function is an isochronic measure that applies a constant weight to all opportunities reachable within some travel time window whose maximum is defined by Although the application of a constant weight is contrary to the geographic principle of distance deterrence or decay that underpins travel behavior theory, such functions remain popular due to their ease of interpretation. Finally, the cumulative linear function is a hybrid of the continuous and cumulative approaches, linearly discounting opportunities within an isochrone.
This set of impedance functions is by no means exhaustive. Numerous alternatives have been proposed, such as the exponential–normal, exponential–square root, and log–normal functions reviewed by Reggiani, Bucci, & Russo (Reggiani, Bucci, and Russo 2010) and the Box-Cox, Tanner, and Richards functions reviewed by Martínez & Viegas (Martínez and Viegas 2013). Although these functions could be implemented in future iterations of the tool, the present article’s focus on the functions specified in Kwan (1998) introduces some of the most widely used measures of impedance in applied accessibility analysis.
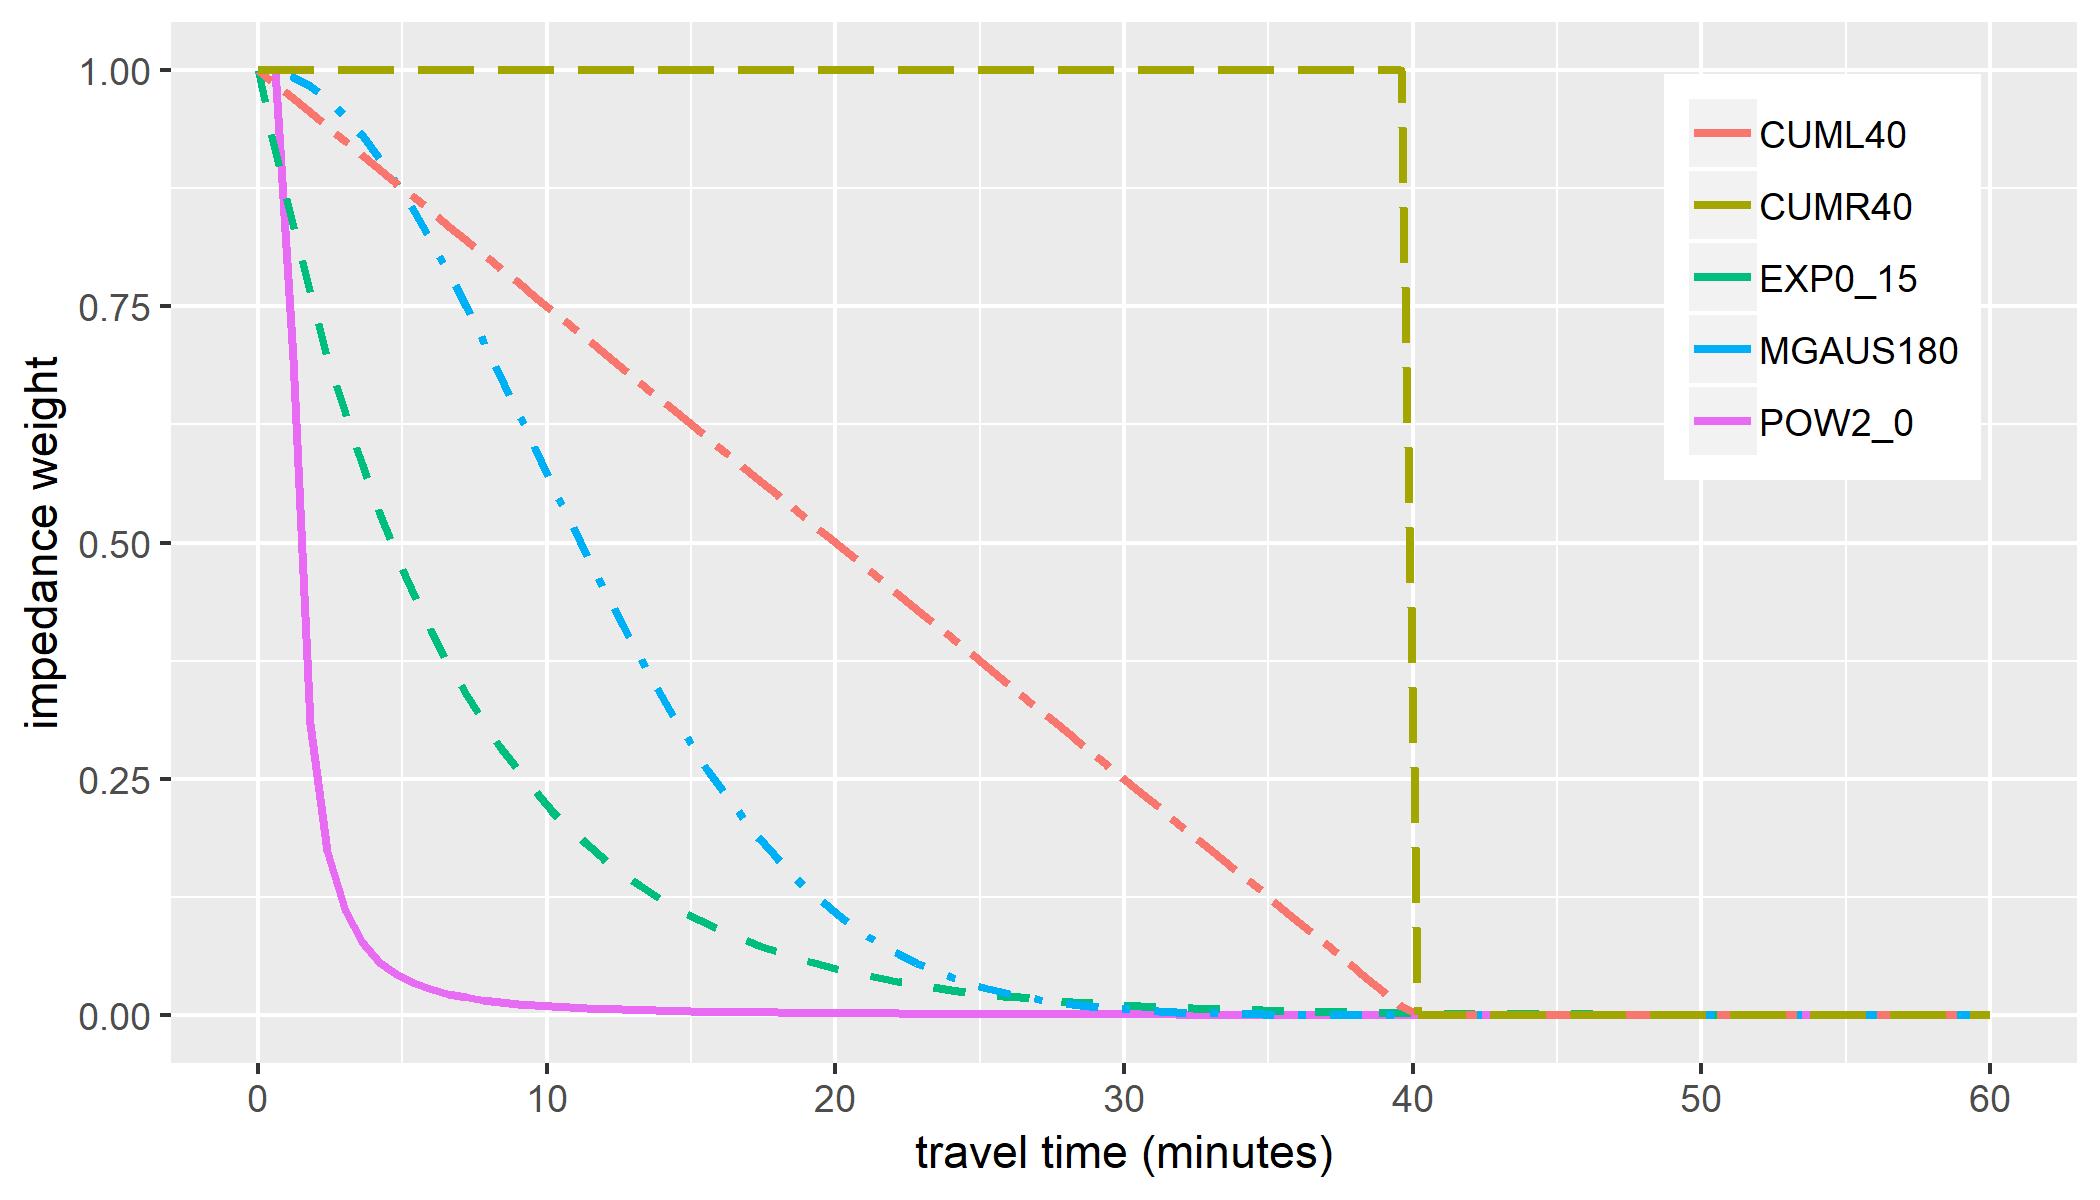
Kwan (1998) sets four impedance parameters for each continuous function designed to produce a weight of about 0.1 at travel times of 5, 10, 15, and 20 min respectively. Figure 1 recreates a figure from Kwan (1998) to visualize parameter values for the five functions: the inverse power function with (POW2_0), the negative exponential function with (EXP0_15), the modified Gaussian function with (MGAUS180), and the cumulative rectangular (CUMR40) and linear (CUML40) functions with set to 40 minutes.

Calculating place-based accessibility using the ArcGIS Python toolbox requires selecting a network dataset, cost attribute, and search cut-off travel time; one or more of the 28 impedance functions implemented in the tool (Table 1); input origins and destinations (point or polygon); and a numerical attribute representing destination opportunities. Two versions of the tool are included in the toolbox: the first outputs a single origin-destination matrix while the second segments origins into smaller batches and overwrites the origin-destination matrix across iterations to save memory and disk space for large analyses. In addition to Kwan’s impedance specifications (Kwan 1998), the toolbox also implements Handy & Niemeier’s negative exponential specification calibrated to walking trips for convenience shopping in Oakland, CA in 1980 (Handy and Niemeier 1997) and several additional popular cumulative rectangular measures. Full documentation for the tool can be found in the article’s supplemental information at https://github.com/higgicd/Accessibility_Toolbox.

FINDINGS
The batch version of the tool uses all 18 impedance measures from Kwan (Kwan 1998) to calculate walkable accessibility to employment reachable within 60 min from each of New York City’s 6,293 census block groups. The pedestrian street network was extracted using the OSMnx tool (Boeing 2017) with a walking speed of about 5 kph. Destinations are census block groups from the Smart Location Database (Ramsey and Bell 2014), with employment data from the US Census Bureau’s 2010 Longitudinal Employer–Household Dynamics dataset. Although useful for calculating job accessibility, one limitation of this dataset is that job totals may not reflect the physical location of an individual’s workplace, but rather the administrative address reported by their employer.
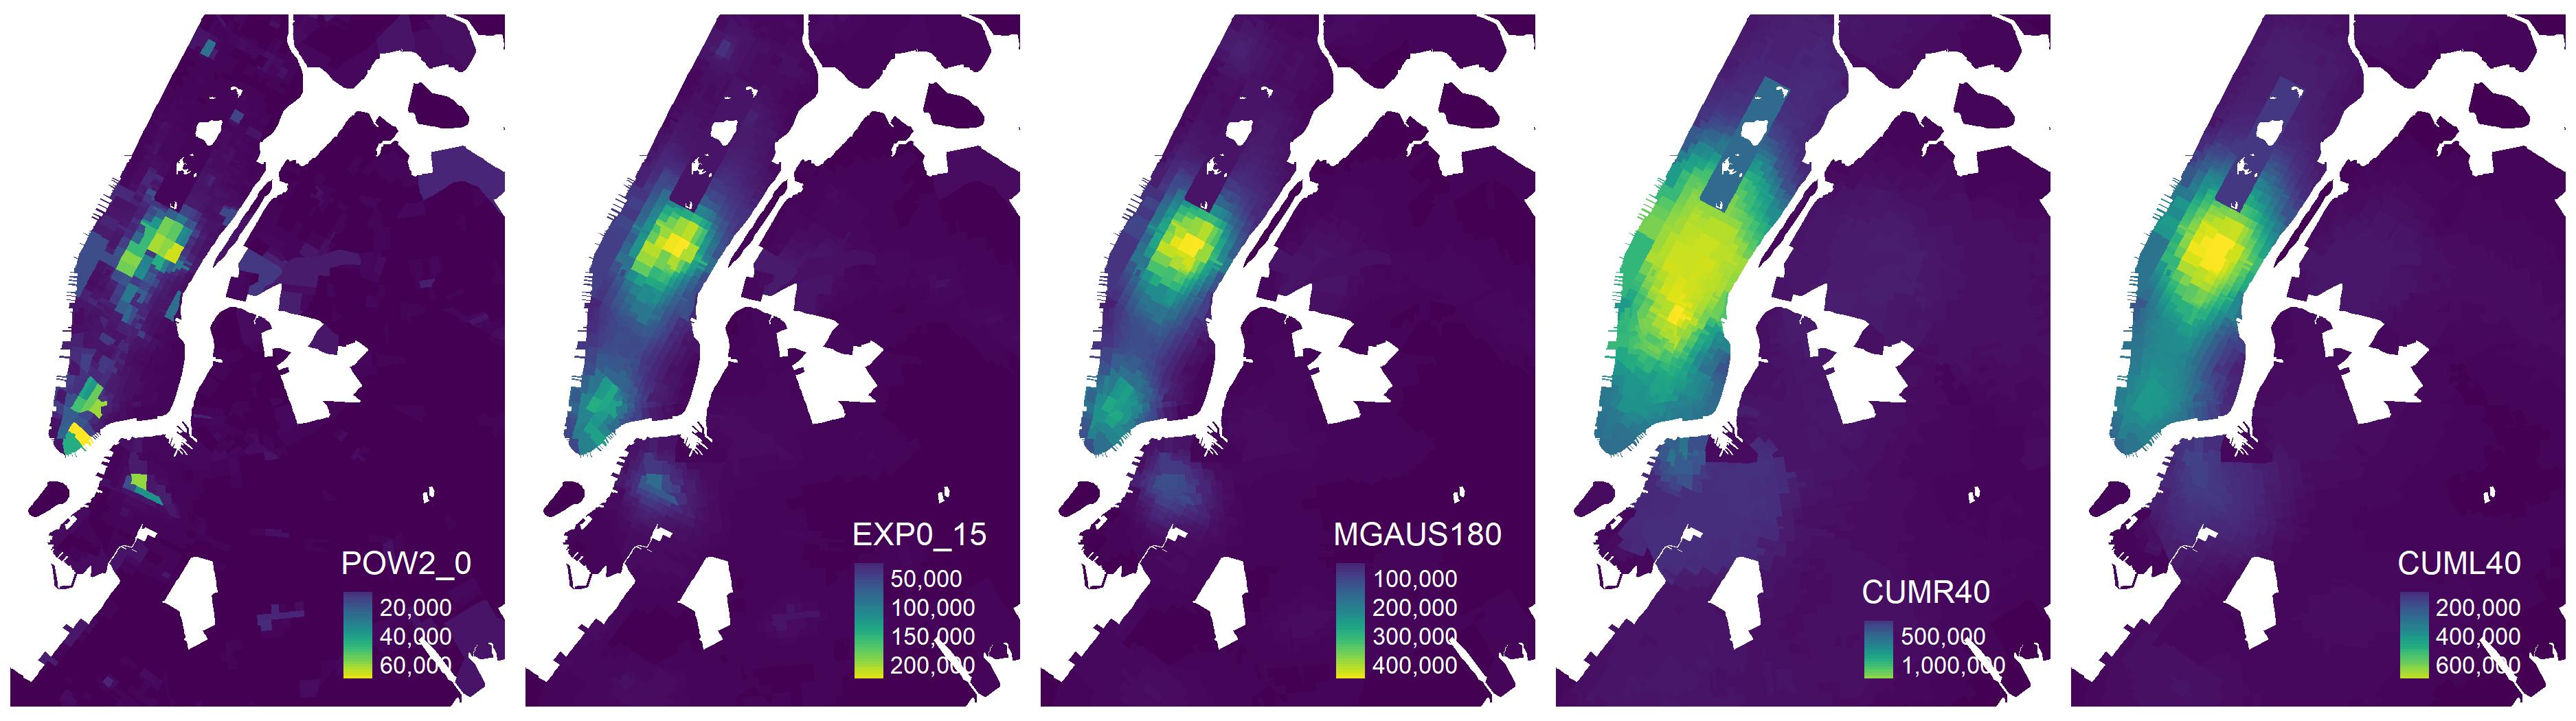
Figure 2 maps the results of the analysis for the five impedance function specifications in Figure 1. Each impedance measure produces differences in both the number of weighted jobs accessible within 60 min and the distribution of accessibility over space. The rapid decline in the POW2_0 measure places a significant discount on jobs reachable after only a few minutes of walking. The EXP0_15 and MGAUS180 measures produced smoother results. The CUMR40 measure, with its constant weight, shows the highest absolute job totals, while the CUML40 measure linearly discounts these totals as travel time increases.

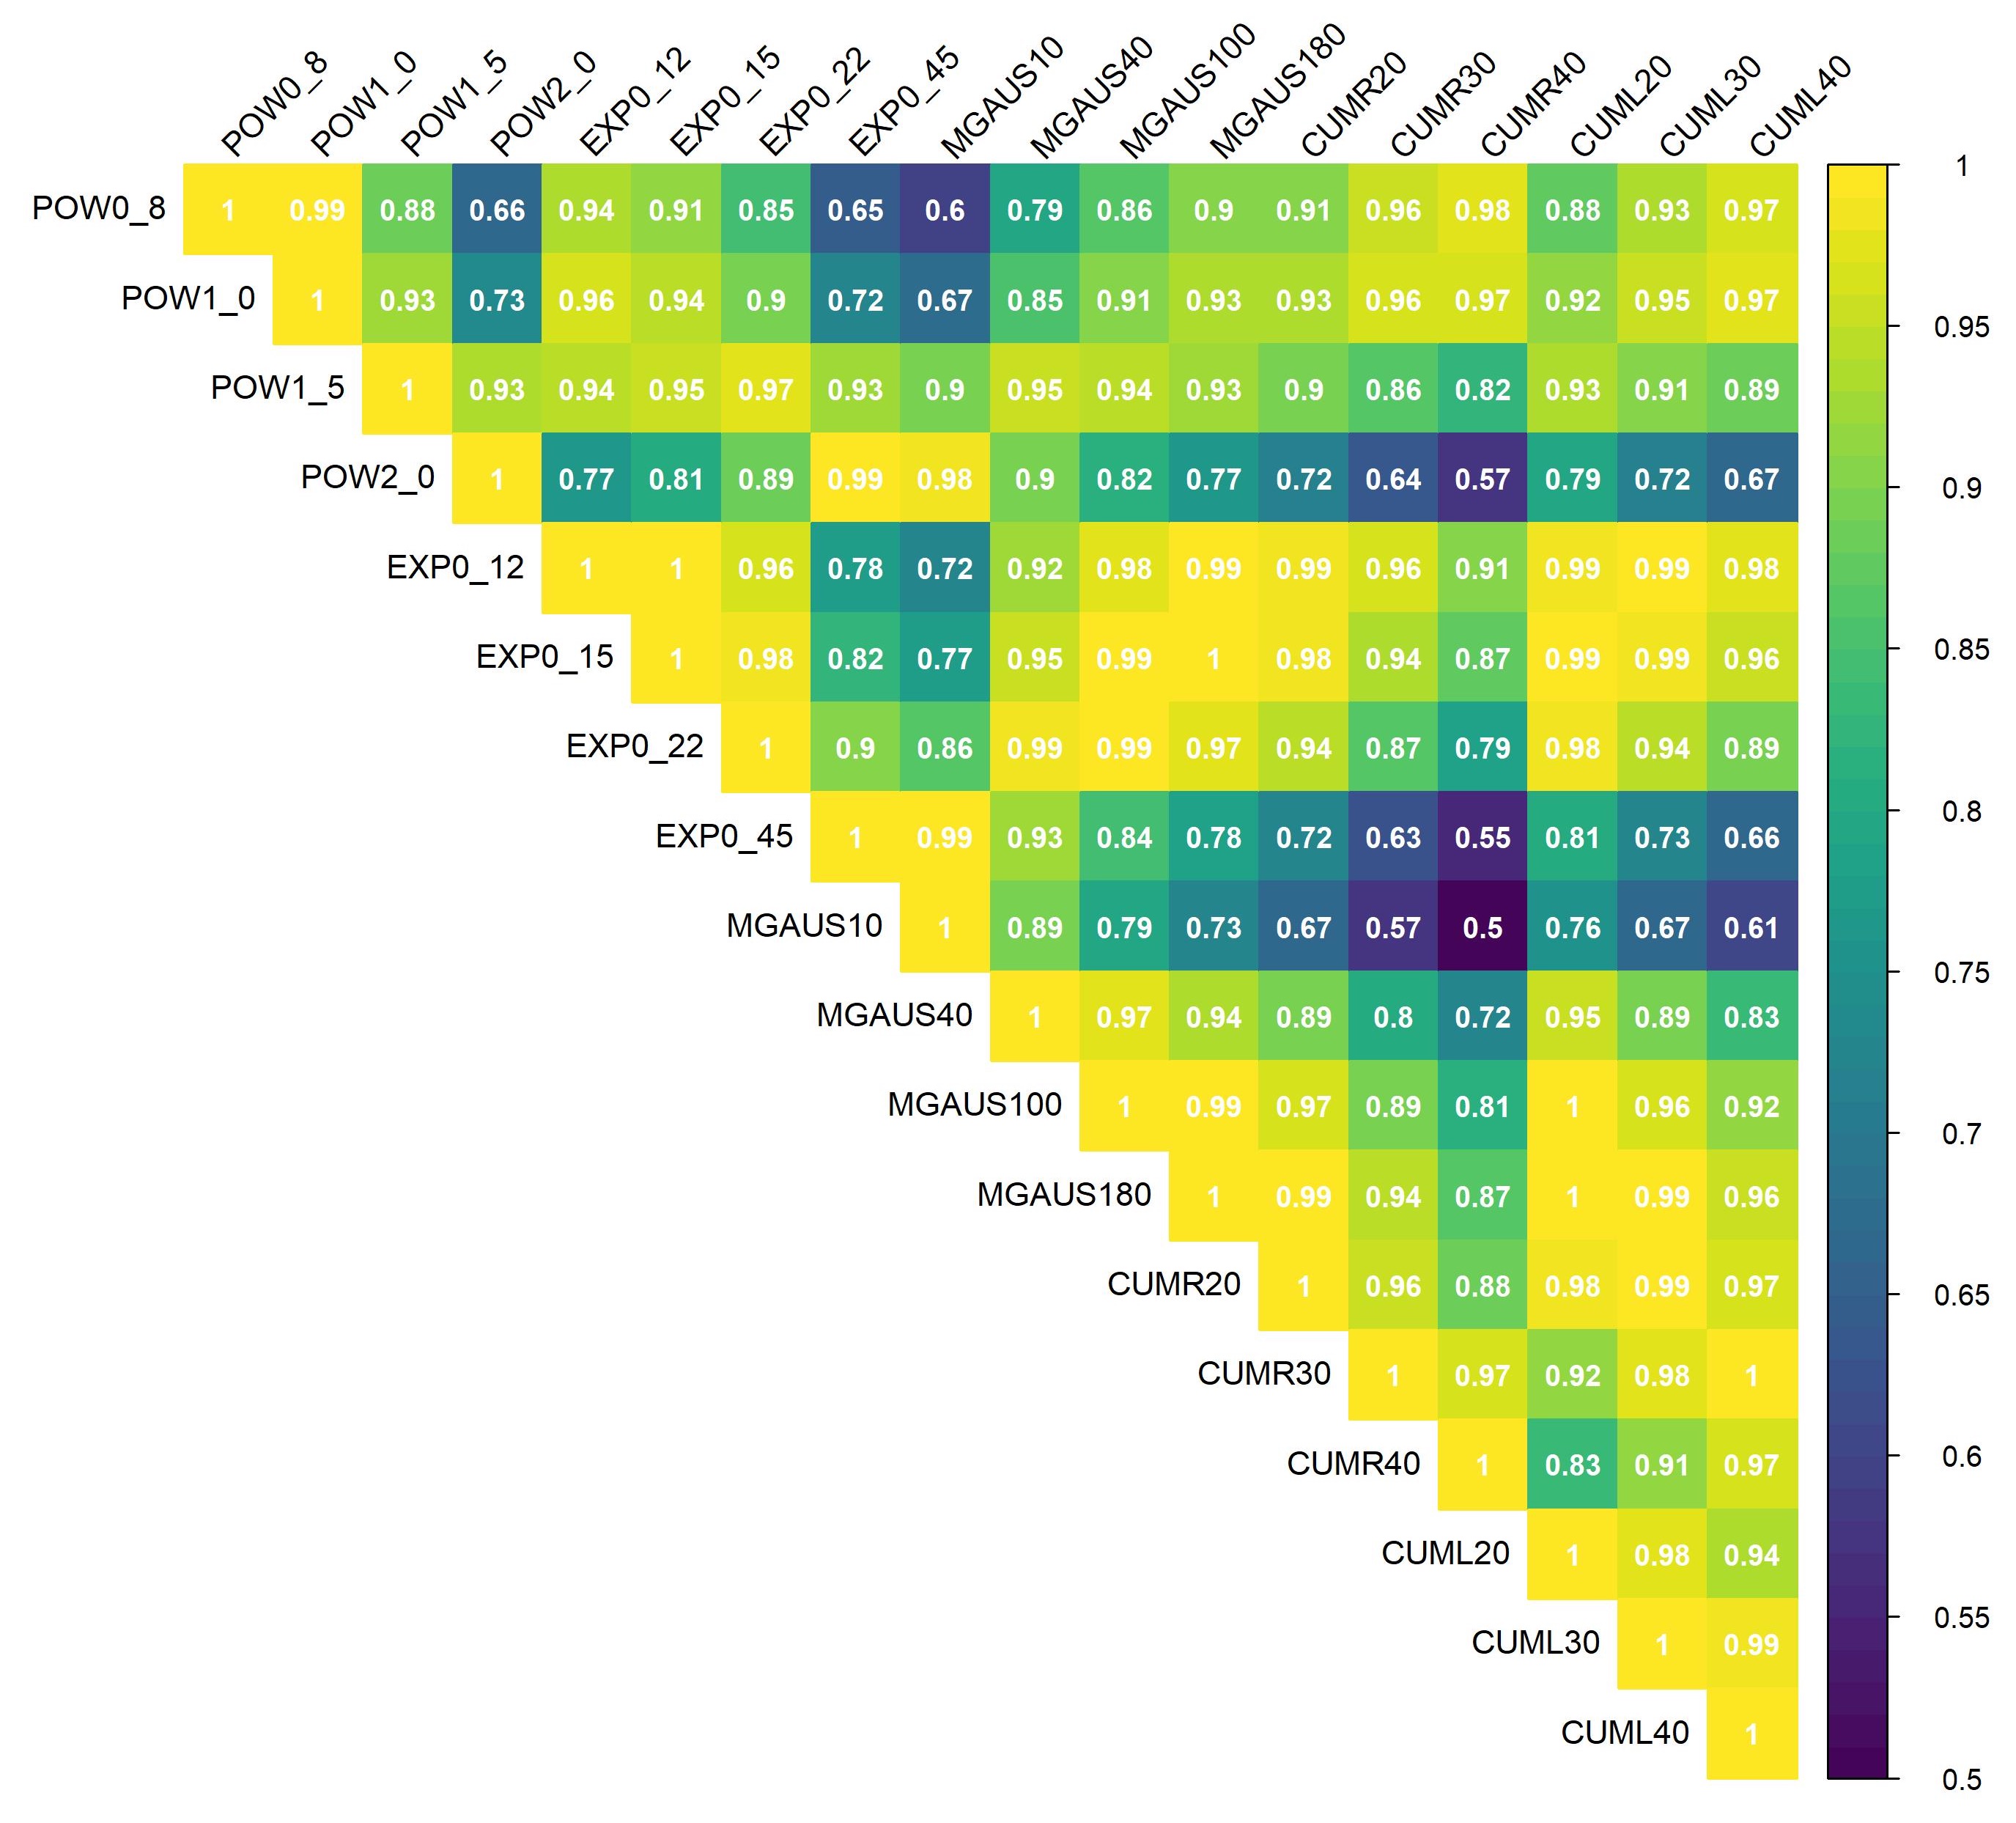
Similar to Kwan (Kwan 1998) and Vale & Pereira (Vale and Pereira 2017), correlations in accessibility across measures are generally strong (Figure 3), indicating many capture similar spatial processes. For example, of those used in Figures 1 and 2, results from the negative exponential (EXP0_15), modified Gaussian (MGAUS180), cumulative rectangular (CUMR40), and cumulative linear (CUML40) measures of impedance all show correlation coefficients of at least 0.87. In particular, the correlation between the EXP0_15 and MGAUS180 measures is 1.00. Results from the inverse power (POW2_0) measure are more unique, with correlations ranging from 0.57 to 0.81. It should be emphasized that such outcomes are not a product of similar functional forms alone; rather, the correlations reflect an interaction between different impedance measures and the spatial distribution of opportunities on the study area’s travel network. Furthermore, absolute accessibility totals differ across each, suggesting the choice of a suitable impedance function and specification remains an important issue that should be guided by theory and assumptions about travel behavior.

While the focus on walking trips in this sample analysis does not provide a full picture of travel behavior in the study area, the ability to run multiple analyses for different travel modes is limited only by the user’s network dataset. Moreover, the R notebook can be utilized to select or customize the implemented impedance measures in accordance with expectations about travel behavior for each mode. Taken together, this toolbox enables researchers and practitioners to make better decisions about the specification and customization of travel impedance as well as simplify the calculation of place-based accessibility for their study context.