Loading [Contrib]/a11y/accessibility-menu.js
Skip to main content
null
Findings
  • Menu
  • Articles
    • Energy Findings
    • Resilience Findings
    • Safety Findings
    • Transport Findings
    • Urban Findings
    • All
  • For Authors
  • Editorial Board
  • About
  • Blog
  • covid-19
  • search

RSS Feed

Enter the URL below into your favorite RSS reader.

http://localhost:42874/feed
Transport Findings
July 18, 2023 AEST

Ride-Hailing to Rail in the Suburbs: Can Subsidized Rides Enhance First and Last Mile Access for the Carless?

Hue-Tam Jamme, Andrew Eisenlohr, Deepak Bahl, Tridib Banerjee,
ride-hailingfirst-last milesuburbspublic-private partnershipLyft/Ubertransportation equity
Copyright Logoccby-sa-4.0 • https://doi.org/10.32866/001c.82216
Findings
Jamme, Hue-Tam, Andrew Eisenlohr, Deepak Bahl, and Tridib Banerjee. 2023. “Ride-Hailing to Rail in the Suburbs: Can Subsidized Rides Enhance First and Last Mile Access for the Carless?” Findings, July. https:/​/​doi.org/​10.32866/​001c.82216.
Save article as...▾
Download all (4)
  • Figure 1. First-last Mile Use of GoMonrovia by Share of Rides and Share of Respondents
    Download
  • Figure 2. GoMonrovia Volume of Rides per Month and Fare Structure
    Download
  • Figure 3. Volume of rides per capita TO (left) and FROM (right) Downtown Monrovia by sociodemographic cluster between January 2020 and February 2021 (included)
    Download
  • SI
    Download

Sorry, something went wrong. Please try again.

If this problem reoccurs, please contact Scholastica Support

Error message:

undefined

View more stats

Abstract

The study examines whether GoMonrovia, a public-private partnership between Lyft and the City of Monrovia, provides an effective and equitable first-last mile solution in a suburban setting. Datasets were obtained from Lyft, the American Community Survey, and an online survey. With more than half-a-million rides per year before COVID-19, the program proved to be an attractive mobility option. A large majority (77%) of respondents used GoMonrovia to or from the Monrovia Gold Line Metro station. Significant predictors of first-last mile use of subsidized Lyft rides include not having access to a car and living beyond walking distance from the station.

1. Questions

Previous research suggests that ride-hailing can help bridge the first-last mile gap in transit access by providing on-demand door-to-door connectivity to rail stations (Shaheen and Chan 2016). Some studies emphasize the potential equity benefits of ride-hailing as a first-last mile solution, as it could reduce mobility disparities between car owners and transit-dependent individuals (Reck and Axhausen 2020). Several cities in the United States have implemented public-private partnerships with ride-hailing companies (Mohiuddin 2021). Drawing from Brown, Manville, and Weber (2021), we evaluate such a program from an equity perspective.

We focus on the GoMonrovia program, a partnership between Lyft and the City of Monrovia, CA, which is located 32 km (20 miles), or 40 minutes, and 14 stops northeast of Los Angeles’ Union Station on the Metro light rail L Line extension that opened in 2016. Monrovia is a suburban community where most residents (38,000) live beyond walking distance from the Metro station. Under GoMonrovia, the City subsidizes Lyft rides within a service area bounded by a geofence. All rides starting and ending within the geofence are eligible for subsidy and users pay a flat fee per trip. Pre-pandemic, GoMonrovia offered three ride options with tiered pricing: (a) “Shared”/multiple-rider trips to or from downtown Monrovia, where the Metro station is located (as of February 2020, $1.00 per ride); (b) “Shared” trips outside of downtown Monrovia ($3.00 per ride); and (c) “Classic” or single-rider trips ($5.00 per ride).

The implementation of GoMonrovia raises an important question: What are the socio-demographic characteristics of people using GoMonrovia as a first-last mile solution? We expect transit-dependent individuals without access to a private vehicle to utilize the program for their first-last-mile mobility needs.

2. Methods

Cluster and Spatial Analyses

A unique dataset was compiled including:

  • Origin and destination (at the census tract or census block group level), ride option (shared to or from downtown, other shared, or classic) and time of travel for all Lyft rides operated under GoMonrovia between March 2018 and July 2021 (N = 1,139,860 trips).

  • Land use and sociodemographic data from the 2017 American Community Survey (ACS) at the census block group level.

A cluster analysis of ACS data revealed five distinct resident profiles, which were mapped in a geographic information system (GIS) at the census block group level and overlaid with pre-COVID-19 ridership trends to suggest the association with sociodemographic characteristics. The main limitation is that ride data obtained from Lyft did not indicate whether a trip started or ended at the Metro station, or whether the rider chained their trip with a ride on light rail.

Ordered Probit Regressions

An online survey, conducted in May 2021, inquired Monrovia residents about their use of GoMonrovia as a first-last mile solution pre-COVID-19, their access to a private vehicle, and their sociodemographic background. Lyft invited respondent participation by sending an email to 29,000 account holders who were registered with the GOMONROVIA promo code. The City also distributed the survey link twice via their newsletter and social media accounts (Twitter, Facebook, and Instagram). The response rate was low, most likely due to survey fatigue and low motivation to report on travel behaviors seriously disrupted by the COVID-19 pandemic. The small sample size (N=203) may cause biases in the analysis of the survey data. Nevertheless, we used survey responses to assess the relationship between participant characteristics and usage intensity of GoMonrovia as a first-last mile mechanism (dependent variable).

Figure 1
Figure 1.First-last Mile Use of GoMonrovia by Share of Rides and Share of Respondents

3. Findings

First-Last Mile Use

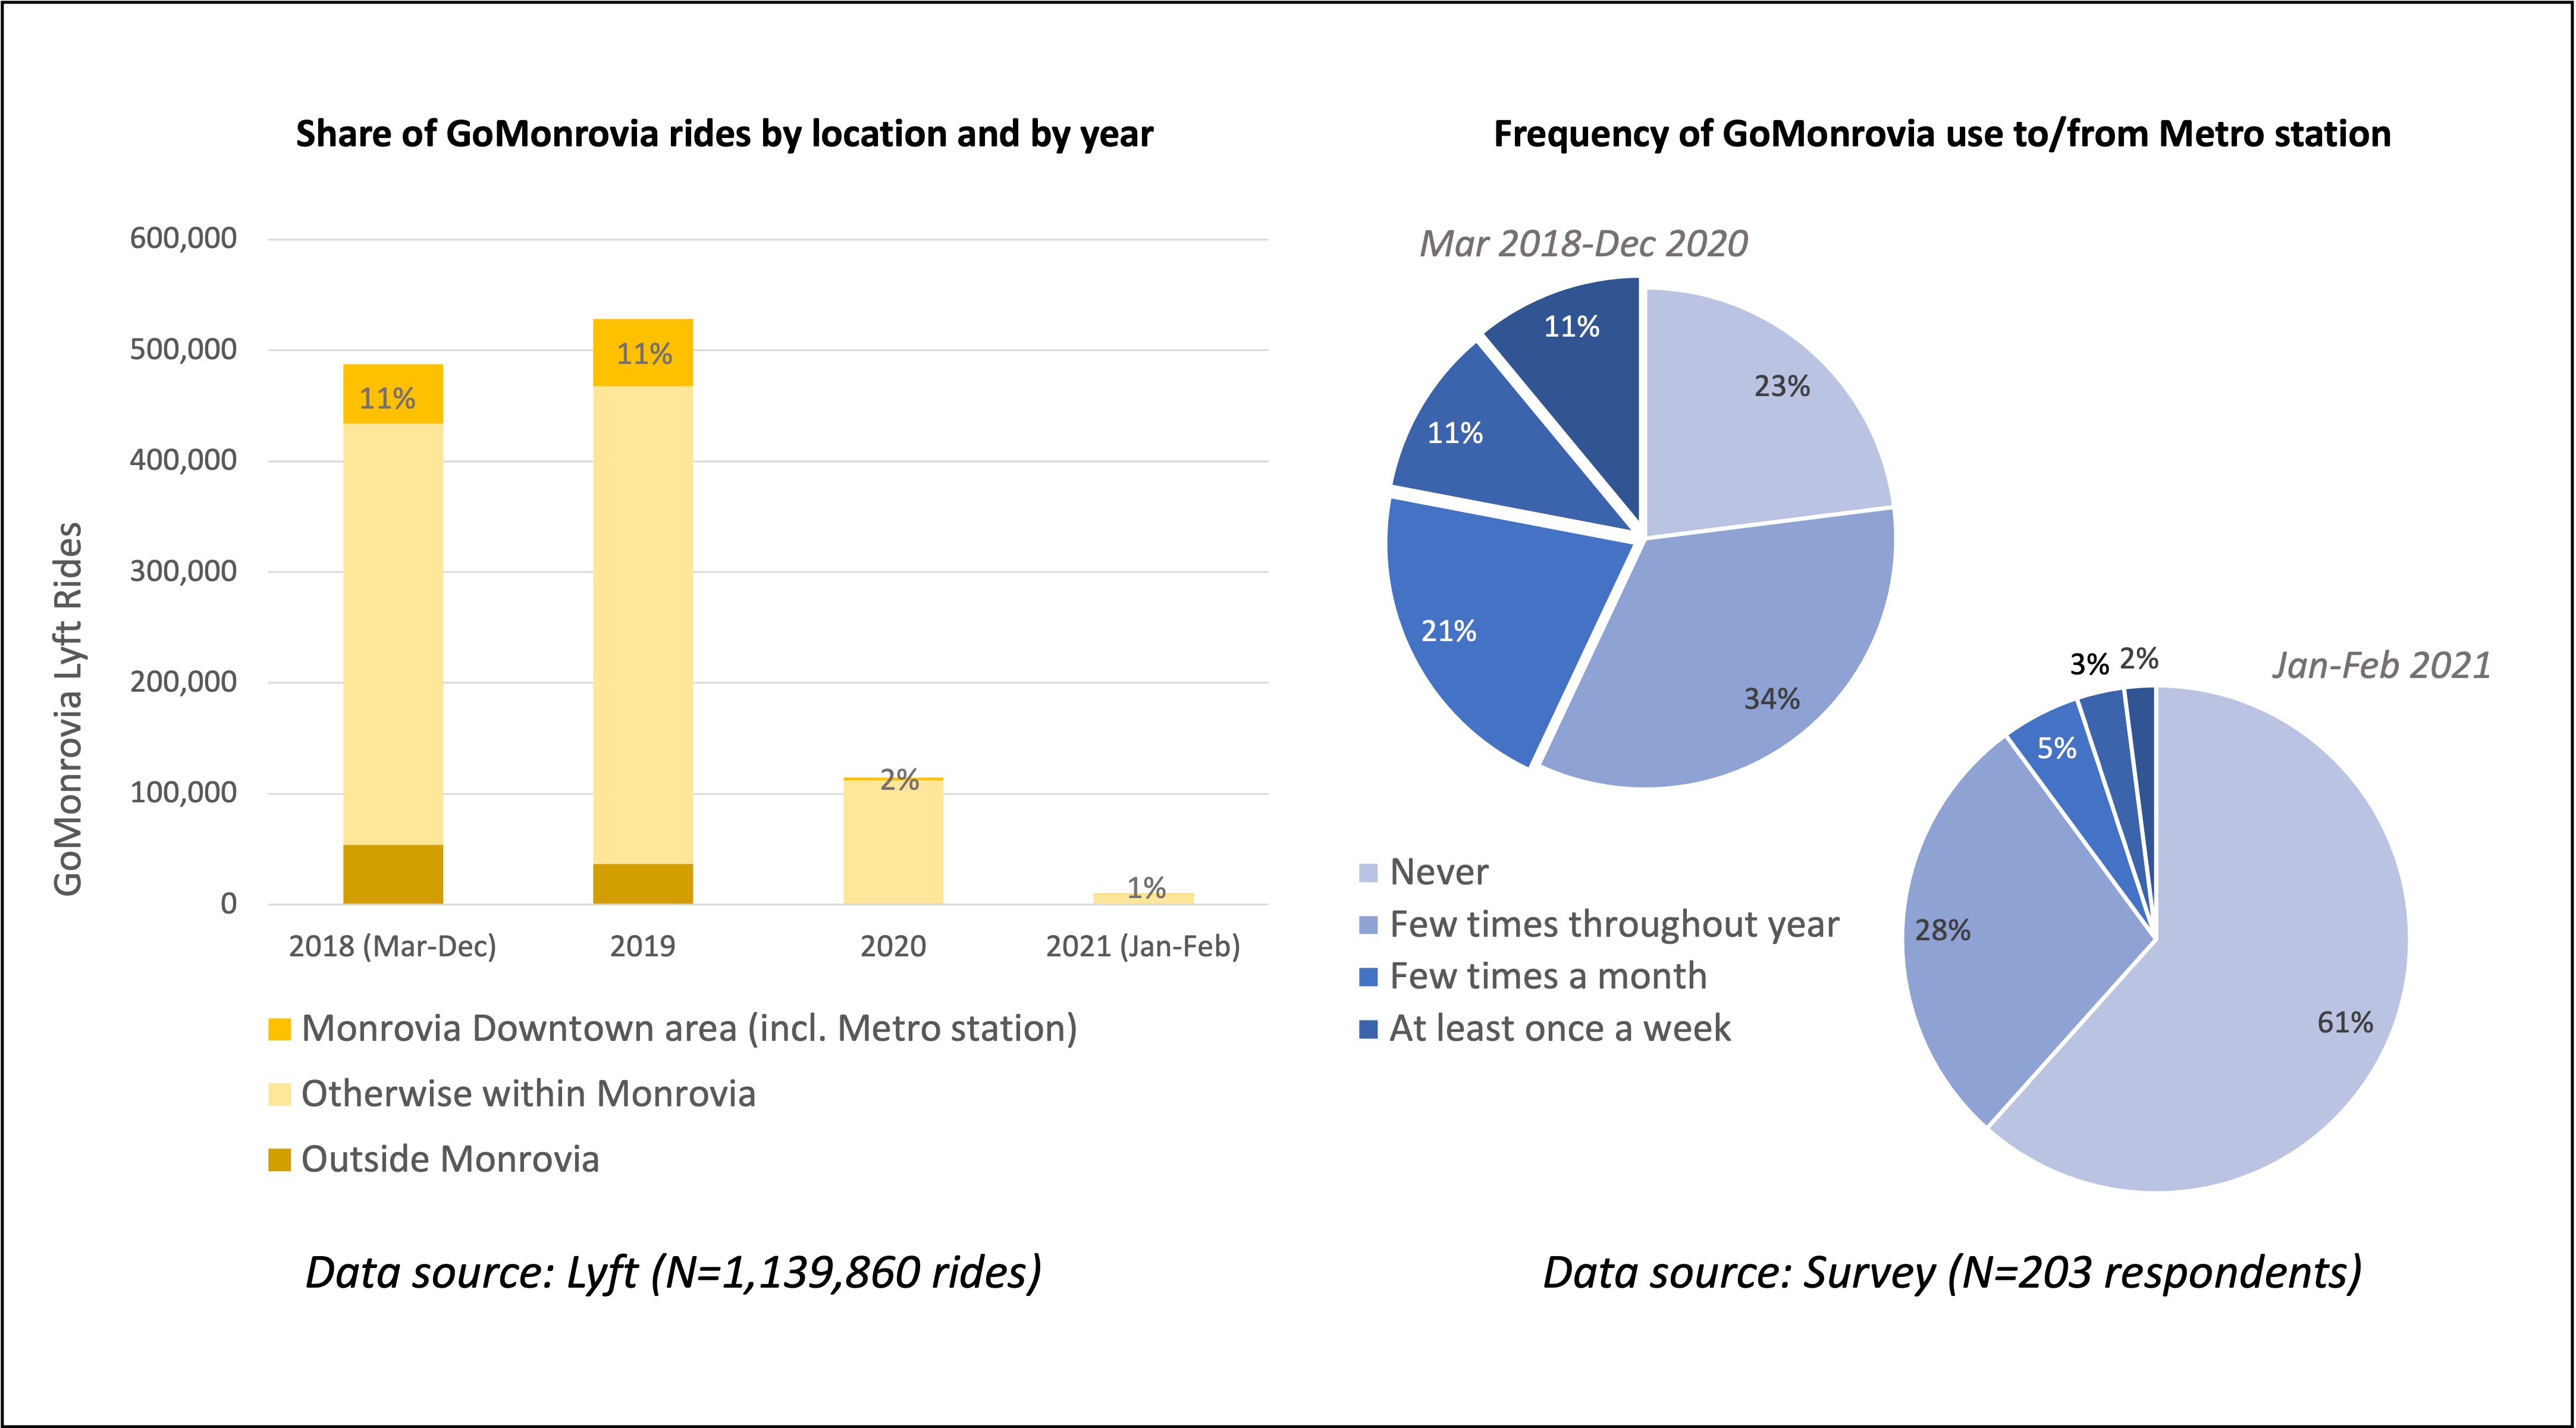
Per Figure 1 (left), GoMonrovia subsidized 1.1 million Lyft rides in 2018 and 2019; 11% began or ended close to downtown Monrovia Metro station. While these statistics illustrate the overall success of the program in improving mobility for Monrovia’s residents, they cannot speak directly to its potential as a first-last mile mechanism. Nonetheless, per Figure 1 (right) a large majority of survey respondents (77%) did use GoMonrovia as a first-last mile solution before COVID-19 – 11% most days of the week, 11% at least once per week, 21% a few times per month, and 34% a few times per year.

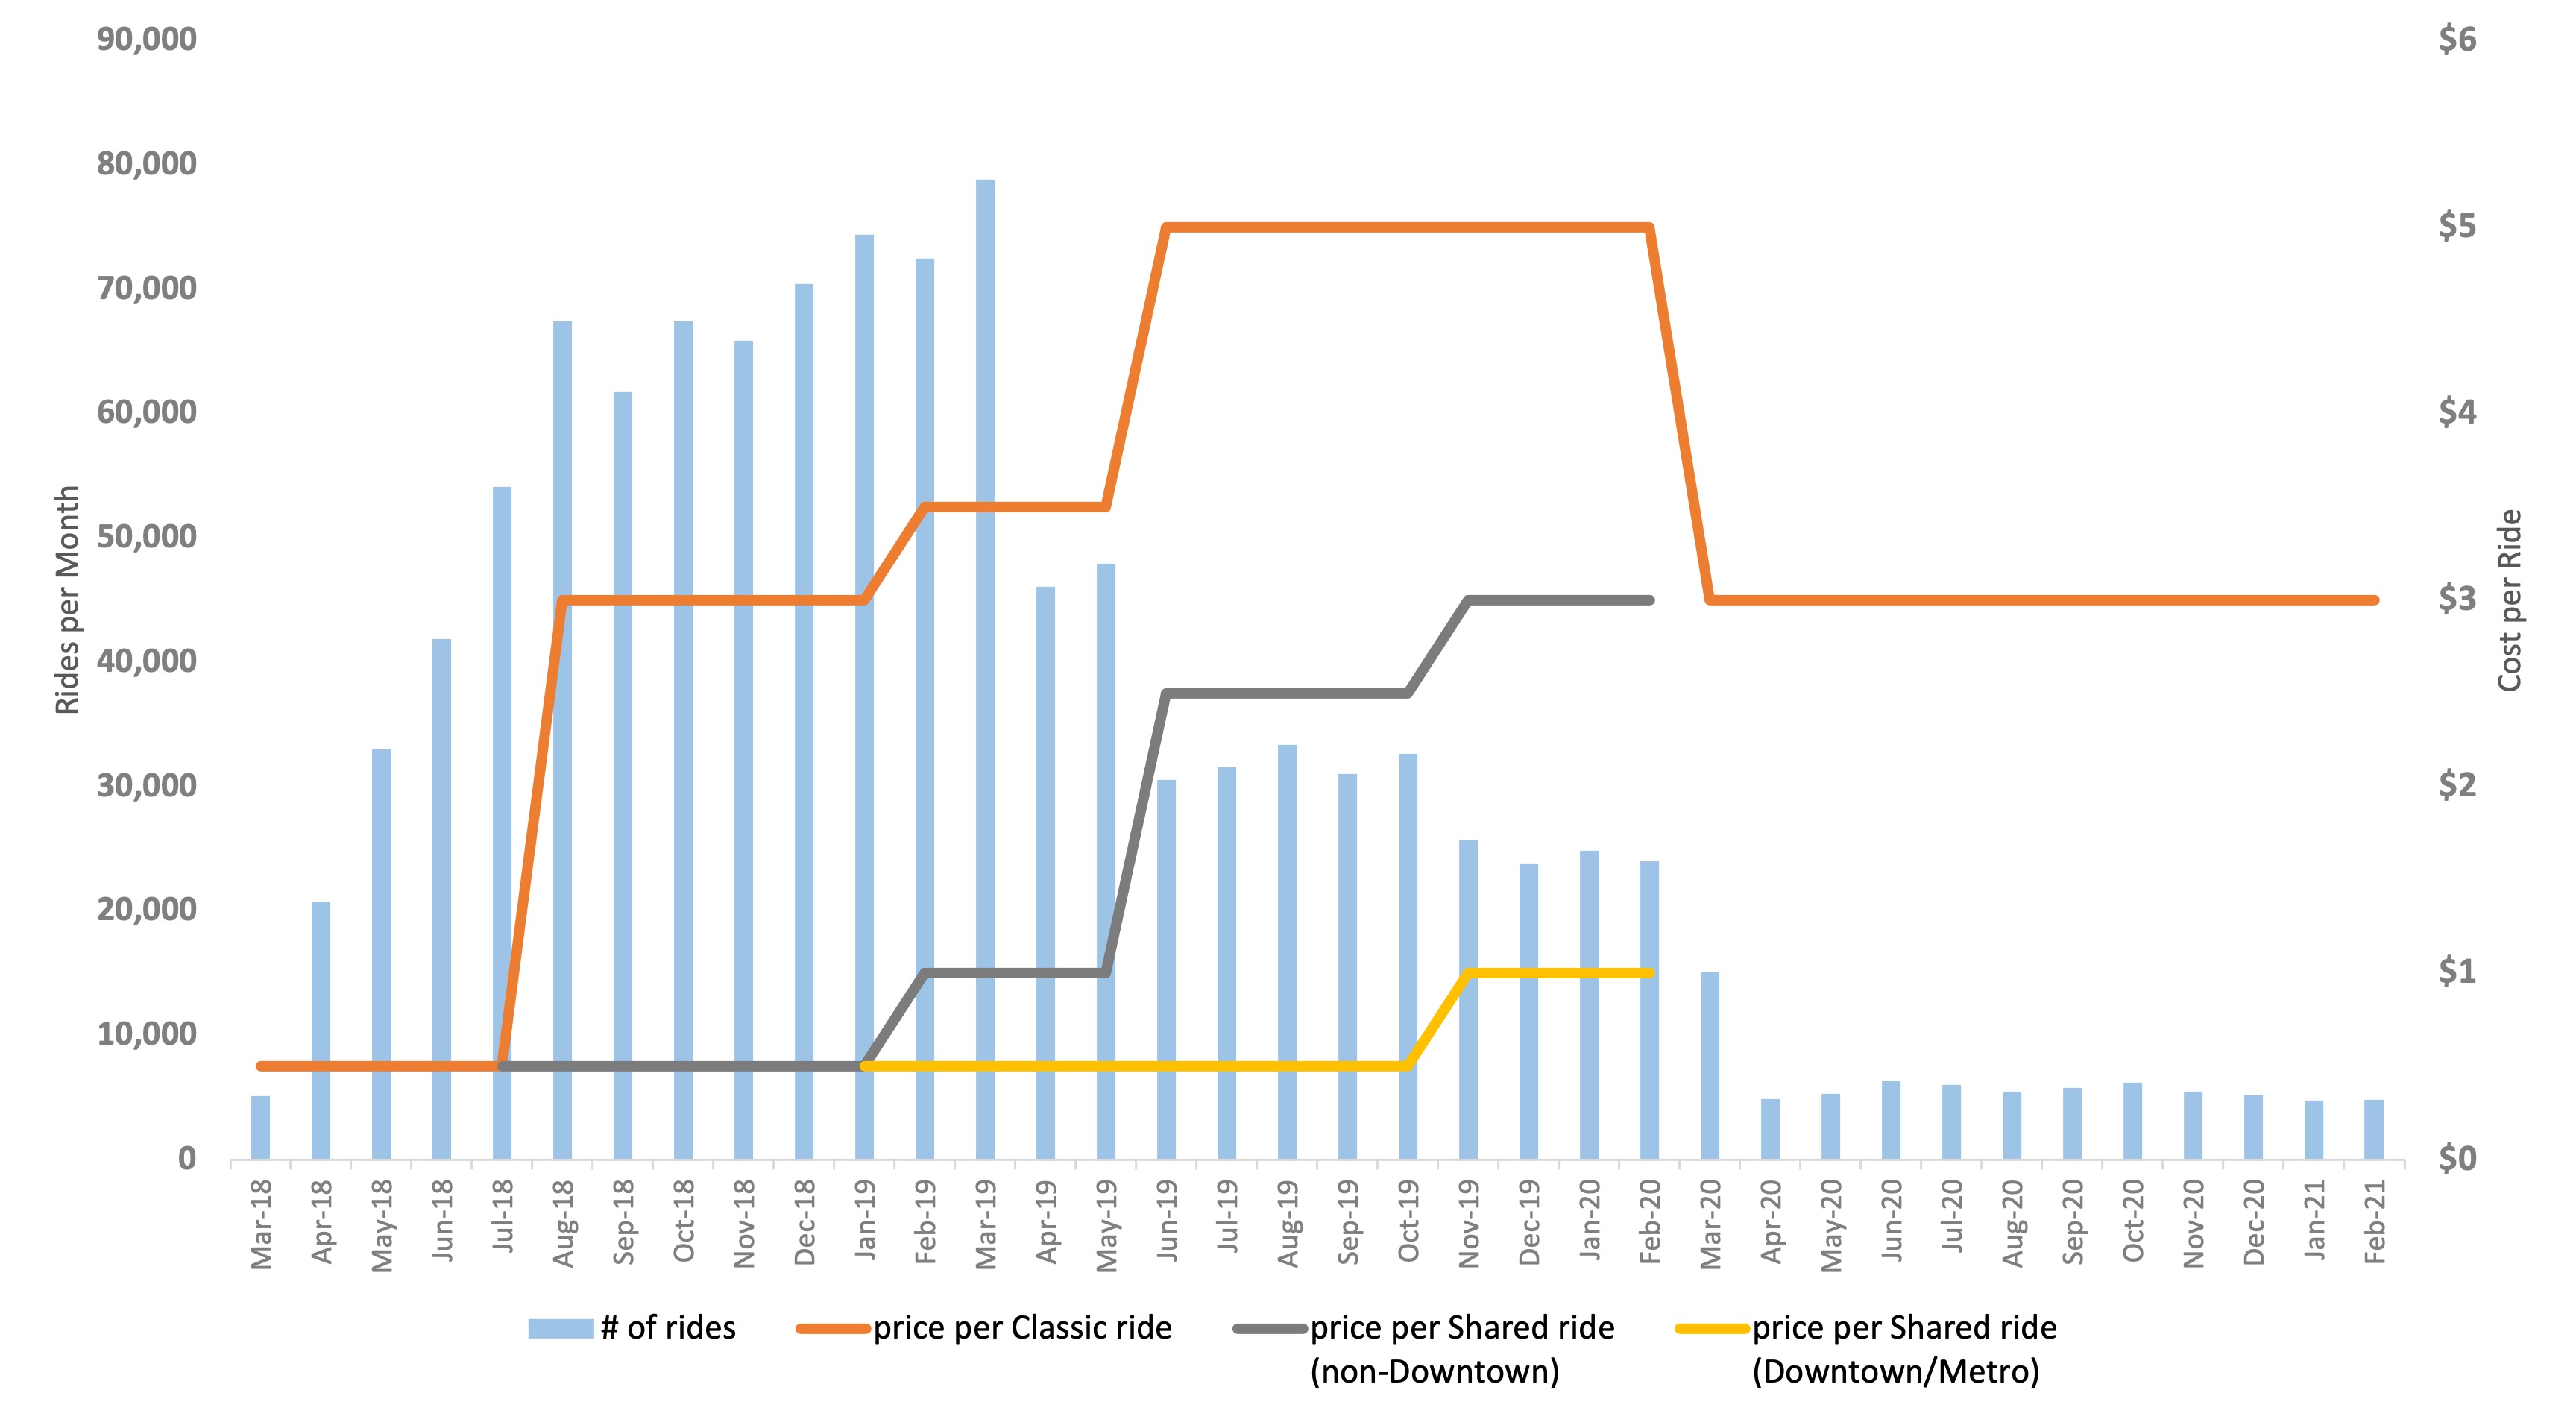
Figure 2 shows how the service area and fare structure were adjusted over time, and how monthly ridership responded to those changes. Initial fare structure was successful in promoting ridership, but budget constraints led to gradual reduction in subsidy before the onset of COVID-19. Unsurprisingly, ridership dropped significantly post-COVID-19. Before the pandemic, a price increase was consistently associated with reduced ridership. There was only one price shift for Shared Metro/Downtown rides in October 2019. Price increased from $0.50 to $1.00. Small sample size coupled with only one price shift made it impossible to construct a time-series regression model to estimate the effects of price shifts on average Shared Metro/Downtown ridership from which we infer possible first-last mile use of GoMonrovia.

Figure 2
Figure 2.GoMonrovia Volume of Rides per Month and Fare Structure

Notes: Ridership trends have been affected by two changes in the service area indicated by red dashed lines and five changes in the fare structure. Service area: Until March 2019, the service area included the entire Los Angeles County. In March 2019, it was reduced to include only the City of Monrovia and some nearby amenities and part of the neighboring City of Bradbury. In June 2019, it was limited to Monrovia’s city limits and some neighboring amenities (e.g., one hospital and a Target store). The service area remained the same until the end of the study period in February 2021. Fare structure: In February 2020, just before the COVID-19 pandemic, the pricing structure was $5 for a Classic (non-shared) ride; $3 for a Shared ride within Monrovia but outside the downtown area, and $1 for a Shared ride starting or ending in downtown Monrovia area where the Metro station is located.

Ridership Trends by Socio-Demographic Cluster

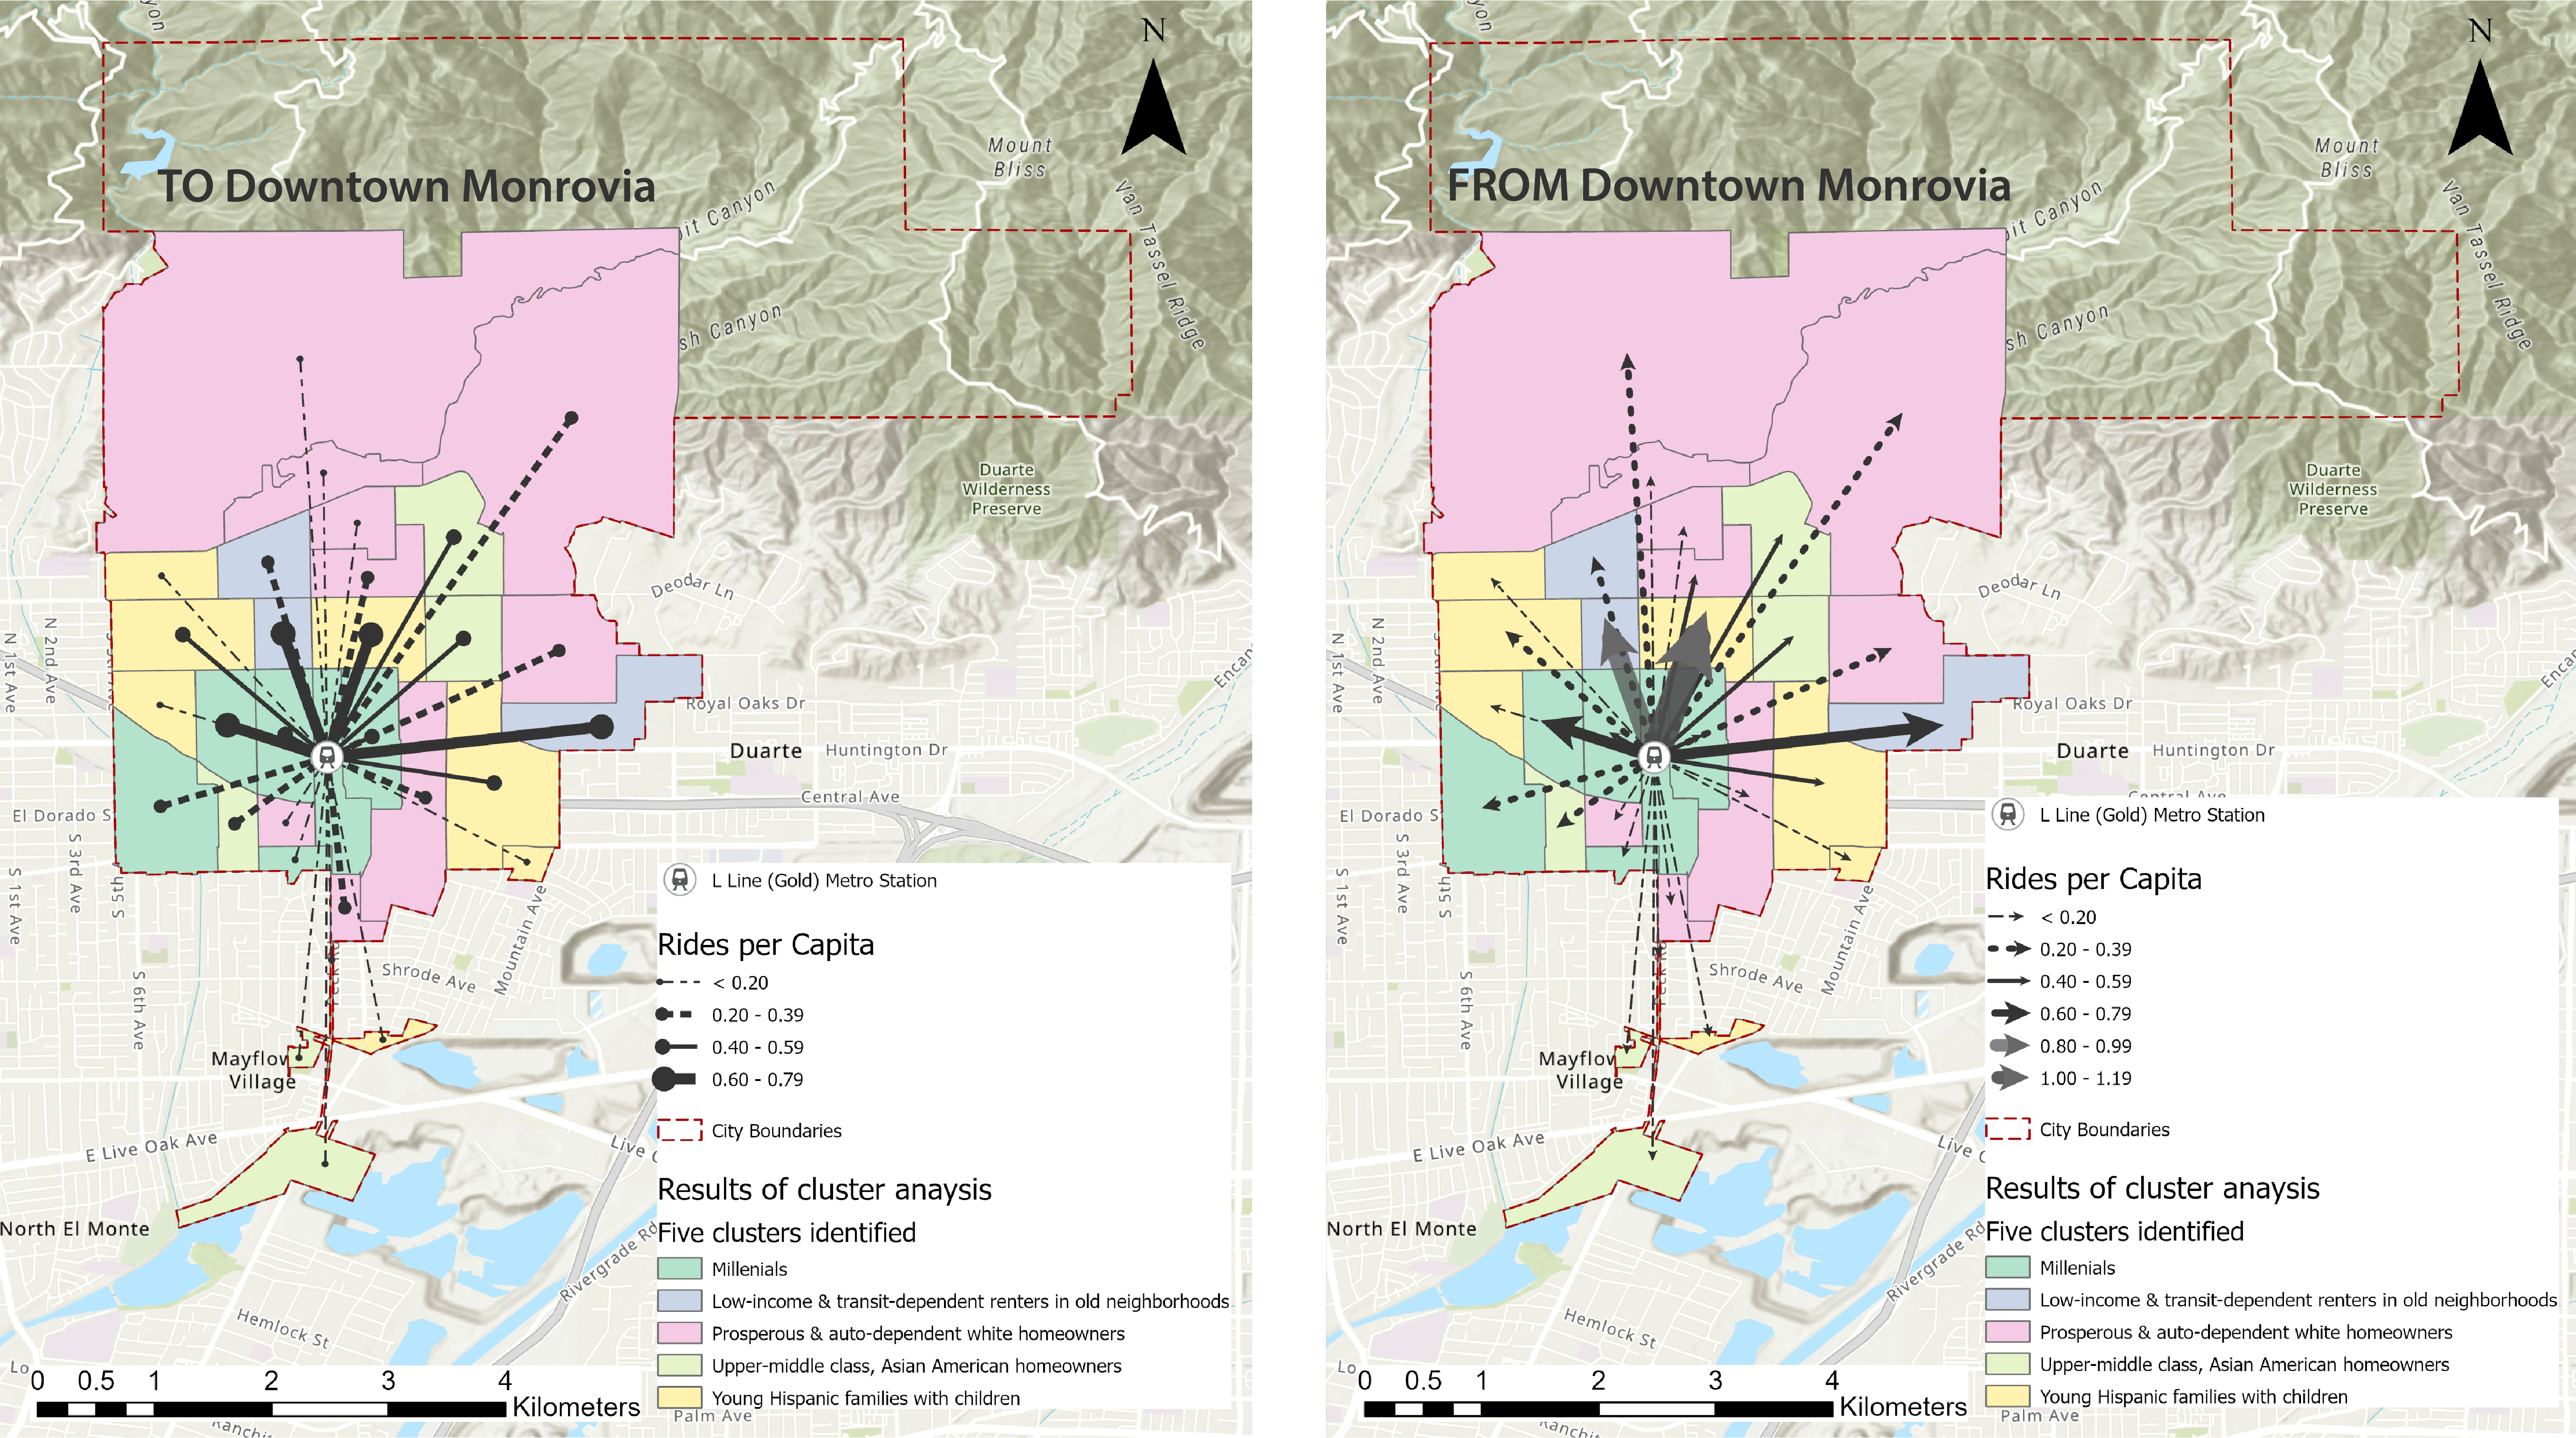
The names of the five clusters of census block groups (Table 1) suggested their dominant socioeconomic and land use characteristics. Figure 3 shows that three out of seven census block groups in the cluster of Young Hispanic Families with Children generated higher volumes of trips starting or ending in the downtown Monrovia area, as did two out of three census block groups of the Low Income and Transit-dependent Renters cluster. In comparison, clusters that generated lower volumes of GoMonrovia trips to/from downtown Monrovia include Prosperous and Auto-dependent White Homeowners; Millennials (except for one census block group in this cluster); and Upper Middle-class Asian-American Homeowners.

Table 1.Demographic and Housing Composition of Five Clusters
Cluster 1 Cluster 2 Cluster 3 Cluster 4 Cluster 5
Young Hispanic families
with children
Upper-middle class,
Asian American homeowners
Millennials Low-income &
transit-dependent
renters in old neighborhoods
Prosperous &
auto-dependent
white homeowners
Population Density (people per acre) 28 24 33 16 16
Median Age of Population 35.2 44.8 38.3 42.3 43.5
Share of Population Age 17 and Below 26% 18% 16% 20% 22%
Share of Population Age 65 And Up 9% 16% 12% 13% 15%
Hispanic Share of Population 57% 41% 41% 33% 24%
Asian American, non-Hispanic Share of Population 12% 19% 14% 7% 9%
White American Alone, non-Hispanic Share of Population 24% 33% 29% 44% 59%
Black American, non-Hispanic Share of Population 8% 0% 3% 4% 5%
Share of Population (age 25+) with At Least a BA 27% 35% 33% 33% 40%
Median Household Income (2018 USD) $60,739 $86,458 $68,813 $44,107 $113,788
Share of Households with 0 Personal Vehicles 5% 3% 3% 13% 0%
Housing Density (units per acre) 11 7 13 7 7
Share of Occupied Units that are Rented 62% 29% 65% 59% 40%
Share of Occupied Units that are Detached SFR 56% 78% 40% 63% 86%
Share of Units Constructed pre-1940 13% 10% 11% 42% 21%
# of Block Groups in Cluster 7 5 6 3 9
Figure 3
Figure 3.Volume of rides per capita TO (left) and FROM (right) Downtown Monrovia by sociodemographic cluster between January 2020 and February 2021 (included)

Notes: Data sources are 2017 ACS and Lyft’s GoMonrovia ridership data. Data analyses by the research team. GIS mapping by Xiaoling Fang.

Predictors of First-Last Mile Use

Table 2 compares the mean characteristics of frequent first-last mile users of GoMonrovia, namely those who rode to or from the Metro station at least once per week before COVID-19, with those of all survey respondents. First-last mile users were less likely to have access to a private vehicle and more likely to live at least 1.6 km (1 mile) away from the Metro station. First-last mile users were also more likely than average to be female, non-White, aged 25-44 years, have at least a bachelor’s degree, and earn less than $100,000 per year.

Table 2.Socioeconomic and Demographic Characteristics of First-Last Mile Users Compared to all Surveyed Users
Share of respondents who used GoMonrovia to/from Metro station at least weekly
(N=44)
Share of all respondents (N=203)
… with personal vehicle access 70% 82%
… living < 1.6 km (1 mile) from Monrovia Metro 11% 24%
… living 1.6–⁠6.4 km (1-⁠4 miles) from Monrovia Metro 73% 67%
… living > 6.4 km (4 miles) from Monrovia Metro 16% 9%
… with a traditional full-time job 50% 53%
… learning as part- or full-time student 14% 11%
… identifying as female 60% 57%
… identifying as Hispanic and single race 37% 34%
… identifying as Black American, non-Hispanic 7% 4%
… identifying as Asian American/Pacific Islander, non-Hispanic 14% 13%
… identifying as White, non-Hispanic 42% 49%
… younger than 25 years old 5% 7%
… between 25 & 44 years old 51% 42%
… between 45 & 64 years old 33% 37%
… 65 years old or older 12% 14%
… with at least a Bachelor's degree 58% 64%
… with annual income < $25,000 14% 13%
… with annual income $25,000 - $49,999 20% 15%
… with annual income $50,000 - $99,999 34% 29%
… with annual income $100,000 or above 32% 43%

Corroborating our hypothesis, the regression results in Table 3 provide consistent evidence that those with access to a personal vehicle were significantly less likely to use GoMonrovia as a first-last mile solution. A consistently significant and negative relationship is also evident for living less than 1.6 km (1 mile) from the station, as well as being 65 years and older (relative to those younger than 25). However, being of prime working age (25–64 years old) does not predict use of GoMonrovia as a first-last mile mechanism to a greater extent than being younger than 25.

Table 3.Ordered Probit Regression Results
(1) (2)
GoMonrovia to
Metro Frequency
GoMonrovia to
Metro Share
Use GoMonrovia at least weekly pre-COVID-19
Personal vehicle access -0.560** -0.488*
(0.258) (0.273)
Distance to Metro less than 1.6 km (1 mile) -0.408** -0.590***
(0.183) (0.186)
Traditional full-time job 0.268 0.185
(0.190) (0.185)
Female -0.256 -0.366**
(0.164) (0.174)
White alone, non-Hispanic 0.00211 0.237
(0.184) (0.178)
Age 25-64 -0.295 -0.830***
(0.290) (0.294)
Age 65+ -0.758* -1.126***
(0.395) (0.386)
Educational attainment: BS or more 0.129 0.312*
(0.195) (0.182)
Annual household income: US$ 100,000 or more -0.148 -0.00219
(0.189) (0.184)
/cut1 -1.626*** -1.826***
(0.309) (0.331)
/cut2 -0.0255 -0.786**
(0.296) (0.324)
Observations 195 195

Robust standard errors in parentheses
*** p<0.01, ** p<0.05, * p<0.1
Notes: The same equation supported two models. The only difference between the two is how usage intensity is measured. In Model 1, we used a frequency measure where 0 = respondent I never used GoMonrovia to travel to or from the Metro station; 1 = a few times a year or a few times a month; and 2 = at least once a week or most of the week. In Model 2, we used a share measure, where 0 = respondent i indicated that 0% of their GoMonrovia travel was to/from the Metro station pre-pandemic; 1 = 50-100%; and 2 = 51-100%. Independent variables are indicators for whether individual i reported having regular access to a personal vehicle (personalVehicleAccessi), living less than 1.6 km (1 mile) away from the Monrovia Gold Line Metro station (resDistToMetroLess1Milei), having a traditional full-time job (fullTimeTradJobi), identifying as female (genderFemalei), identifying as White alone, non-Hispanic (whiteNonHispanici), being between 25 and 64 years old in early 2020 (age25to64yearsi), being at least 65 years old in early 2020 (age65orOlderi), having attained at least a Bachelor’s degree in terms of their education (atLeastBAi), and living in a household with an annual pre-tax income of at least $100,000 (householdIncAtLeast$100Ki).

In sum, the success of GoMonrovia suggests that this public-private partnership with a ride-hailing company provides an attractive mobility option in a suburban community. Furthermore, we found, as expected, that first-last mile users of the program are more likely to be carless; to live beyond 1.6 km (1 mile) from the station; and to be in prime working age. These findings support the idea that subsidized on-demand rides hold promise to enhance equitable mobility and accessibility in car-dependent suburban contexts. Please refer to the Supplementary Information file for more information on the GoMonrovia program, our data sources, and results of additional analyses regarding price elasticity of demand for GoMonrovia rides.


Acknowledgement

The research project team is grateful for the funding support provided by the Metrans Transportation Center through USDOT Grant 65A0674TO034. We are thankful to our graduate research assistants at the USC Price School: Nida Ahmed, Corey Barnes, and Xiaoling Fang. In addition, our sincere gratitude to the following organizations and individuals for their cooperation and assistance in conducting this research project: at the City of Monrovia, Angela Cho (Senior Management Analyst, City Manager’s Office) and Alex Tachiki (Administrative Officer, Public Works); at Lyft, Inc., Calli Cenizal (Senior Manager, Government and Transit Partnerships).

Submitted: March 08, 2023 AEST

Accepted: June 29, 2023 AEST

References

Brown, Anne, Michael Manville, and Alexandra Weber. 2021. “Can Mobility on Demand Bridge the First-Last Mile Transit Gap? Equity Implications of Los Angeles’ Pilot Program.” Transportation Research Interdisciplinary Perspectives 10 (June):100396. https:/​/​doi.org/​10.1016/​j.trip.2021.100396.
Google Scholar
Mohiuddin, Hossain. 2021. “Planning for the First and Last Mile: A Review of Practices at Selected Transit Agencies in the United States.” Sustainability 13 (4): 2222. https:/​/​doi.org/​10.3390/​su13042222.
Google Scholar
Reck, D.J., and K.W. Axhausen. 2020. “Subsidized Ridesourcing for the First/Last Mile: How Valuable for Whom?” European Journal of Transport and Infrastructure Research 20 (4): 59–77.
Google Scholar
Shaheen, Susan, and Nelson Chan. 2016. “Mobility and the Sharing Economy: Potential to Facilitate the First- and Last-Mile Public Transit Connections.” Built Environment 42 (4): 573–88. https:/​/​doi.org/​10.2148/​benv.42.4.573.
Google Scholar

This website uses cookies

We use cookies to enhance your experience and support COUNTER Metrics for transparent reporting of readership statistics. Cookie data is not sold to third parties or used for marketing purposes.

Powered by Scholastica, the modern academic journal management system