Loading [Contrib]/a11y/accessibility-menu.js
Skip to main content
null
Findings
  • Menu
  • Articles
    • Energy Findings
    • Resilience Findings
    • Safety Findings
    • Transport Findings
    • Urban Findings
    • All
  • For Authors
  • Editorial Board
  • About
  • Blog
  • covid-19
  • search

RSS Feed

Enter the URL below into your favorite RSS reader.

http://localhost:24211/feed
Energy Findings
July 08, 2023 AEST

An Economic Analysis of Energy Storage Systems Participating in Resilient Power Markets

Molly J. Haugen, Lee Gordon, Daniel Ainalis, Adam M. Boies,
hydrogenenergy storagehydrogen economyenergy storage economics
Copyright Logoccby-sa-4.0 • https://doi.org/10.32866/001c.82207
Findings
Haugen, Molly J., Lee Gordon, Daniel Ainalis, and Adam M. Boies. 2023. “An Economic Analysis of Energy Storage Systems Participating in Resilient Power Markets.” Findings, July. https:/​/​doi.org/​10.32866/​001c.82207.
Save article as...▾
Download all (4)
  • Figure 1. The model development flowchart is shown for the techno-economic analysis of energy storage systems.
    Download
  • Figure 2. Annualized life-cycle cost (left-axis) and levelized cost of electricity (right-axis) for all considered energy storage systems in a low-capacity scenario (top), medium-capacity scenario (middle) and high-capacity scenario (bottom). All scenarios assume a lifespan of 30 years for the capital equipment and battery replacements, an electricity cost of £45/MWh and a discount rate of 5%. The power rating (MW) and storage capacity (MWh) are indicated within the scenarios.
    Download
  • Figure 3. Wholesale electricity price (top figure) used for validation of hourly charge and discharge are shown (left-axis) with total storage charge level (right-axis) indicated by the black dotted line over the course of 72 hours (middle figure). Profit optimization modelled results for cumulative operating profits and hourly operating profit and losses are shown over same 72 hours (bottom). The inset in the bottom figure shows annual net operating profit for hydrogen ESS with access to energy markets (white) and access to hydrogen and energy markets (blue) for 1) H2 with storage above ground and fuel cell, 2) H2 with storage below ground and fuel cell, 3) H2 with storage above ground and CCGT, and 4) H2 with storage below ground and CCGT.
    Download
  • Supplemental Information
    Download

Sorry, something went wrong. Please try again.

If this problem reoccurs, please contact Scholastica Support

Error message:

undefined

View more stats

Abstract

Energy storage systems (ESS) are becoming increasingly important as high shares of renewable energy generation causes increased variability and intermittency of the power supply. With more renewable energy production, energy markets are presented with possible overgeneration due to renewable sources being incompatible with electric loads and storage capacity. ESSs are viewed as underpinning technology which can support the energy system resilience in these areas. However, with various ESS technology options, configurations and performance characteristics it is difficult to compare the installed economic competitiveness across different technologies and desired applications in a standardized format. This work provides a novel economic assessment framework for evaluating the levelized cost of storage, annualized life-cycle cost and expected annual revenues of 10 grid-based and hydrogen-based ESSs based on their application potential.

1. Questions

Forecasts for anticipated curtailed energy conclude that energy storage systems (ESSs) must be more responsive to irregular energy sources (Zakeri and Syri 2015) and thus, long-term energy storage has gained substantial research funding (energy.gov 2022; gov.uk 2022). Previous studies have contributed to understanding the functional limitations, technical characteristics, and optimal strategies for modelling ESSs (Cutter et al. 2014; Díaz-González, Sumper, and Gomis-Bellmunt 2016; Dunn, Kamath, and Tarascon 2011; Evans, Strezov, and Evans 2012; Karellas and Tzouganatos 2014; Punys et al. 2013). These parameters documented in literature have been used within the model. However, further research is required to explore ESS that can generate revenues from interacting with the electric grid or, in the case of hydrogen, participation in both electric and hydrogen markets.

Here, the following questions are addressed: 1) What are the financial requirements for energy storage in resilient energy systems? and 2) How do different operational modes and market participation influence the overall financial implications for ESSs?

2. Methods

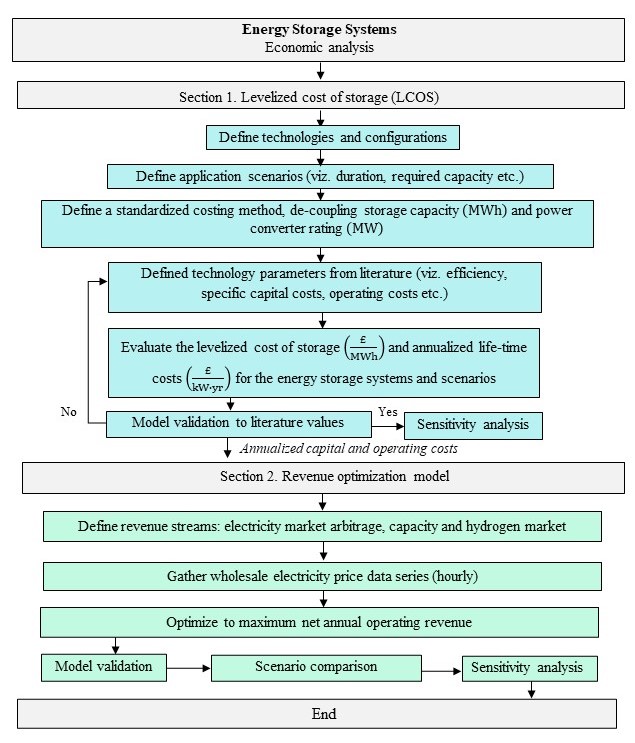
In order to directly compare ESSs, a standardized economic assessment framework has been established to evaluate the respective annualized life-cycles costs (LCCs) and annual revenues, shown in Figure 1. It includes fixed costs (£/kW/year), variable costs (£/MWh), and accommodates revenue stacking options. An economic assessment of ESSs includes the technology itself (i.e. round-trip efficiency, capital costs- fixed and variable, and replacement costs) and exogenous factors related to the final ESS application (i.e. electricity price, energy demand, and project time horizon) (Moseley and Garche 2014). Therefore, parameters characterizing both the storage technology and storage application have been considered (National Grid ESO 2021).

Figure 1
Figure 1.The model development flowchart is shown for the techno-economic analysis of energy storage systems.

The Supporting Information elaborates on the equations used for the LCC model, the profitability analysis, and an assessment of model metrics. The Supporting Information also includes the literature used for costing and technology performance. Briefly, an ESS’s LCC represents the cost per given power output in an annualized form over the ESS’s lifespan. The model presented here builds upon and is validated by other literature sources (Díaz-González, Sumper, and Gomis-Bellmunt 2016; Moseley and Garche 2014). The objective function of the profitability analysis is to maximize net annual operating profit from charging and discharging sequences, given perfect foresight of hourly UK 2019 wholesale electricity prices (NordPool 2020). This model calculates profit based on storage capacity, charge level and ensures that charging and discharging are de-coupled and cannot happen simultaneously. Due to wholesale foresight, the model allows for ESSs to be able to optimise between selling electricity or hydrogen upon primary energy production and storing energy to be sold at a more profitable energy price. The cost of purchasing electricity and natural gas, such as in some compressed air energy storage (CAES) systems, are included in the variable costs. Storing curtailed renewable energy will be important for future energy system, specifically large storage systems, as these periods offer negative energy pricing. This is especially advantageous for storage systems with high variable costs.

3. Findings

What is the levelized cost of potential future energy storage systems?

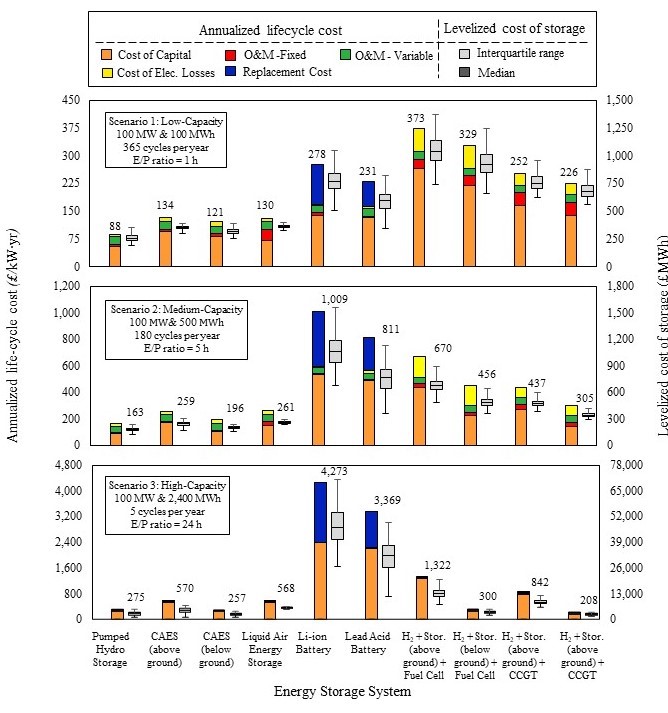
Three capacity scenarios are used to highlight trends in opting for larger storage applications with longer discharge times for all ESS in Figure 2. For the low-capacity scenario (Fig. 2 top), pumped hydro storage results in the most economical ESS (£88/kW/year), followed by CAES with underground storage (£121/kW/year) and liquid air energy storage (£130/kW/year). The cost of capital contributes to the majority of the LCC for all systems and includes replacing batteries over the 30-year analysis period. In Scenario 1, hydrogen systems can be seen to have relatively high capital costs and their low round-trip efficiencies result in higher operating costs for scenarios with increased cycling.

Figure 2
Figure 2.Annualized life-cycle cost (left-axis) and levelized cost of electricity (right-axis) for all considered energy storage systems in a low-capacity scenario (top), medium-capacity scenario (middle) and high-capacity scenario (bottom). All scenarios assume a lifespan of 30 years for the capital equipment and battery replacements, an electricity cost of £45/MWh and a discount rate of 5%. The power rating (MW) and storage capacity (MWh) are indicated within the scenarios.

The cost of hydrogen ESS capital dominates the LCC due to the high-power converter costs. Therefore, with lower cycling, the levelized cost of storage (LCOS) for hydrogen storage decreases. Additionally, as the capacity for hydrogen ESS increases, underground hydrogen storage LCOS decreases significantly compared to above ground storage.

The LCOS stochastic analysis (Fig. 2 grey bars) show that all systems, except battery systems, produce a lower LCOS with higher storage capacity systems despite capital costs increasing. This is due to less frequent cycling in the Medium-Capacity scenario but greater overall load hours offsetting the increase in the cost of capital.

These results conclude that low cycling and high-capacity results in the lowest cost of hydrogen storage, whereas pumped hydro, CAES, or liquid air offer the lowest LCOS in a range of cycling and capacity scenarios, which is necessary for resilient ESSs.

What is the operating profit potential for hydrogen energy storage systems in wholesale markets?

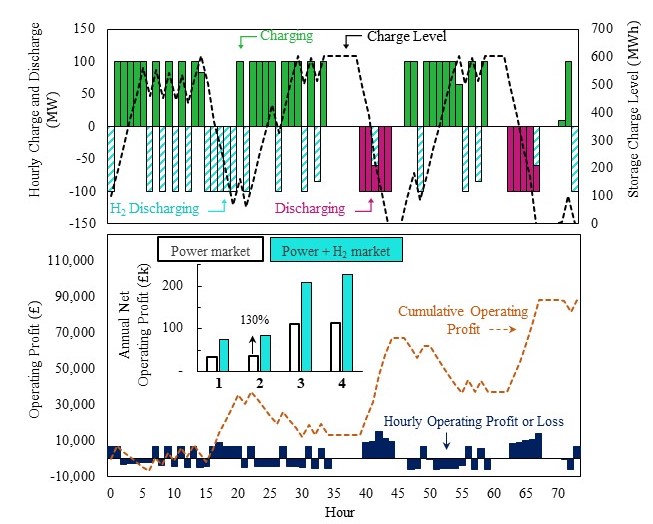
Fig. 3 shows the dispatch profile of the hydrogen and CCGT system with underground storage, illustrating how the model incorporates wholesale electricity prices (Fig. 3 top) when provided with foresight to UK wholesale electricity prices. It allows for maximizing profitability by dictating charging and discharging events (Fig. 3 middle) over 72 hours. Hydrogen systems are also given the option to discharge hydrogen (Fig. 3 middle) at a price of £50/MWh, in-line with levelized hydrogen production estimates from steam methane reforming (SMR) (International Energy Agency 2019). The accompanying cumulative profit plot (Fig. 3 bottom) shows the hourly profit or loss as bars, which the model seeks to maximize at the end of the specified time length.

Figure 3
Figure 3.Wholesale electricity price (top figure) used for validation of hourly charge and discharge are shown (left-axis) with total storage charge level (right-axis) indicated by the black dotted line over the course of 72 hours (middle figure). Profit optimization modelled results for cumulative operating profits and hourly operating profit and losses are shown over same 72 hours (bottom). The inset in the bottom figure shows annual net operating profit for hydrogen ESS with access to energy markets (white) and access to hydrogen and energy markets (blue) for 1) H2 with storage above ground and fuel cell, 2) H2 with storage below ground and fuel cell, 3) H2 with storage above ground and CCGT, and 4) H2 with storage below ground and CCGT.

The inset in Fig. 3 (bottom) shows hydrogen-based storage systems to contribute to hydrogen energy systems in the optimization model (blue bars), compared against revenues solely operating in electricity markets (white bars). All stored electricity is also fully discharged at the end of the specific time length to ensure that the model maximizes the total operating revenue rather than solely storage revenue.

Hydrogen systems increase their profitability when selling electrolyzed hydrogen into the hydrogen market, avoiding the efficiency loss of converting the stored hydrogen back into electricity. Fig 3 (middle) shows the difference in participation of stored hydrogen in either electricity markets (pink bars) or in hydrogen markets (blue hatched). The model opts to participate in the hydrogen market at a much higher frequency than the electric energy market due to the high cost of energy conversion of hydrogen to electricity. Only with high wholesale electricity cost (Fig. 3 top) will there be a profit of selling stored hydrogen back to an electric market.

The fuel-cell systems (categories 1 and 2 in Fig. 3 bottom insert) had a 120% increase in revenue for the above-ground storage system, and a 130% increase for the below-ground storage system when participating in the hydrogen markets. This limits the profitability potential of stored hydrogen, the energy markets it can participate in, and the overall ability to contribute to a resilient energy market. This concludes that the profitability potential of hydrogen storage systems, even with revenue stacking, is limited to restricted or niche hydrogen markets. The potential for operating hydrogen energy storage systems profitably is low.


Acknowledgements

The authors would like to acknowledge the Centre for Sustainable Road Freight 2018-2023 (EP/R035199/1) for funding this research.

Submitted: January 27, 2023 AEST

Accepted: June 24, 2023 AEST

References

Cutter, Eric, Ben Haley, Jeremy Hargreaves, and Jim Williams. 2014. “Utility Scale Energy Storage and the Need for Flexible Capacity Metrics.” Applied Energy 124 (July):274–82. https:/​/​doi.org/​10.1016/​j.apenergy.2014.03.011.
Google Scholar
Díaz-González, Francisco, Andreas Sumper, and Oriol Gomis-Bellmunt. 2016. Energy Storage in Power Systems | Wiley. https:/​/​www.wiley.com/​en-us/​Energy+Storage+in+Power+Systems-p-9781118971291.
Google Scholar
Dunn, Bruce, Haresh Kamath, and Jean-Marie Tarascon. 2011. “Electrical Energy Storage for the Grid: A Battery of Choices.” Science 334 (6058): 928–35. https:/​/​doi.org/​10.1126/​science.1212741.
Google Scholar
energy.gov. 2022. “Biden-Harris Administration Announces Nearly $350 Million For Long-Duration Energy Storage Demonstration Projects.” https:/​/​www.energy.gov/​articles/​biden-harris-administration-announces-nearly-350-million-long-duration-energy-storage.
Evans, Annette, Vladimir Strezov, and Tim J. Evans. 2012. “Assessment of Utility Energy Storage Options for Increased Renewable Energy Penetration.” Renewable and Sustainable Energy Reviews 16 (6): 4141–47. https:/​/​doi.org/​10.1016/​j.rser.2012.03.048.
Google Scholar
gov.uk. 2022. “Energy Storage Backed with over £32 Million Government Funding.” https:/​/​www.gov.uk/​government/​news/​energy-storage-backed-with-over-32-million-government-funding.
International Energy Agency. 2019. “Global Energy and CO2 Status Report.” https:/​/​www.iea.org/​geco/​emissions/​.
Karellas, S., and N. Tzouganatos. 2014. “Comparison of the Performance of Compressed-Air and Hydrogen Energy Storage Systems: Karpathos Island Case Study.” Renewable and Sustainable Energy Reviews 29 (January):865–82. https:/​/​doi.org/​10.1016/​j.rser.2013.07.019.
Google Scholar
Moseley, Patrick T., and Jurgen Garche. 2014. Electrochemical Energy Storage for Renewable Sources and Grid Balancing. Edited by Patrick T. Moseley and Jurgen Garche. 1st ed. Elsevier. https:/​/​www.elsevier.com/​books/​electrochemical-energy-storage-for-renewable-sources-and-grid-balancing/​moseley/​978-0-444-62616-5.
Google Scholar
National Grid ESO. 2021. “Welcome to Balancing Services .” https:/​/​www.nationalgrideso.com/​industry-information/​balancing-services.
NordPool. 2020. “N2EX Day Ahead Auction Prices.” https:/​/​www.nordpoolgroup.com/​Market-data1/​GB/​Auction-prices/​UK/​Hourly/​?view=table.
Punys, Petras, Raimundas Baublys, Egidijus Kasiulis, Andrius Vaisvila, Bernhard Pelikan, and Janusz Steller. 2013. “Assessment of Renewable Electricity Generation by Pumped Storage Power Plants in EU Member States.” Renewable and Sustainable Energy Reviews 26 (October):190–200. https:/​/​doi.org/​10.1016/​j.rser.2013.05.072.
Google Scholar
Zakeri, Behnam, and Sanna Syri. 2015. “Electrical Energy Storage Systems: A Comparative Life Cycle Cost Analysis.” Renewable and Sustainable Energy Reviews 42 (February):569–96. https:/​/​doi.org/​10.1016/​j.rser.2014.10.011.
Google Scholar

This website uses cookies

We use cookies to enhance your experience and support COUNTER Metrics for transparent reporting of readership statistics. Cookie data is not sold to third parties or used for marketing purposes.

Powered by Scholastica, the modern academic journal management system