1. Questions
-
When asked about traffic restrictions, what level of delay do people say they would tolerate in order to see possible “benefits”?
-
Do those attitudes vary depending on the “benefit” in question?
-
To what extent do attitudes vary by socio-demographic group and by type of trade-off?
2. Methods
In June 2021, we ran an online omnibus survey with a socio-demographically representative sample of slightly over 2,000 UK-based adults aged 18+.
There were four questions testing respondents’ willingness to accept delays to everyday car journeys in exchange for four local “benefits” – reduced NO2 emissions; reduced greenhouse gas (GHG) emissions; increased walking and cycling; reduced vehicular traffic.
We carried out some simple graphing of the raw results then processed the data to support statistical modelling. In many cases, demographic categories were collapsed to allow sufficient sample sizes (see supplemental information).
A series of binomial regression models were executed to estimate the association between different socio-demographic characteristics and willingness to accept a delay. Three models were created for each “benefit”: a) a model including most demographic variables; b) a best-fit model; c) a multi-level model with fixed effects for each region. The aim was to understand which attributes drive respondents to accept delays in exchange for each of the different “benefits”. See supplemental information for a summary.
3. Findings
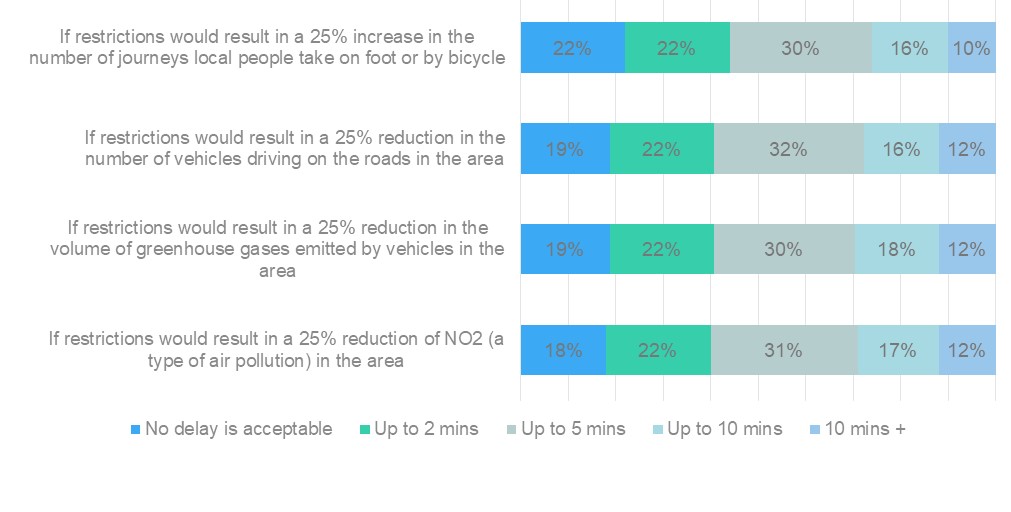
Response patterns are broadly similar across the four “benefits”, with a large majority apparently ready to accept some delay (Figure 1). There is somewhat less acceptance of delay in exchange for increased active travel.

Gender
Women were more likely than men to accept delays in return for all “benefits”, with a high level of confidence in all except “fewer vehicles” (Table 1). For example, 82% of women would accept a delay for increased active travel compared to 75% of men. In every regression model, being a woman rather than a man was a statistically significant (p<0.05) positive predictor of accepting a delay, even after accounting for most other variables that could explain any differences.
Education
Higher educational attainment was associated with increased acceptance of delay - 29.4% of those educated to secondary level or equivalent rejected delay for at least one “benefit”, compared with 24.1% for those holding a Bachelor’s degree or equivalent, and with 22.5% amongst those with higher degrees (Table 2). The difference is most pronounced with respect to increased active travel. After accounting for other socio-demographic predictors, the likelihood of someone with a degree accepting delay for all “benefits” is higher (statistically significant) than someone without a degree.
Car ownership
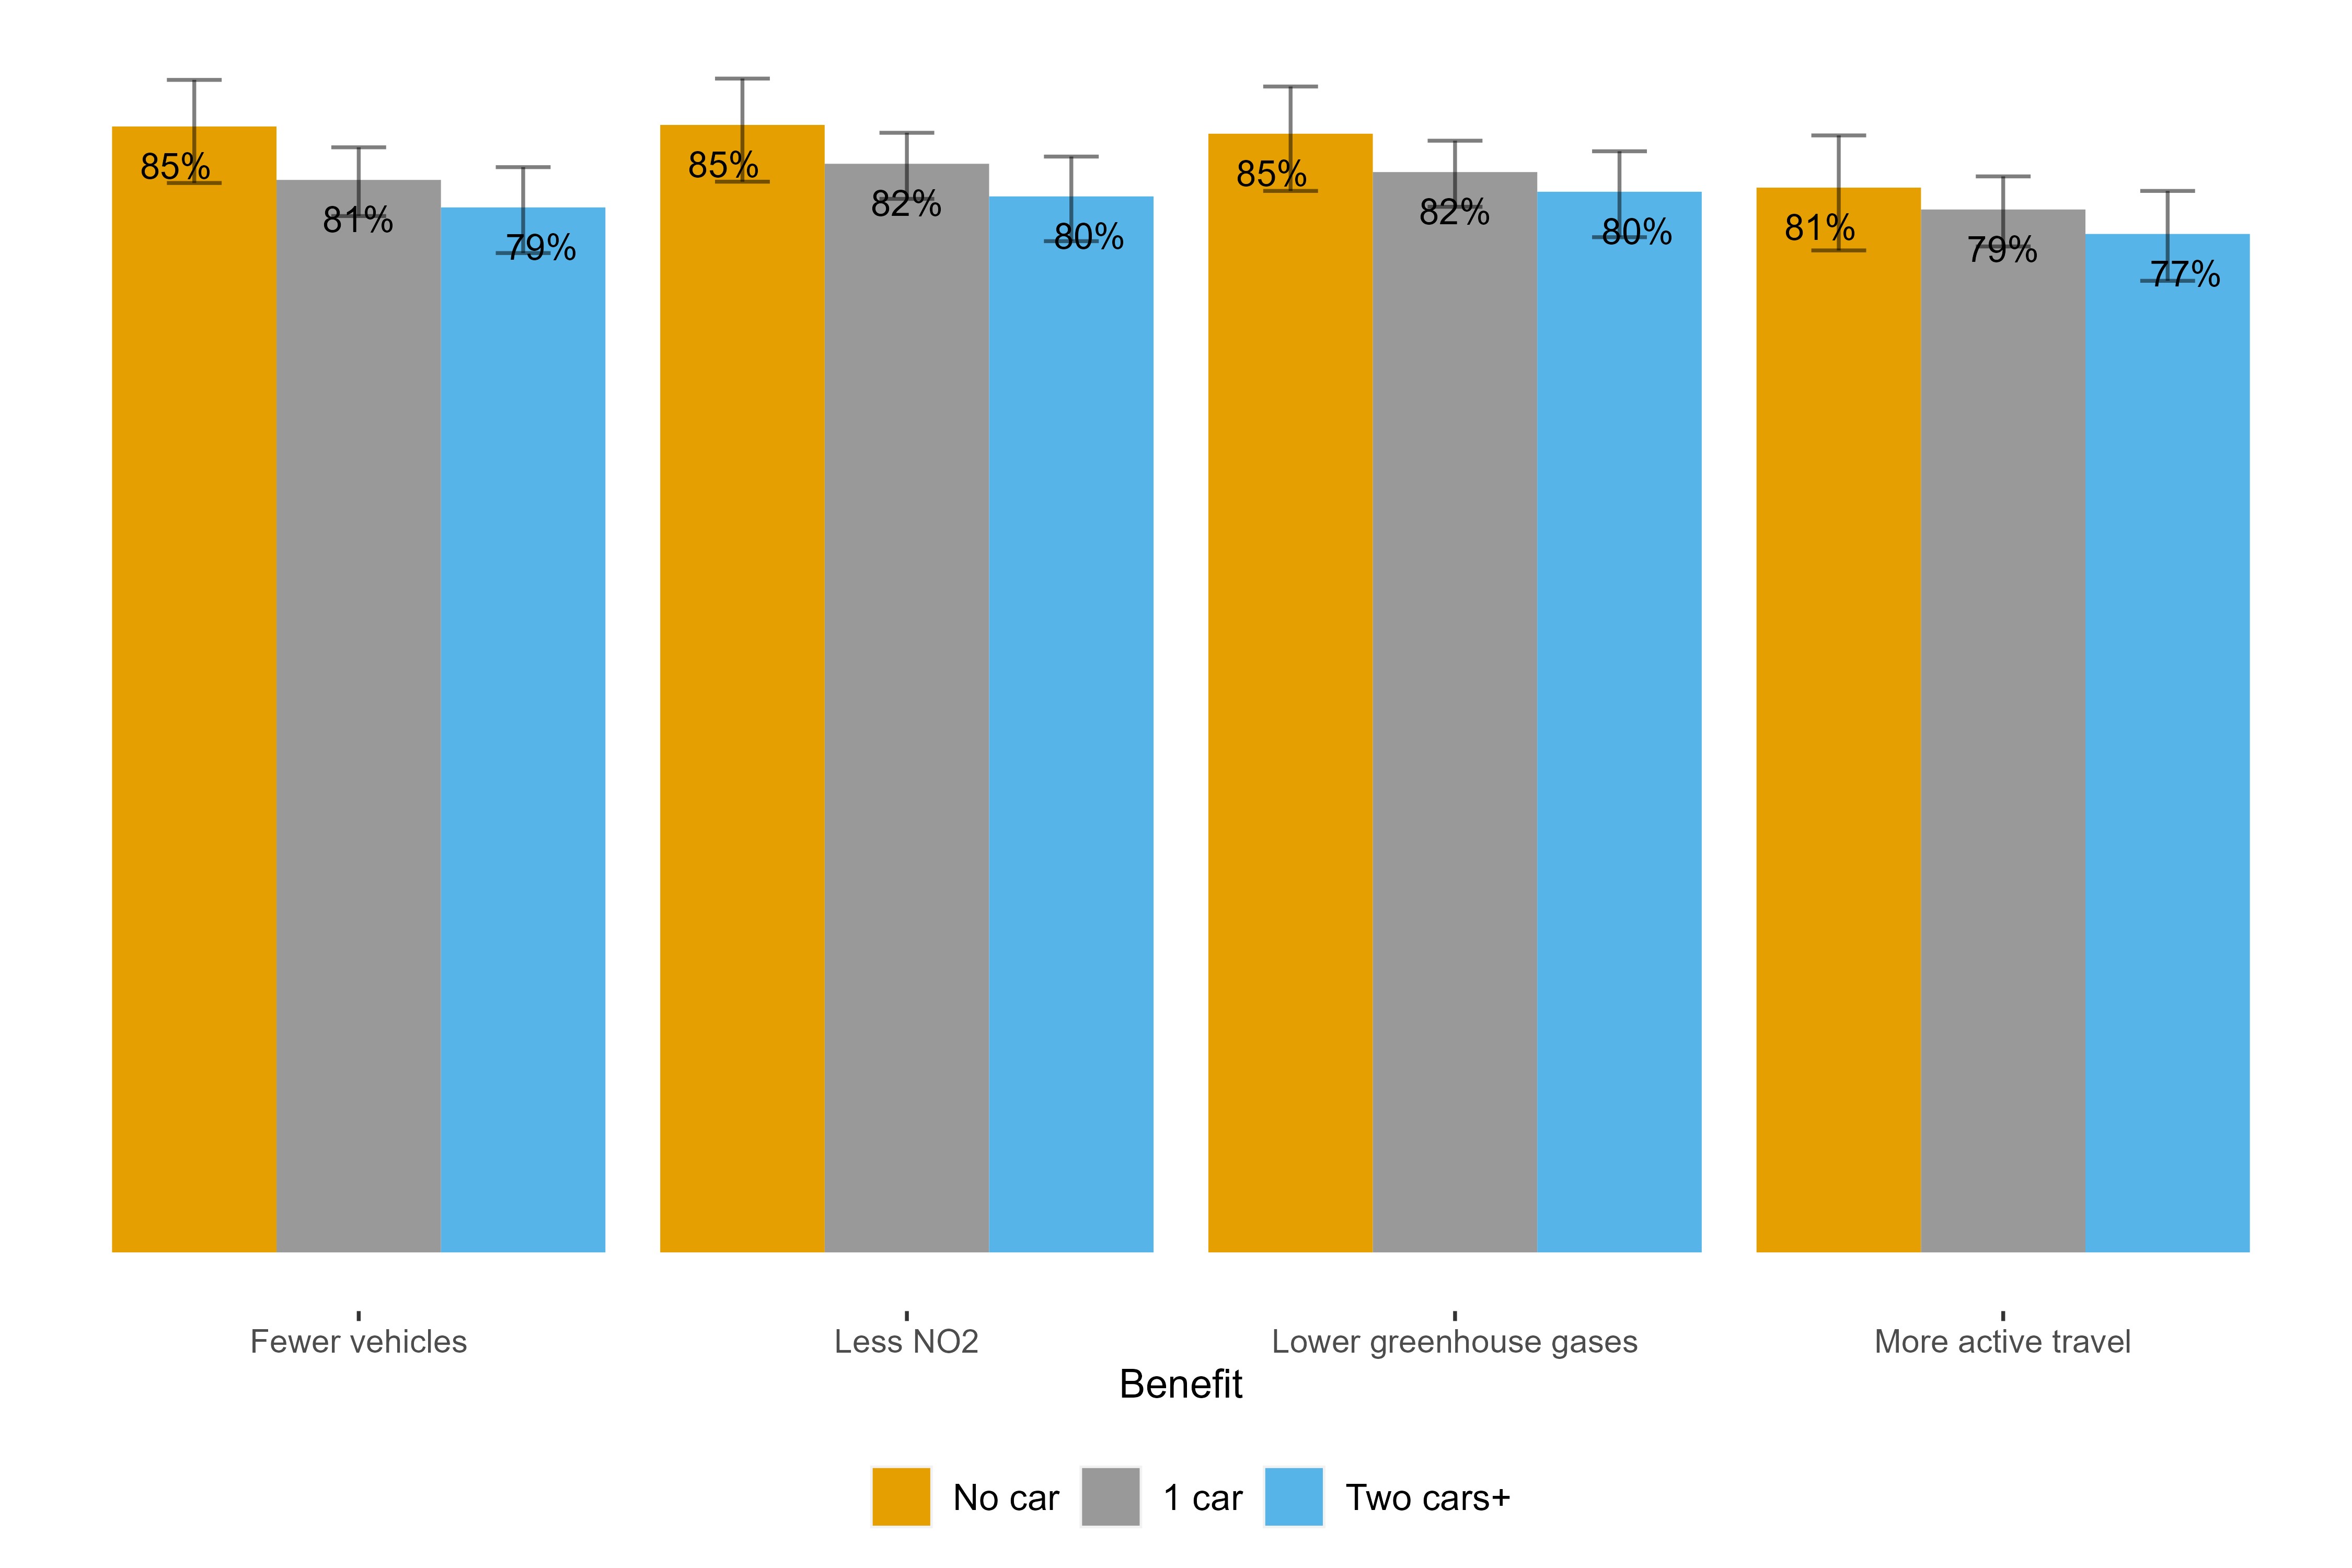
While Figure 2 shows that, for all “benefits”, survey respondents with more cars were less likely to accept a delay, the confidence intervals (95% level) show there is no certainty that this holds true in the population. In the regression models, the odds of respondents with two or more cars accepting a delay in exchange for reduced traffic was 39% lower (OR = 0.61; p = 0.0105) than for respondents without a car.

Other socio-demographic characteristics
-
Those who said traffic restrictions/management of some kind had been implemented in their vicinity were less opposed to delays if they led to a reduction in NO2, GHG emissions or vehicular traffic. The odds of someone with nearby restrictions accepting a delay to reduce GHG emissions was 31% (OR: 1.31, p = 0.0340) higher than someone without nearby restrictions, accounting for other socio-demographic characteristics.
-
Compared to being White, being Black was associated with lower odds of accepting a delay for an increase in active travel (OR: 0.42, p = 0.0097) and a reduction in GHG emissions (OR: 0.41, p = 0.0087). This was not the case for other “benefits” nor did we find statistically significant differences between any other two ethnic groups.
-
Attitudes varied across tenure categories: those renting privately were more accepting than outright home owners of delays when these were offset by reduced GHG emissions.
Several correlations were notable in not being statistically significant: age, whether or not disabled, having children, relationship status, social grade, sexuality and region were generally not significant predictors of accepting or rejecting a delay in return for each of the “benefits”. This is not to say that there were not patterns, but these specific characteristics were generally not driving the trends in the data.
Conclusion
Readiness to accept delay varies with respect to both the “benefit” expected and the characteristics of the person asked, in some cases systematically. Whilst the levels of delay acceptance are similar across the “benefits”, there are some interesting differences across demographic groups.
These findings are relevant for authorities wishing to obtain community support for planned traffic restrictions. First, they should consider promoting some “benefits” over others. Second, they are likelier to find allies amongst some segments of the community than others. Finally, if they wish to convert sceptics, our research shows which segments may be hardest to convince.
Acknowledgements
We thank colleagues at Yonder for their assistance with the survey, and Professor Rachel Aldred for her helpful advice.