
1. Questions
Nutritional resources to support low-income and food insecure residents like food pantries, resource centers, and other locations where food is freely available saw an increase in use during the SARS-CoV-2 (COVID-19) pandemic. The Regional Food Bank of Oklahoma (RFBO), a non-profit that provides food for low-income and food insecure residents through community-based partners in 53 counties in the central and western parts of the state, experienced increased demand for food throughout the pandemic. To increase access, food banks removed restrictions to allow individuals from further away to utilize services and shifted to drive-thru distribution models (RFBO, 2020; RFBO, 2021). We aim to understand how increased demand and unexpected changes to pandemic service models impacted food bank customer travel dynamics. Our work is focused on the early days of the pandemic, after the initial two-week shutdown, but before long-term food and financial assistance programs began.
Precautionary measures intended to prevent COVID-19 transmission, like contactless distribution, hindered efforts to understand changing food bank utilization patterns using surveys or interviews. As local health departments are called upon to focus resources on addressing direct health care delivery, one approach for helping to understand shifts in utilization without face-to-face interaction may be possible using contactless mobile phone location data (Khurshid et al. 2020). Mobile phone mobility data providers, such as StreetLight (SL), have been used in a variety of transport planning contexts and benchmark tests have found these data to be reliable in estimating origin-destination traffic counts, as well as the spatial and temporal distributions of trips (Alexander et al. 2015; Yang, Cetin, and Ma 2020).
The experience and choices individuals make about accessing resources like food are increasingly seen as important components of understanding place-based health outcomes (Mennis and Yoo 2018). To explore the changing nature of mobility patterns of customers at food distribution centers of RFBO immediately following the COVID-19 shutdown, we use three indicators of the spatial distribution of customers: (1) number of origin census block groups (CBGs), (2) number of trips, and (3) average distance between food distribution site and origin CBG centroids. These indicators answer the question, did the pandemic influence the spatial distribution of individuals obtaining food assistance; were more people driving farther to obtain food?
2. Methods
We obtained mobility data from StreetLight (SL) Data (streetlightdata.com), a data analytics company that captures, organizes, and deidentifies locational information from mobile phones, cellular communication towers, and navigational devices. Data provided through an educational/research license estimates community mobility patterns along roadway corridors and between specific locations. We employ Origin-Destination (OD) analysis via the online platform for the fourth week of March 2017, 2018, 2019, and 2020 to obtain trip counts via personal car between 2010 United States Census block groups (CBGs) centroids (origins), and RFBO-partner food bank locations (destinations) to understand spatial utilization patterns before and after the COVID-19 shut down in the second week of March 2020. We focus on permanent, brick-and-mortar food distribution locations for which we have address data, recognizing that many mobile emergency food pantries also opened following the onset of the pandemic. We also focus on trips by personal car as food banks shifted to drive-thru distribution models at the start of the pandemic as a health precaution (RFBO, 2020), 95% of Oklahoma households own a car, and public transportation infrastructure in the study area is limited.
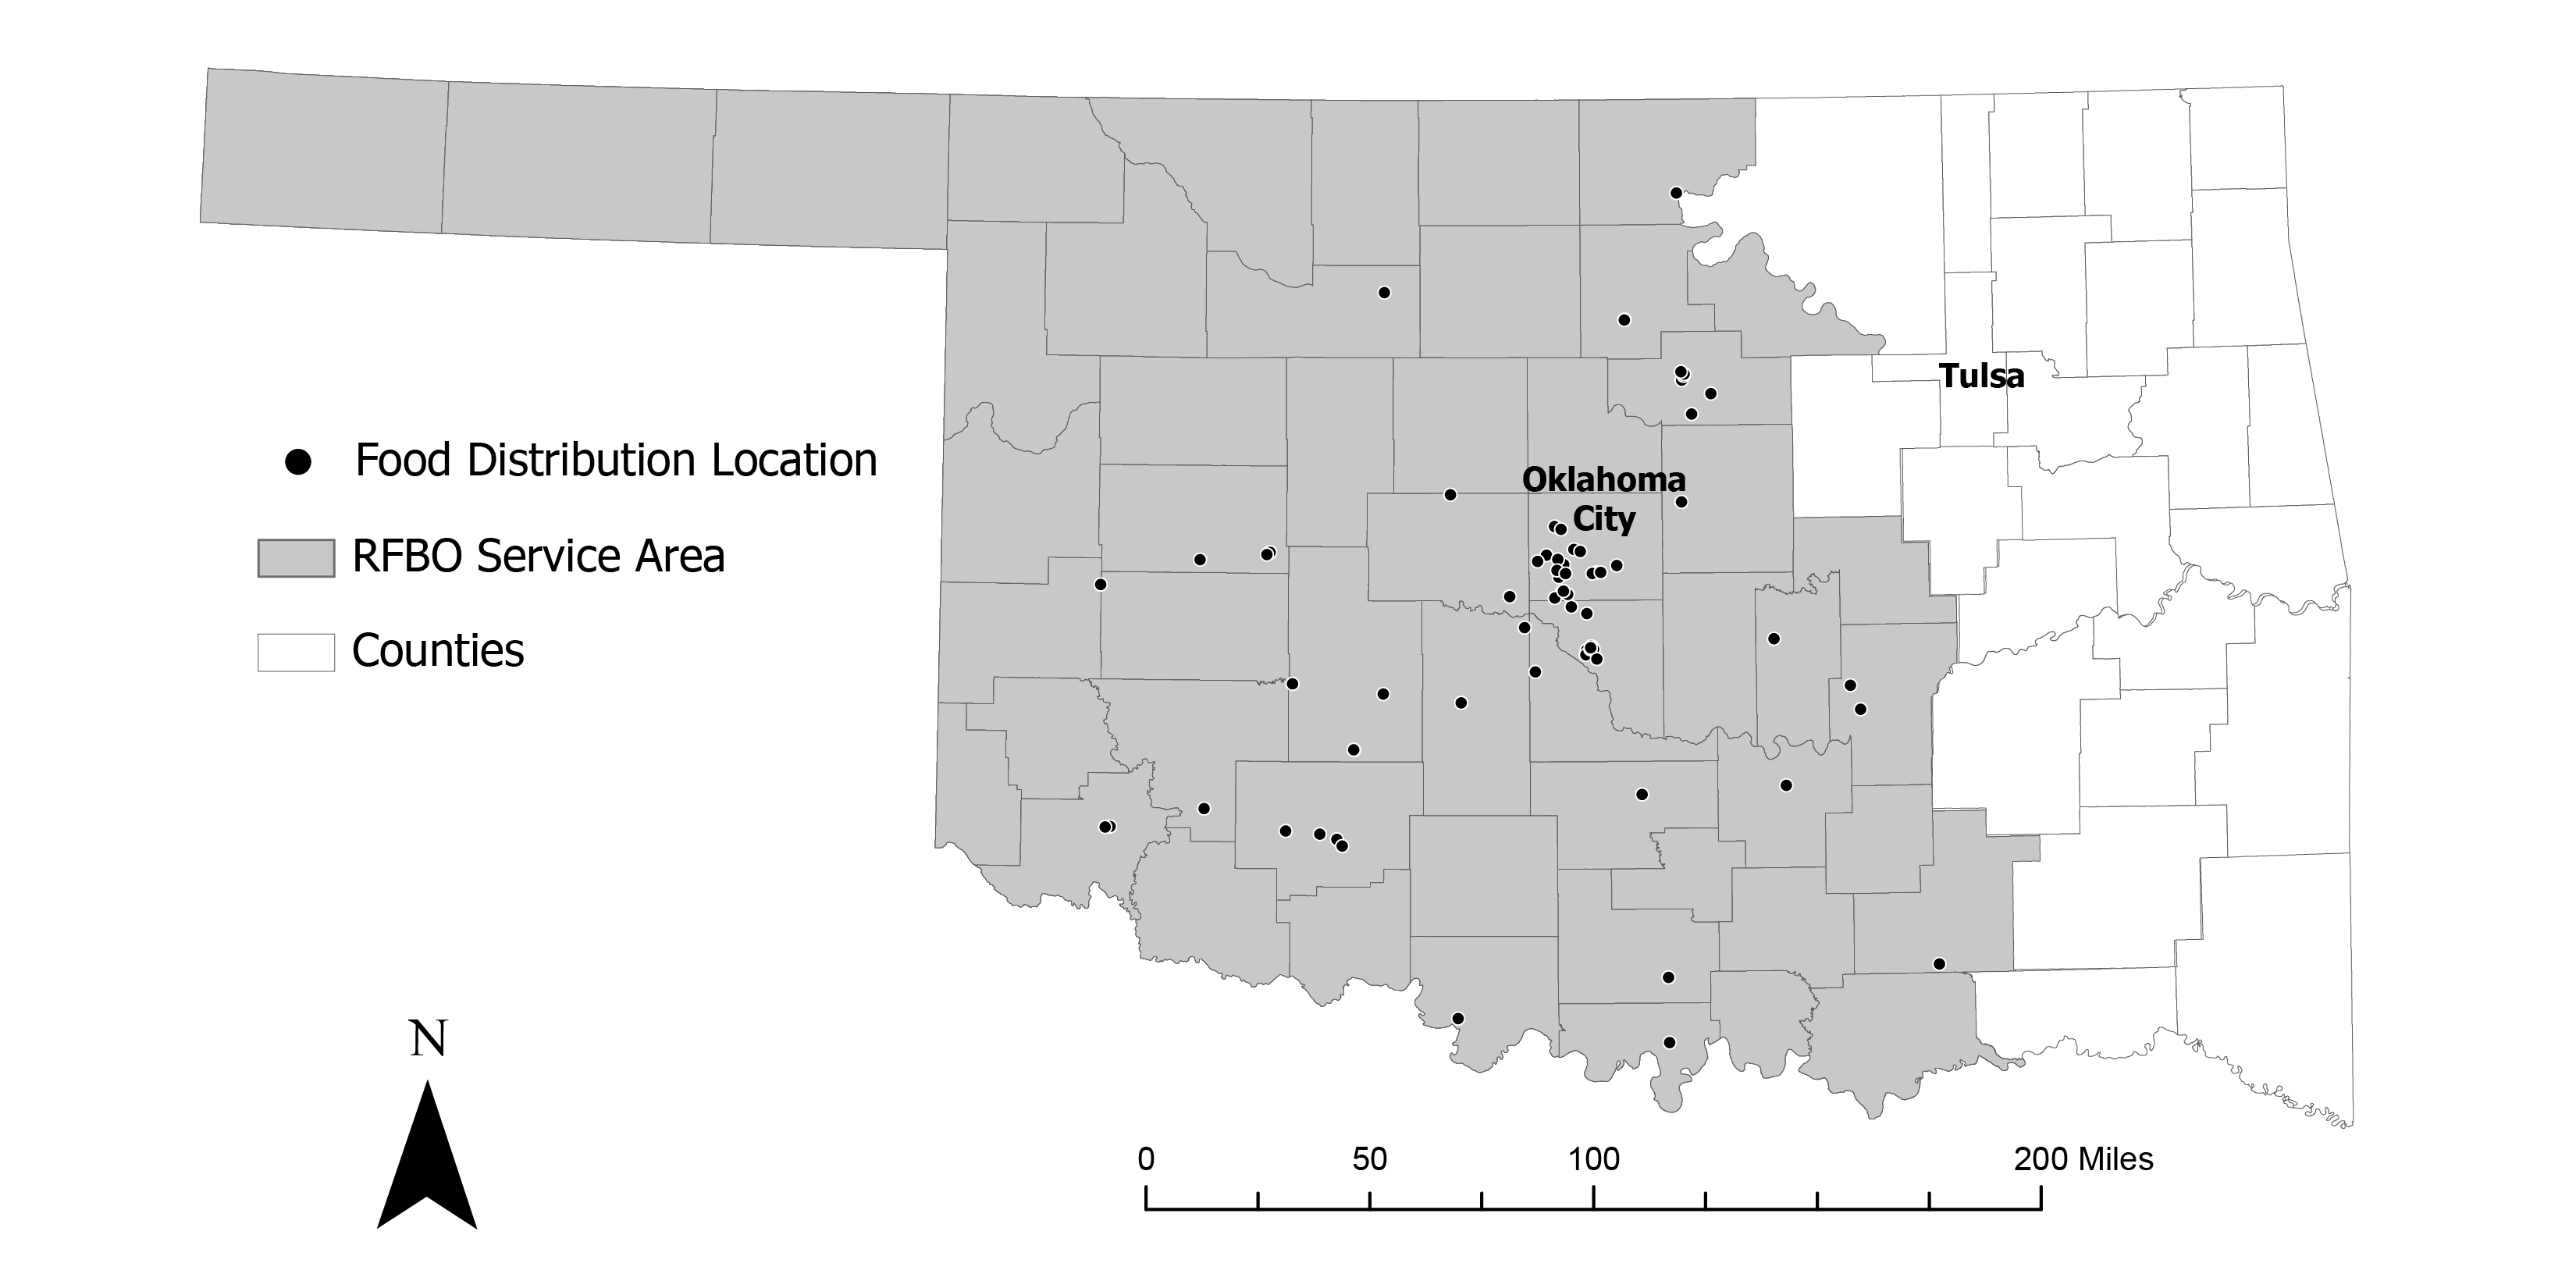
We obtained address information from the RFBO for brick-and-mortar food distribution locations in western Oklahoma (N=304). To create a panel of food banks and their associated trips data, we included locations that had SL data available for all four years (2017-2020). We do not have information on locations that closed or opened during the study period and cannot track how changes to the overall food bank landscape (due to openings and closures) impacted travel patterns. The final dataset of food banks includes 49 food distribution locations (see Figure 1). We use Google Earth to verify, geolocate, and build spatial polygons defining each food distribution location including the building and associated parking area/lot and add these polygons to the SL platform for mobility calculations.

We use Streetlight to generate OD-IDs for each unique pair of census block groups and each charitable food outlet for each year. We note that SL’s device sample size changes over time (Table 1) however there is no consistent increase in sample size over time. The total number of devices used for generating OD-IDs spiked from 2,000 in 2017 and 2018 to 6,000 in 2019 before dropping back down to 2,000 devices in 2020. Due to these changes in device counts, 2019 data may be an outlier. However, in the absence of on-road sensor data or travel survey data collected at food banks, these data provide a possible alternative form of longitudinal information on travel patterns to/from RFBO food banks.
We used trip metrics for all days and all times during each of our sample weeks. The inclusion of all parts of the day may lead to an overestimation of food bank trips since food banks are not open 24/7. However, all food banks have different hours. In addition to trip counts, SL also reports trip attributes including average trip duration and average trip length. We constrained our analysis to only include personal automobile trips originating at a home. We cleaned downloaded data and merged across time periods on each of the OD-IDs to create a panel of trip counts between each origin CBG and destination food bank in the dataset. These data were tabulated using STATA 16.1, mapped using ESRI ArcGIS Pro 10.8 and formatted using Adobe Illustrator 2020.
3. Findings
During the final week of March 2020, aggregate automobile trips to food banks decreased 37% from 2019 rates and the total number of CBGs accessing food banks decreased 18% from 2,638 CBGs in 2019 to 2,164 CBGs in 2020. This is likely reflective of an overall reduction in total VMT across all trip types in the US at that time (Kuntzman 2020). If we treat 2019 as an outlier, due to the drastic change in sample size, there is still a 42% decrease in trips but a 58% increase in the number of unique origins. These results may be suggestive of reduced overall traffic but increased spatial diversity of individuals seeking food resources during the pandemic.
From 2017 to 2020 mobile devices came from increasingly dispersed locations. Looking more closely at the two food distribution locations with the highest block group counts in 2019 reveals that in 2017, mobile device origin CBGs were all within 30 miles at one location and within 40 miles at the other location. Origin CBGs spread out steadily over time and continue to spread despite decreasing overall volume following the slowdown in March 2020 that accompanied the spread of COVID-19 (Figure 2).

Findings provide a potential way to evaluate the spatial dispersion of food pantry patrons and their mobility patterns to formulate pantry service area plans and consider areas of expansion. Simultaneously, the availability of SL-type data outpaces our capacity to utilize it, largely because these systems rely on anonymity and proprietary software (Poom et al. 2020) that make identifying food bank patrons impossible among other mobile devices and may create barriers to use by service providers with limited capacity. Additionally, such technologies may be particularly problematic within low-income communities where lack of access to sophisticated smartphone applications and data plans may result in thinner data (Yang, Cetin, and Ma 2020).
This work is limited to only include automobile trips to food banks that were open during the entire study period. Future work may look at the role of public transit (Allen and Farber 2021) and other modes, like biking and walking, as well as travel time (Swayne and Lowery 2021) to more fully understand how interruptions like the pandemic influence food pantry utilization. In the context of the early onset of the pandemic, validating SL data with travel surveys and interviews was not possible due to public health restrictions. Future research could employ a mixed-methods approach to OD data collection to include a variety of travel methods including personal cars, public transit, and active transportation. This might include anonymous SL-type data gathered directly from the mobile phones of patrons coupled with travel surveys and interviews. Integration of qualitative approaches allows for a more robust understanding of the specific temporal and situational factors that drive decision making related to health promoting behavior (McQuoid, Thrul, and Ling 2018) like the impact of COVID-19 on demand for nutritional and other social resources.
ACKNOWLEDGMENTS
We wish to thank the Regional Food Bank of Oklahoma and Streetlight for sharing data and technology that were critical to this work.