1. RESEARCH QUESTIONS AND HYPOTHESES
Shared e-scooters were first introduced in Fall 2017 and are now in hundreds of cities worldwide. What role can these play in a multi-modal transport system? In this paper, I examine some early data on e-scooter usage patterns. Specifically, does the pattern of usage suggest that e-scooters are used for transport or for recreation? How does weather affect usage? And, what is the long-term financial feasibility under current pricing models?
2. METHODS AND DATA
The data used for this analysis are from the Louisville, Kentucky open data platform (Open Data 2019). Data downloaded was from Aug 9, 2018 up till Feb 28, 2019 and included 88,042 records. Louisville, Kentucky is a mid-sized city situated along the Ohio River, with a population of about 260,000, and consolidated with Jefferson County is about 770,000. The metro area has a population of about 1.3 million.[1] The transit system has 43 bus routes and typically about 40,000 daily riders (TARC 2019). There is no rail service. The mode split for journey to work is 3% on transit and 2% walk, while 82% drive alone and 9% carpool (Louisville Metro Government 2016); typical of most US cities.
As noted on the open data website, check out times are rounded to the nearest 15 minutes and check out location geocoding is rounded to the nearest three decimal places. Various outliers are included in the data, specifically when trip distances were recorded as less than zero (set to -1) and any trip distances greater than 160.9 km (100 miles; set to 100); e-scooters have about a 40 km (25 mile) range before needing recharging. Two e-scooter companies are currently operating in Louisville, Bird (https://www.bird.co/) and Lime (https://www.li.me/), but these are not identified in the data.
Various data cleaning steps were necessary, and these are shown in Table 1. Records with trip distances of less than zero and greater than 40 km (25 miles) were removed. Latitude and longitude ranges were checked to be equivalent to about a 48-56 km radius (±0.5º for latitude and about ±0.6º for longitude) from the central area of Louisville. A large number of records had a trip duration of zero and a trip distance of zero; these were removed. Trip speeds were calculated based on duration and distance. After examining the data, I eliminated records with a speed in excess of 48.3 km (30 mph); e-scooters typically do not exceed 40 km/h, only 25 records remained between 40 km/h and 48 km/h). Long trip durations in excess of 480 minutes were removed. Finally, a large number of trips with a distance of zero were removed.[2] The dataset had missing data for one day, Oct 31, 2018.
The data was then collapsed to daily trip counts, average daily distances, and average daily speeds (a total of 203 days). Daily weather data on average temperature, average wind speed, inches of precipitation and snowfall was merged into the dataset. This data was downloaded from the US National Oceanic and Atmospheric Administration (NOAA 2019).
3. FINDINGS
Table 2 displays summary statistics. Average trip duration is 15.59 minutes and average distance is 2.14 km. Average speed is 9.13 km/h, though this likely includes time off the scooter. There are nearly 400 trips per day. Average daily minimum and maximum temperatures were -11.67º C and 29.44º C, respectively. Average wind speeds were low with the maximum being about 35 km/h. Average precipitation and snow were moderate; one day had 9.75 cm of rain. There were only 4 days with snow and 81 days with rain, 24 days with rain in excess of 1.25 cm.
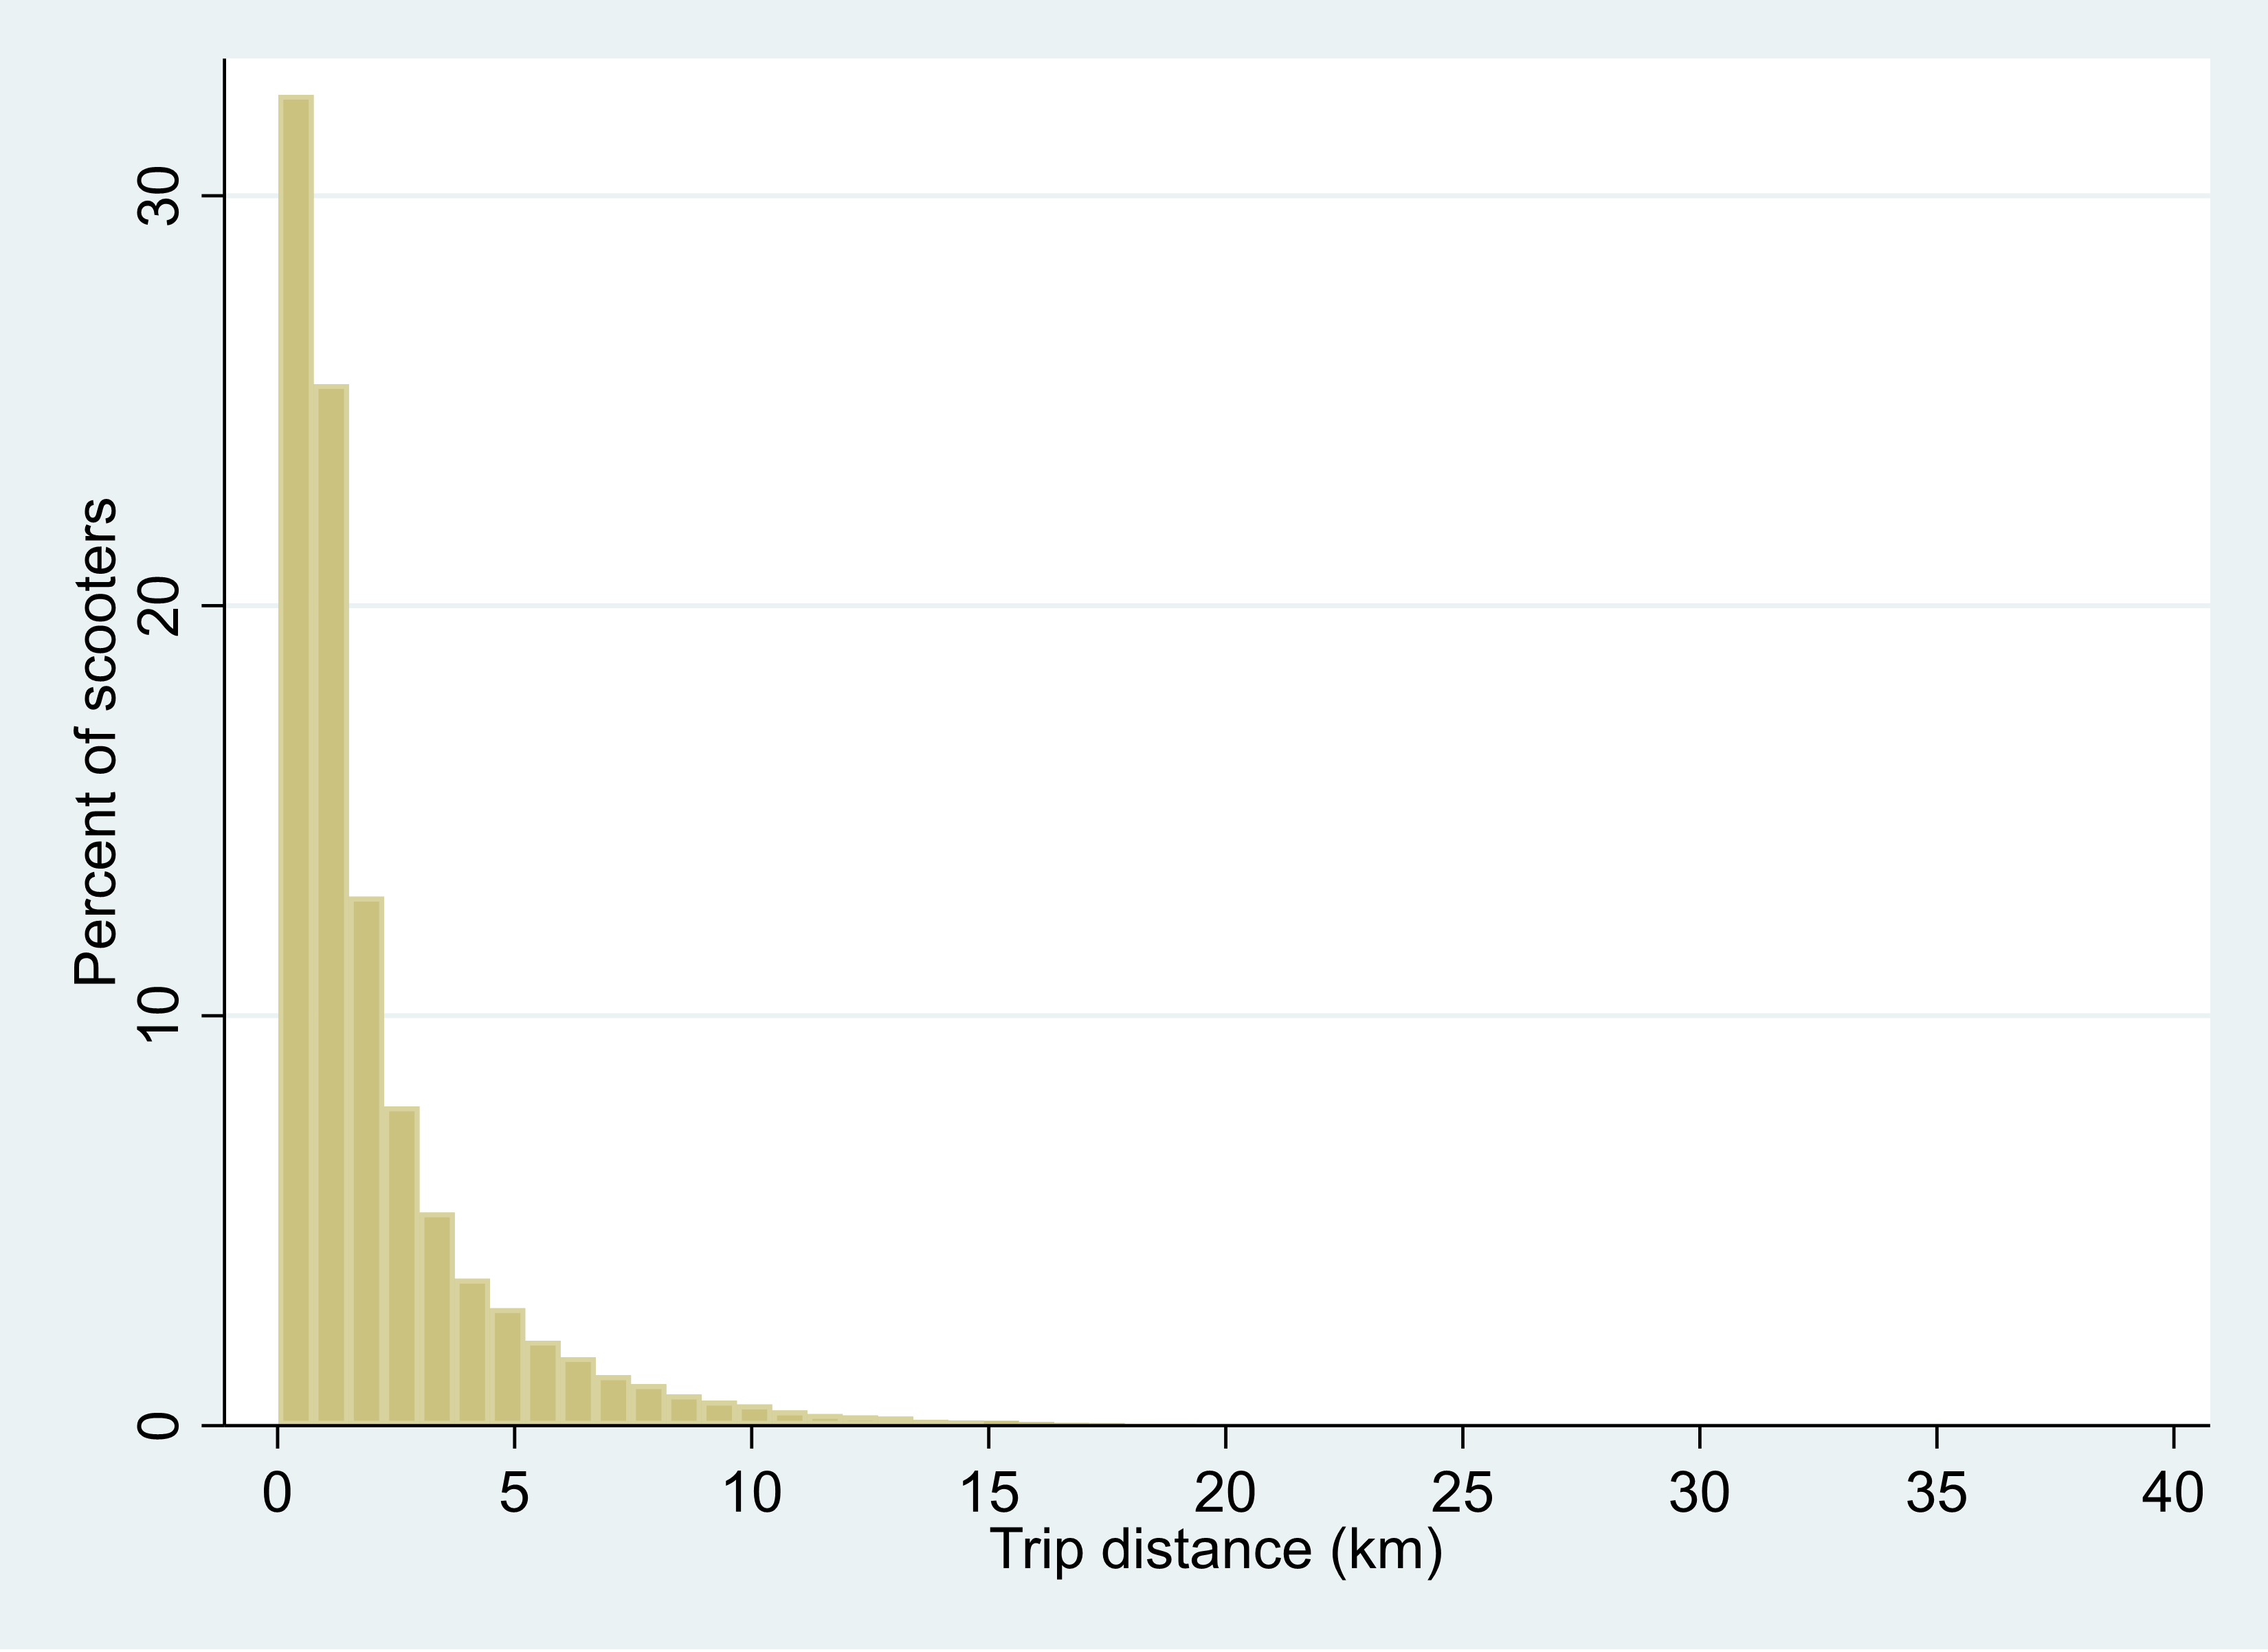
Figure 1 displays a histogram of trip distance; few trips are in excess of 10 km. Average commute times in Louisville are relatively low, with 67% of driving trips taking less than 25 minutes (Louisville Metro Government 2016). If we assume commuters who might use e-scooters travel at 25 km/h, this would be a 20-minute commute, within the range of an e-scooter trip.
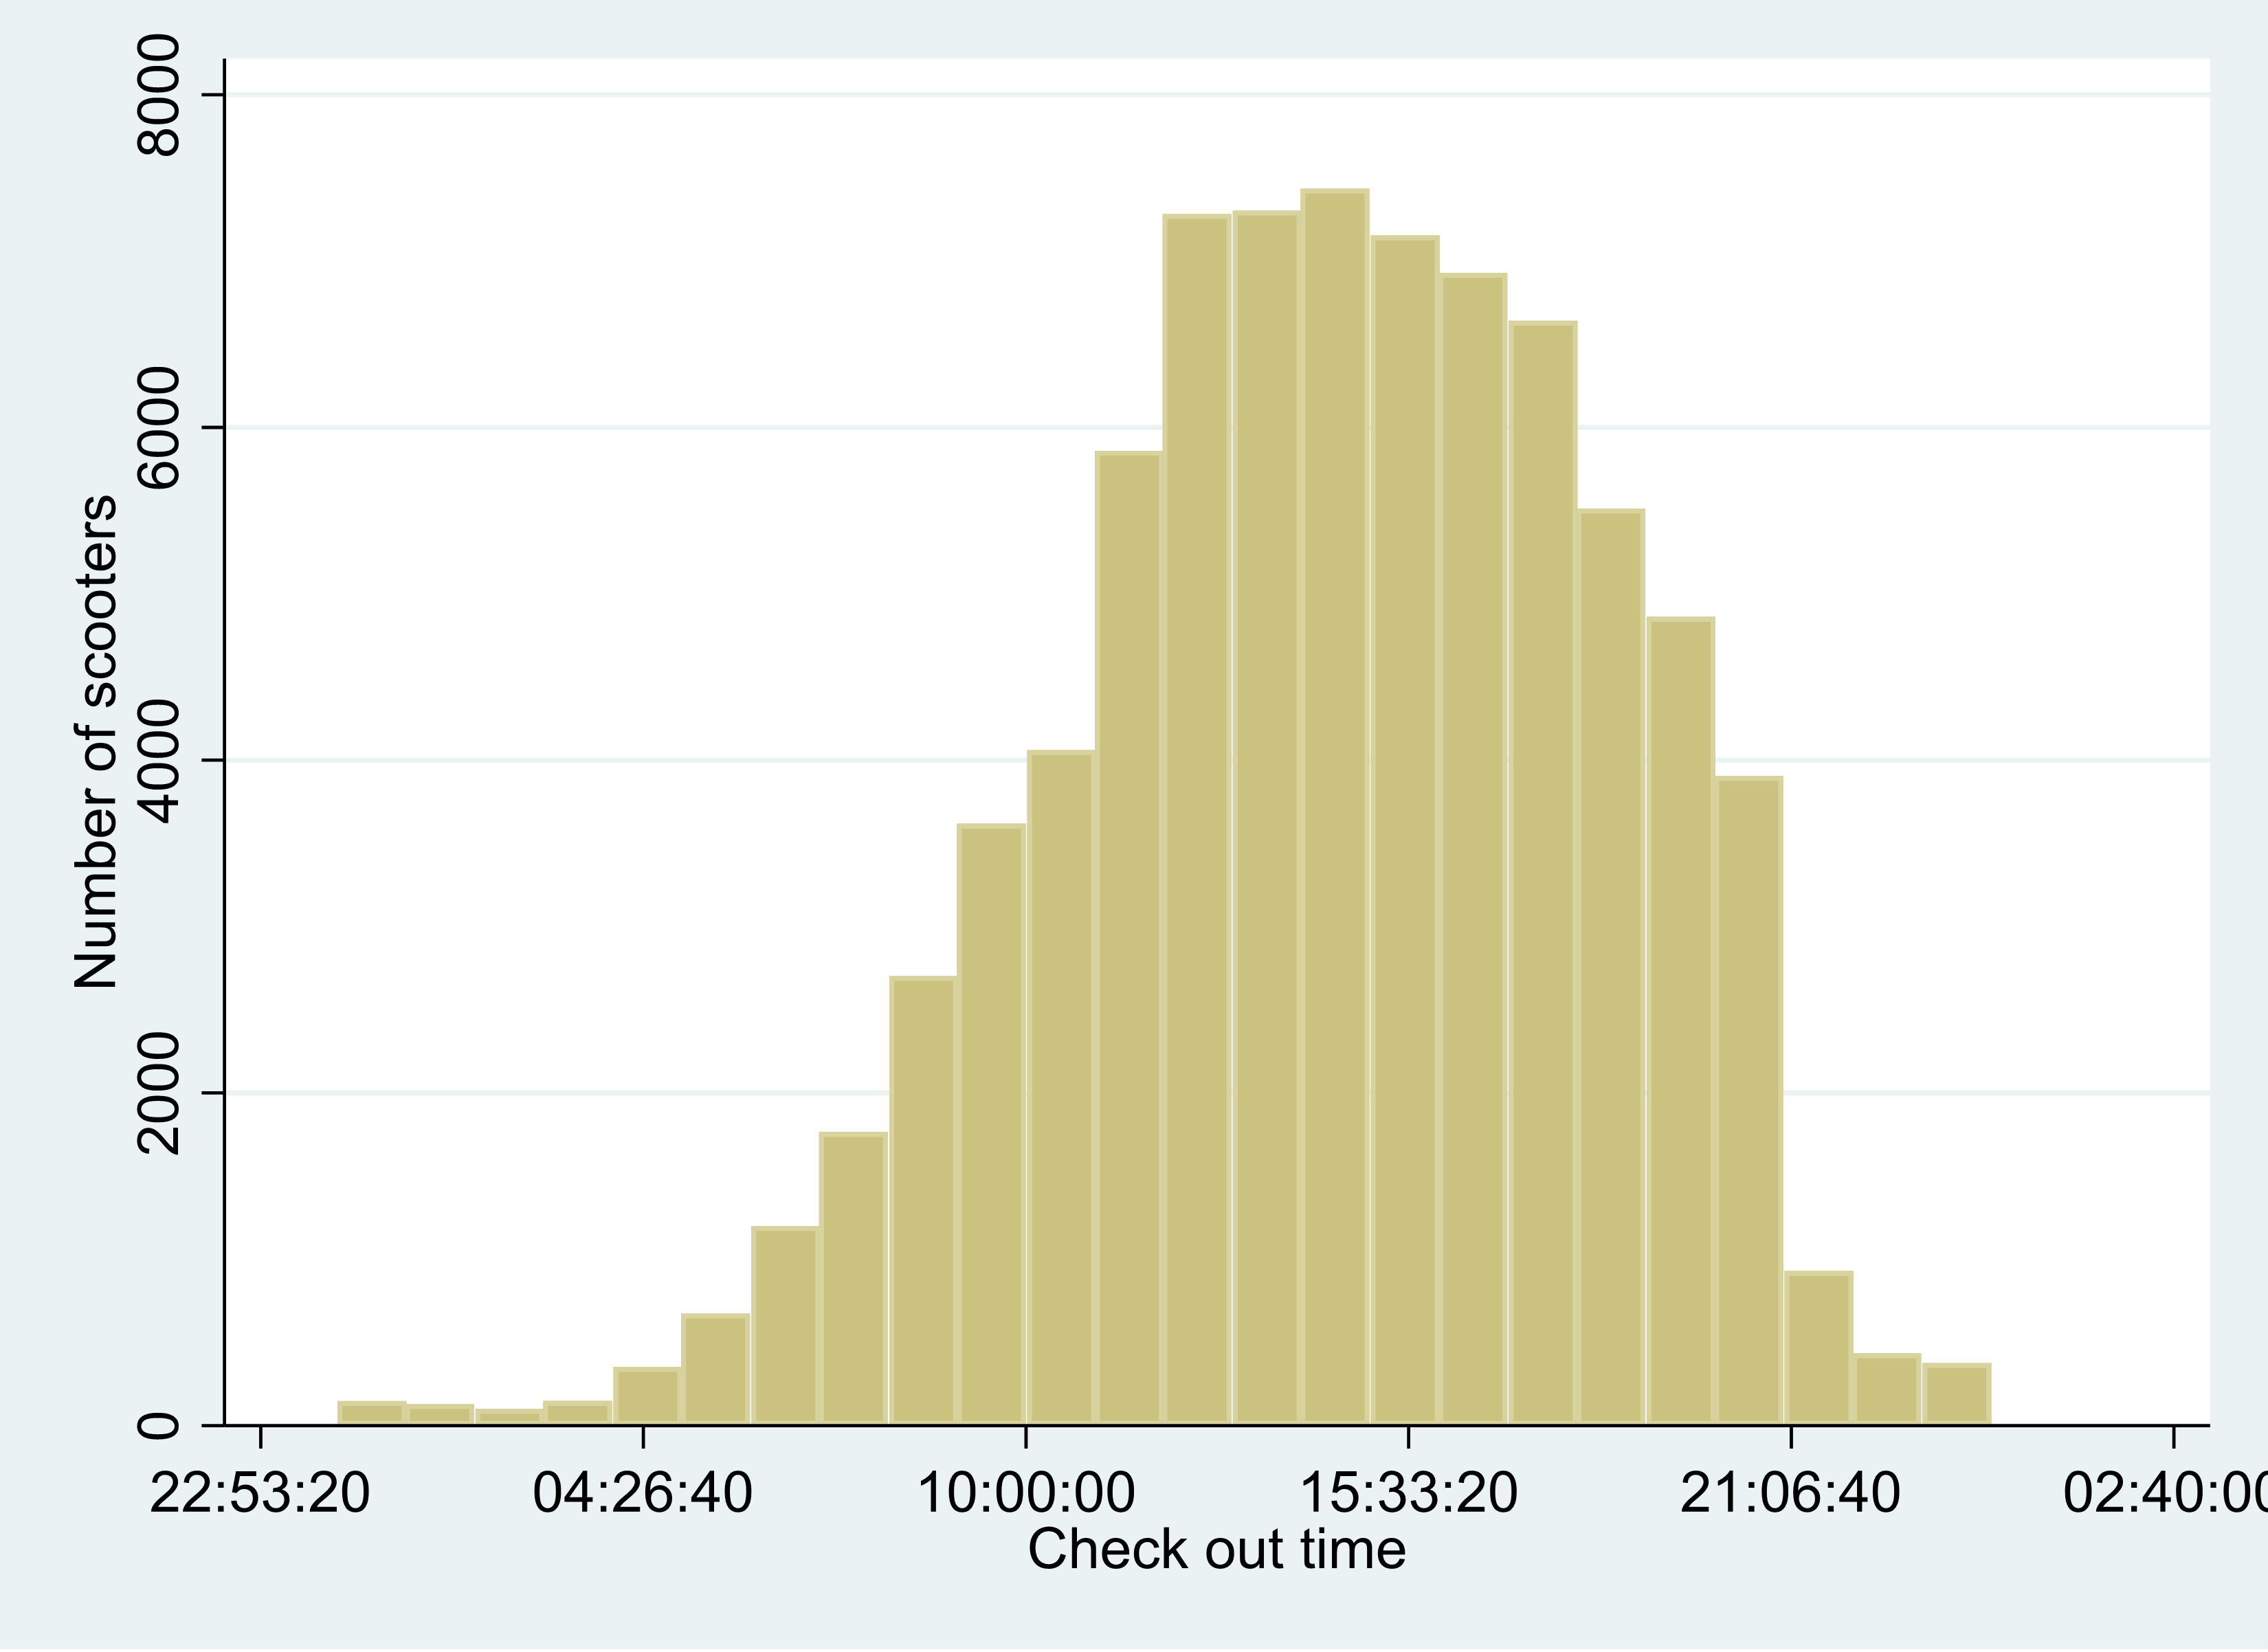
A histogram of daily counts versus check out time is shown in Figure 2. This does not show the type of bi-modal peaking pattern one would expect to see with commute trips, suggesting that e-scooters may be used recreationally or for short trips between destinations in the city. Analysis of bikeshare systems has found that casual users tend to have a similar non-commute trip pattern (Noland, Smart, and Guo 2016).

Regression results, shown in Table 3, support the conclusion that e-scooters are used for recreation. Usage is substantially higher on Saturday with nearly 183 more trips on average per day (compared to Monday). Sunday trips are similar to other days of the week. Average trip distances are longer on both Saturday and Sunday compared to other days of the week and average speeds are lower.
Weather also affects e-scooter usage. Increases in wind speed does not affect the number of trips taken but does slightly reduce distance of trips. Rain and snow both reduce daily trips, with distance also reduced when it rains (by 0.06 km per cm of rain). For snow there is no association with distance and speed. Temperature has no impact on the number of trips, but higher temperatures are associated with longer distances and faster speeds. For bikeshare programs, wind and rain reduce trips as do low temperatures, so e-scooters are less sensitive to temperature than bikeshares (Gebhart and Noland 2014).
Current pricing for both Bird and Lime scooters is a $1.00 check out fee plus $0.15 per minute. As our average trip duration is 15.59 minutes, this comes to an average cost of $3.40 (assuming the minutes are rounded up). This is more than a local bus trip, which is $1.50 (with a smart card, $1.75 without).[3] For all the trips in our cleaned data set, the total revenue comes to $101,875.85 or $501.85 per day over the 203 days of downloaded data.
https://en.wikipedia.org/wiki/Louisville_Kentucky and http://www.city-data.com/city/Louisville-Kentucky.html
This was done after some preliminary analysis, however, results were substantively the same even when this data was included.
https://www.ridetarc.org/fares/mytarc-fare-structure-and-faqs/