Processing math: 100%
Skip to main content
null
Findings
  • Menu
  • Articles
    • Energy Findings
    • Resilience Findings
    • Safety Findings
    • Transport Findings
    • Urban Findings
    • All
  • For Authors
  • Editorial Board
  • About
  • Blog
  • covid-19
  • search

RSS Feed

Enter the URL below into your favorite RSS reader.

http://localhost:52307/feed
Transport Findings
May 19, 2023 AEST

Can Mobility of Care be Identified from Transit Fare Card Data? A Case Study in Washington D.C.

Daniela Shuman, Awad Abdelhalim, Anson F Stewart, Kayleigh B Campbell, Mira Patel, Ines Sanchez de Madariaga, Jinhua Zhao,
Origin-Destination DataSpatial Equity Analysispublic transportgender in transportactivity patternstravel behavior
Copyright Logoccby-sa-4.0 • https://doi.org/10.32866/001c.75352
Findings
Shuman, Daniela, Awad Abdelhalim, Anson F Stewart, Kayleigh B Campbell, Mira Patel, Ines Sanchez de Madariaga, and Jinhua Zhao. 2023. “Can Mobility of Care Be Identified from Transit Fare Card Data? A Case Study in Washington D.C.” Findings, May. https:/​/​doi.org/​10.32866/​001c.75352.
Save article as...▾
Download all (3)
  • Figure 1. ODX deployment workflow in WMATA.
    Download
  • Figure 2. Gender ratio deviation from 50% women at POIs during week days.
    Download
  • Supplemental Information
    Download

Sorry, something went wrong. Please try again.

If this problem reoccurs, please contact Scholastica Support

Error message:

undefined

View more stats

Abstract

Studies in the literature have found significant differences in travel behavior by gender on public transit that are largely attributable to household and care responsibilities falling disproportionately on women. While the majority of studies have relied on survey and qualitative data to assess “mobility of care”, we propose a novel data-driven workflow utilizing transit fare card transactions, name-based gender inference, and geospatial analysis to identify mobility of care trip making. We find that the share of women travelers trip-chaining in the direct vicinity of mobility of care places of interest is 10% - 15% higher than men.

1. Questions

Studies have shown that women are more likely to travel on public transit compared to men (UN Habitat 2018). The literature indicates that women tend to interact with public transportation differently from other users (Sánchez de Madariaga 2013), having more recurring travel patterns (Gauvin et al. 2020), traveling during the off-peak, for shorter distances, and in chained trips (Los Angeles County Metropolitan Transportation Authority 2019; Ravensbergen, Fournier, and El-Geneidy 2022). Women are also more likely to be performing Mobility of care, an umbrella category that characterizes a pattern of trip-making for household responsibilities (Sánchez de Madariaga 2016; Sánchez de Madariaga and Zucchini 2019). In contrast to past studies that have quantified this travel behavior using survey and qualitative data, we examine a data-driven workflow that captures mobility of care travel behavior using fare card and geospatial data. We present the findings from a study on data from the Washington Metropolitan Area Transit Authority (WMATA).

2. Methods

Origin-Destination and Registered SmarTrip Card Data

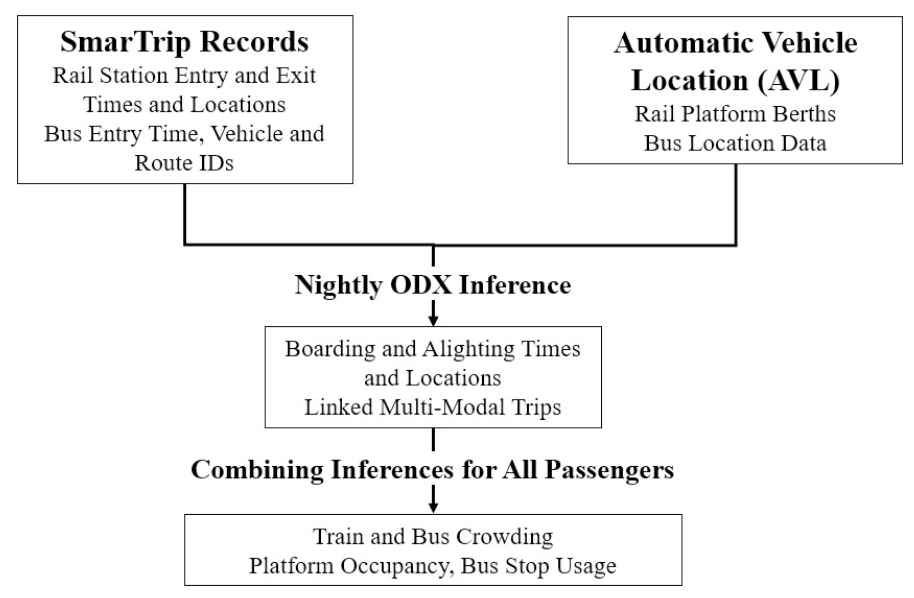
WMATA utilizes a commercial implementation of an algorithm that infers passenger origin, destination, and transfer (ODX) patterns by combining automatic fare collection and automatic vehicle location data (Sánchez-Martínez 2017; Gordon, Koutsopoulos, and Wilson 2018), illustrated in Figure 1. The dataset provided by WMATA contains the ODX information for customers using the agency’s smart fare (SmarTrip) card. Card registration is not required, hence registered users tend to be full-time employees who register their cards to receive employer subsidies. Therefore, this study focuses on analyzing travel behavior to destinations where individuals conducting mobility of care activities are expected to travel to, in spite of being on a 9-5 work schedule (e.g. accompanying children to daycare centers and schools, and going to grocery stores.)

Figure 1
Figure 1.ODX deployment workflow in WMATA.

Since the ODX dataset doesn’t include demographic information, we utilize name-to-gender inference to associate a likely gender to the name associated with a registered SmarTrip card. For ∼2 million registered cards, we end with 961,118 (50.1%) men, 892,276 women (46.6%), and 62,009 cards (3.3%) with no associated gender classification. To account for the difference in registration and inference rates, we conduct the analysis for all the women-classified cards and randomly draw a matching number of men-classified cards. This results in a 50-50 baseline ratio of women to men unique cards in our analysis.

We identified the geolocation of daycares, schools, and grocery store locations in the area, and focused our analyses only on bus journeys to allow for a more granular geospatial analysis, where we can have higher confidence in origins and destinations in the proximity of bus stops (Nabors et al. 2008), compared to metro stations that serve larger areas. We find the closest stop to each of those places of interest (POIs) for each GTFS route pattern as shown in Algorithm 1.

Algorithm 1.Identifying Bus Stops Closest to Places of Interest

Result: Sets of unique nearest stops within 400m of a POI class for all bus routes.
initialization;
POI←{ daycares, schools, grocery stores }
R←{ all bus route-direction pairs }
S←{ all bus network stops }
 for p∈POI do 
 Initiate POI class stops empty set pstops =∅
 for r∈R do 
ˆs=∅
dnearest=∞
 for s∈S do 
 if d(p,s)≤400m&d(p,s)<dnearest &s∉pstops  then 
ˆs=s
dnearest =d(p,s)
else
continue
end
end
pstops ←ˆs
end
end
return pstops 

Where d(p,s) is the euclidean distance between the geolocation of a POI and a bus stop.

Identifying Mobility of Care Travel Pattern

We observed travel patterns that were regular (unique cards traveling on the system for 10 or more separate days in quarter 1 of 2019) and with all stages (legs of a chained journey) that were only on the Metrobus system. Table 1 shows the data reduction along the processing steps.

Table 1.Dataset Processing Results
Unique Cards Total Journeys Total Stages
(thousand) (million) (million)
Full 2019 Q1 Dataset 3,012 70.56 80.02
10+ Active Days 782 55.40 64.12
On Metrobus 420 15.65 17.78
Registered w/ Gender Inference 215 7.67 8.55

We analyzed two travel patterns:

  • Case 1 (baseline analysis): Origin Bus→POIBus→ Destination

  • Case 2 (end stop analysis): Origin Bus→ POI

The first case aims to capture mobility of care conducted in a chained trip, while the latter is to capture those who may take the bus to POI and then utilize another mode of transport (walking, ride-hail, etc). Ultimately, we observe the deviation of the ratio of women riders from gender parity over the course of the day at the stops identified closest to the mobility of care destinations (∼ 9% of all stops) compared to all stops system-wide. A more detailed description of the methodology can be found in our working paper (Shuman et al. 2022).

3. Findings

The median 15-minute gender distribution at all stops shows a slight -2.10% (fewer) women boardings. While the lowest quantile sees an average of -5% women boardings in all stops and at stops identified near mobility of care POIs, higher percentiles show a significant increase in the ratio of women at mobility of care stops, which is very evident from the third quartile. While the overall 90th percentile gender ratio deviation at all bus stops was modest 1.5% more women than men, we find 15% more women near daycare centers, 11.30% near schools, and 12.5% near grocery stores.

Table 2.Statistics for Women Ratio Deviation From Gender Parity At Bus Stops
25th Percentile 50th Percentile 75th Percentile 90th Percentile
Daycares -5.70% 1.80% 9.10% 15.00%
Schools -4.50% 1.50% 6.70% 11.30%
Grocery -5.90% 1.80% 7.70% 12.50%
All -4.58% -2.10% 0.00% 1.50%

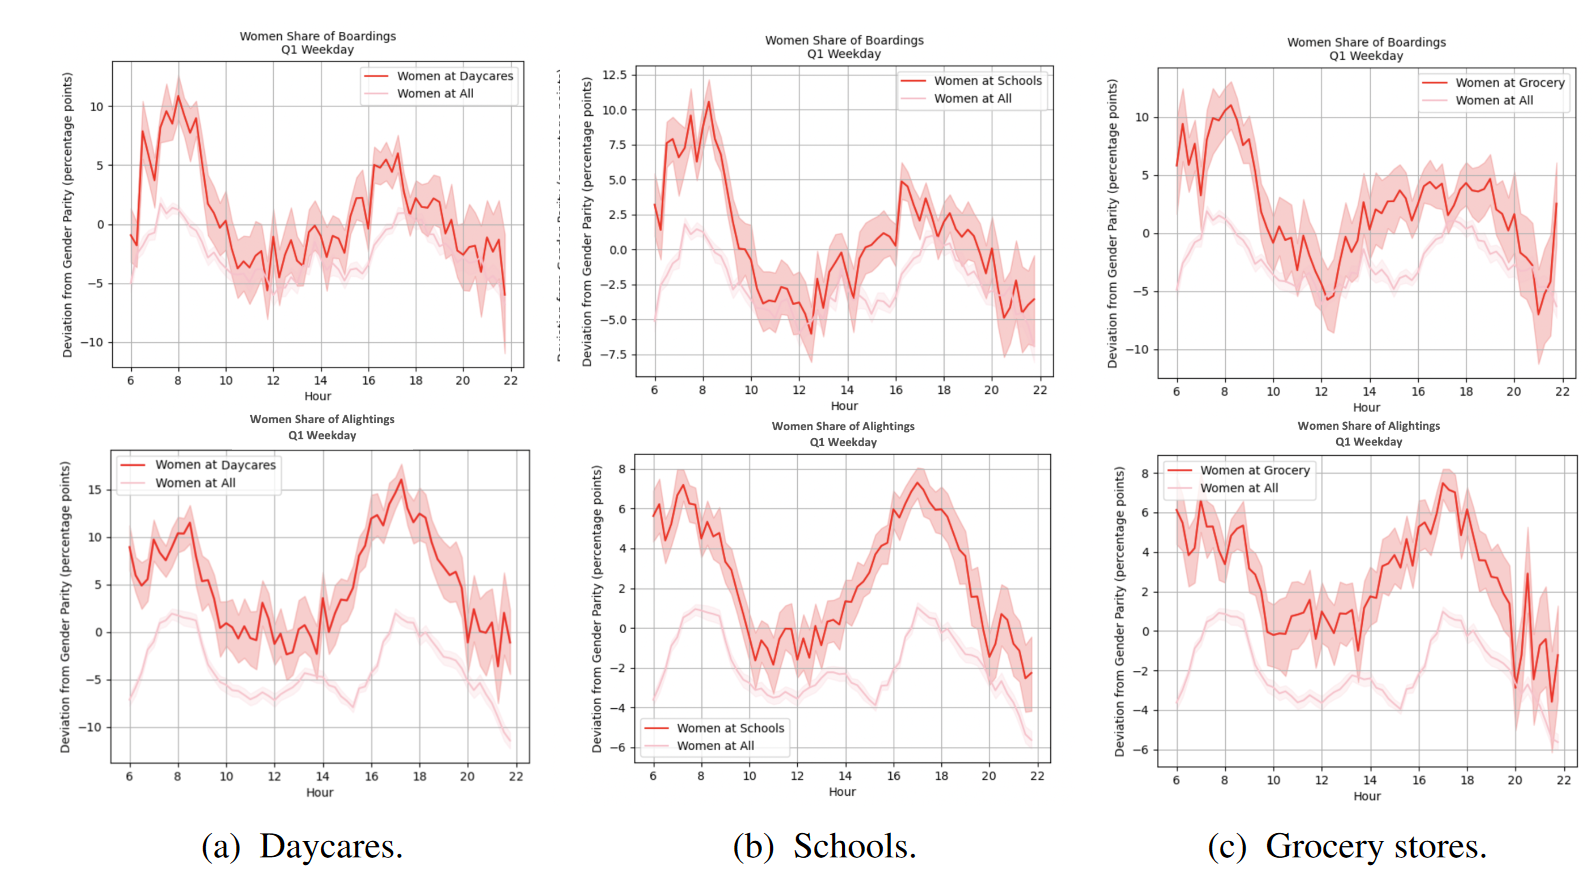
We found the average POI to nearest stop distance to be 105 meters. While not all users transferring near a POI would be patronizing it, the higher ratio of women observed at those particular POIs does indicate a higher probability of women conducting mobility of care. Figure 2 illustrates the average deviation from gender parity at POI stops compared to all bus stops for boardings on chained trips and all alightings across the day. The envelopes illustrate the 95% confidence interval across all days in the period of analysis.

Figure 2
Figure 2.Gender ratio deviation from 50% women at POIs during week days.

We find that women are more likely to trip chain or alight at stops near daycares and schools during AM drop-off and PM pick-up times. One noticeable difference between schools and daycares is that there is a narrower AM drop-off window with a steep decline beginning at 8 AM, which is the start time for DC Public School students. We observe a similar trend at grocery stores. The confidence intervals and duration of the PM peak, however, are generally wider, suggesting higher variability.


Acknowledgements

The authors would like to thank WMATA for their generous support of this project, and the MIT SuperCloud and Lincoln Laboratory Supercomputing Center for providing high-performance computing resources that have contributed to the research results reported in this paper.

Submitted: March 23, 2023 AEST

Accepted: May 13, 2023 AEST

References

Sánchez de Madariaga, Inés, and Elena Zucchini. 2019. “Measuring Mobilities of Care, a Challenge for Transport Agendas: From One to Many Tracks.” Integrating Gender into Transport Planning, 145–73. https:/​/​doi.org/​10.1007/​978-3-030-05042-9_7.
Google Scholar
Gauvin, Laetitia, Michele Tizzoni, Simone Piaggesi, Andrew Young, Natalia Adler, Stefaan Verhulst, Leo Ferres, and Ciro Cattuto. 2020. “Gender Gaps in Urban Mobility.” Humanities and Social Sciences Communications 7 (1): 11. https:/​/​doi.org/​10.1057/​s41599-020-0500-x.
Google Scholar
Gordon, Jason B., Haris N. Koutsopoulos, and Nigel H.M. Wilson. 2018. “Estimation of Population Origin–Interchange–Destination Flows on Multimodal Transit Networks.” Transportation Research Part C: Emerging Technologies 90 (May):350–65. https:/​/​doi.org/​10.1016/​j.trc.2018.03.007.
Google Scholar
Los Angeles County Metropolitan Transportation Authority. 2019. “Understanding How Women Travel.” LA Metro.
Google Scholar
Nabors, D., R. Schneider, D. Leven, K. Lieberman, C. Mitchell, et al. 2008. Pedestrian Safety Guide for Transit Agencies. United States. Federal Highway Administration.
Google Scholar
Ravensbergen, L., J. Fournier, and A. El-Geneidy. 2022. “Exploratory Analysis of Mobility of Care in Montreal, Canada.” Transportation Research Record 0 (0): 03611981221105070.
Google Scholar
Sánchez de Madariaga, Inés. 2013. “From Women in Transport to Gender in Transport: Challenging Conceptual Frameworks for Improved Policymaking.” Journal of International Affairs, 43–65.
Google Scholar
———. 2016. “Introducing New Concepts in Urban Transport.” In Fair Shared Cities, 51–66. Routledge.
Google Scholar
Sánchez-Martínez, Gabriel E. 2017. “Inference of Public Transportation Trip Destinations by Using Fare Transaction and Vehicle Location Data: Dynamic Programming Approach.” Transportation Research Record 2652 (1): 1–7. https:/​/​doi.org/​10.3141/​2652-01.
Google Scholar
Shuman, D., A. Abdelhalim, A.F. Stewart, K.B. Campbell, M. Patel, Inés Sánchez de Madariaga, and J. Zhao. 2022. “Inferring Mobility of Care Travel Behavior From Transit Origin-Destination Data.” arXiv Preprint arXiv:2211.04915.
Google Scholar
UN Habitat. 2018. “‘Mobility of Care’ – Ines Sanchez de Madariaga.”

This website uses cookies

We use cookies to enhance your experience and support COUNTER Metrics for transparent reporting of readership statistics. Cookie data is not sold to third parties or used for marketing purposes.

Powered by Scholastica, the modern academic journal management system