

1. Questions
Network theory is valuable for analyzing public transport networks and a topic of growing attention. In this sense, centrality measures have been associated with ridership at stations of urban rail transit, with degree, betweenness and closeness as the most common ones (He, Zhao, and Tsui 2019; Dai et al. 2022). For instance, passenger flows are related to centralities of both physical and service-level networks in tram systems (Luo, Cats, and van Lint 2020), while in metro systems, centralities of the physical network and the network of public transport alternatives demonstrate linear correlations with passenger flows at stations (Kopsidas, Douvaras, and Kepaptsoglou 2023b). Although network centralities seem strongly related to total passenger flows in metro networks, a weaker relation is encountered when it comes to the boarding and alighting volumes, at least at daily level (Kopsidas, Douvaras, and Kepaptsoglou 2023a). But are correlations consistently low during the day, or are there time periods with specific patterns? And if so, what can be learnt from such correlations? In addition, are there specific groups of stations with similar departure/arrival patterns? As such, it is interesting to explore the intraday fluctuations of potential correlations between station centrality and boarding/alighting volumes and classify the stations of a real-world metro system in Athens, Greece.
2. Methods
The Athens metro system is modeled as a complex network and analyzed in the Gephi visualization platform (https://gephi.org/). The system consists of 3 lines and 62 stations, with a daily ridership of about 500,000 passengers. Its corresponding network comprises 62 nodes and 128 edges. Three centralities of the L-space physical network are calculated, i.e., degree, closeness and betweenness (equations in Table 1), and ridership data are coded in hourly-based variables. Unweighted centralities are used as the simplest way to incorporate the fundamental intertemporal design of the physical network, which can capture essential ridership information from a reverse engineering point of view. Ridership data account for the 01/24/23, a representative weekday for the system. Timeslots within 07.00-00.00 are considered, when the system is fully operational. A snapshot of the dataset is presented in Table 2. Subsequently, the correlation between centralities and boardings/alightings is measured through Pearson coefficients. A Pearson coefficient is calculated for every available timeslot, correlating each time station centralities with their hourly ridership (equation in Table 1). The within-day trend of the coefficients is presented in line graphs in Figure 1.
___alightings_(b)._h.jpeg)
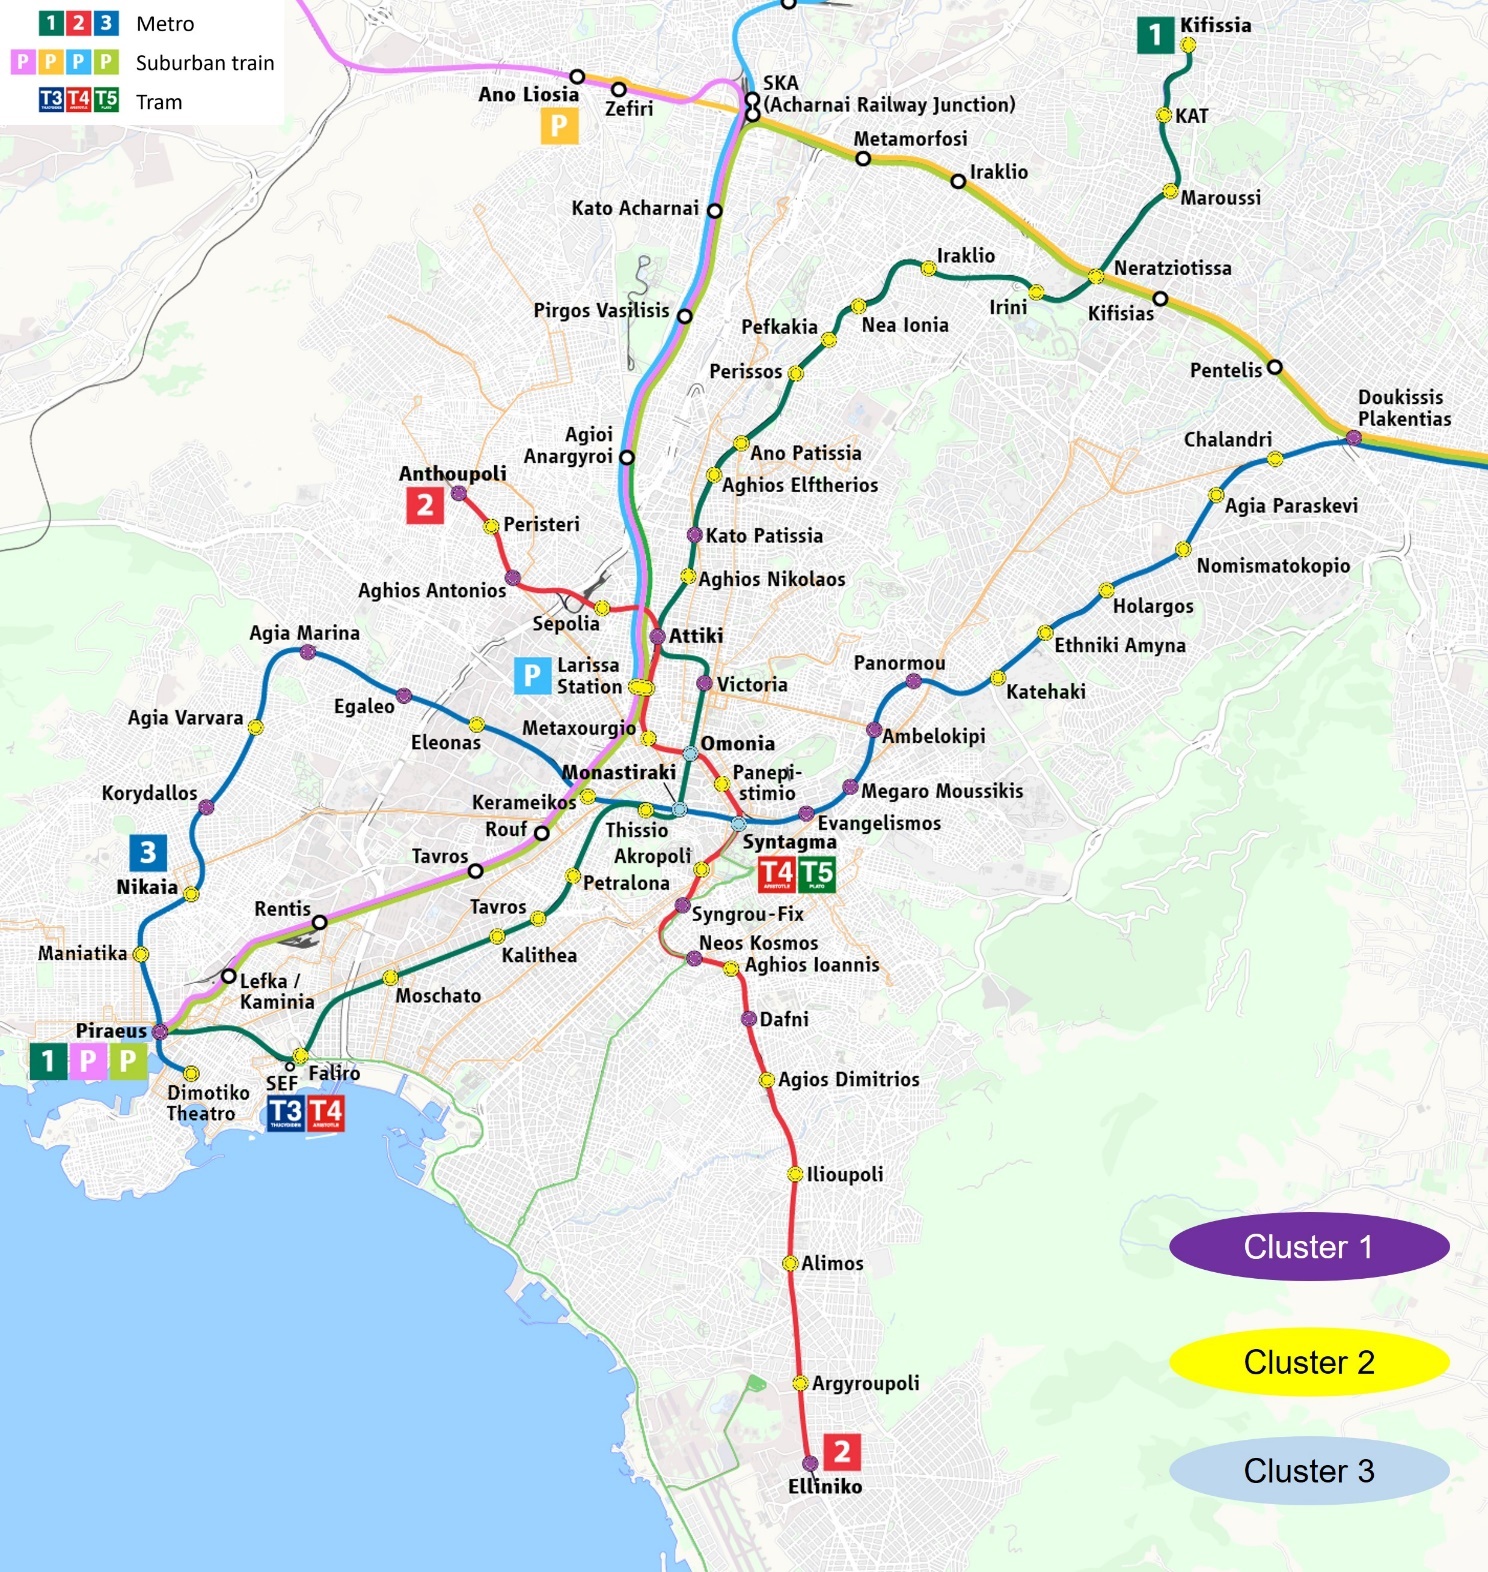
To classify the stations into groups of similar centrality and ridership patterns, a k-means cluster analysis is conducted. Prior to clustering, the data need undergo principal component analysis (PCA) twice, separately for ridership and centrality data, to achieve dimensionality reduction. The 3 highly correlated centrality measures and 34 collinear ridership variables need to be reduced in essentially fewer factors explaining most of the original variable variance. PCA is very efficient for this reason, since 76.54% of total variance regarding station centrality is captured by a single component. Accordingly, 74.72% and 18.50% of total ridership variance are captured by the first and second components, respectively. The components are extracted if their Eigenvalues are greater than 1. A three-variable k-means clustering is then conducted. A k=3 number of clusters is selected according to the Elbow method, which suggests selecting the k for which the within-cluster sum of squared errors begins to decrease at a decreasing rate (Figure 2). Silhouette scores are also reported in Figure 2 (the higher the better), but not followed due to case-specific criteria. All variables are standardized to Z-scores (hence possible negative values) prior to PCA or clustering, as it is necessary to alleviate scale bias (standardization formula in Table 1). The Athens metro system and station classification are illustrated in Figure 3, average centrality measures are presented in Table 3, while within-cluster average ridership fluctuations are depicted in Figure 1.


3. Findings
According to the results, morning boardings are completely uncorrelated with station centrality, but moderately high correlations exist during the rest of the day (within a range of 0.4 to 0.6). As for the alightings, considerable correlations are encountered at noon, while they drop quickly after 14.00. The most interesting finding is that the respective correlations seem to move in opposite directions with total boardings/alightings. That is, when travel demand surges (morning/evening peak-hours), the respective correlation drops, and vice versa. This is a crucial finding regarding disruption management, since it suggests that excessive travel demand is not channeled mostly to central stations and therefore, it does not create additional traffic burdens to them. This way, the criticality of central stations, which is already high due to topology and high traffic volumes, does not further increase during peak-hours, but relatively to the other metro stations, it drops instead.
Correlation and cluster analysis suggest that boardings during morning peak-hours are mostly related to departures from low and average-centrality stations (residential areas), but morning alightings are mostly related to central stations, providing evidence of work-related mobility. In addition, evening peak-hour departures are related to central stations, contrary to arrivals, signaling commuting, as well. Cluster analysis also suggests the existence of three groups of stations with similar characteristics. The first (Cluster 3) mostly includes the most central and crowded stations, the second comprises peripheral stations with low traffic volumes (Cluster 2), and the third includes averagely central stations (Cluster 1). Interestingly, stations of Cluster 1 are the predominant origins of morning departures, although their total contribution to daily ridership is essentially lower than Cluster’s 3. Driven by those characteristics, clusters 1-3 can be labeled as ‘averagely central origins’, ‘underutilized peripheral stations’ and ‘central destinations’.
All in all, intraday analysis can reveal centrality-ridership correlations within specific timeslots. Such an analysis can highlight specific mobility patterns, and it can thus be a fast, economical and convenient alternative to extended Origin-Destination travel surveys, and a crucial supportive tool for public transport analysis.
Acknowledgments
This work was supported by the Basic Research Program, PEVE 2021, National Technical University of Athens.