Loading [Contrib]/a11y/accessibility-menu.js
Skip to main content
null
Findings
  • Menu
  • Articles
    • Energy Findings
    • Resilience Findings
    • Safety Findings
    • Transport Findings
    • Urban Findings
    • All
  • For Authors
  • Editorial Board
  • About
  • Blog
  • covid-19
  • search

RSS Feed

Enter the URL below into your favorite RSS reader.

http://localhost:22663/feed
Energy Findings
May 11, 2023 AEST

Emissions Reductions from Electrifying High-Mileage Vehicles

Zack Aemmer, Daniel Malarkey, Don MacKenzie,
Electric VehiclesEmissionsSuperusersLifetimeAnnual MileageSubsidy
Copyright Logoccby-sa-4.0 • https://doi.org/10.32866/001c.75133
Findings
Aemmer, Zack, Daniel Malarkey, and Don MacKenzie. 2023. “Emissions Reductions from Electrifying High-Mileage Vehicles.” Findings, May. https:/​/​doi.org/​10.32866/​001c.75133.
Save article as...▾
Download all (1)
  • Figure 1. Weighted distribution of vehicle annual VKT according to the NHTS (Mean=18,119, SD=18,178).
    Download

Sorry, something went wrong. Please try again.

If this problem reoccurs, please contact Scholastica Support

Error message:

undefined

View more stats

Abstract

This paper evaluates a strategy that would target sales of internal combustion vehicles driven at high annual mileage for displacement by electric vehicles at the time of initial sale. Using the 2017 National Household Travel Survey data, we observe that the top 20% of light duty vehicles by kilometers traveled generate 46% of the annual greenhouse gas emissions. Displacing the sale of a combustion engine vehicle in the top mileage quintile with an electric vehicle would reduce annual greenhouse gas emissions and certain criteria pollutants by more than 15 times as much as displacing a vehicle in the bottom mileage quintile.

1. Questions

As part of a suite of policies to reduce harmful emissions, the U.S. federal government and some state and local governments offer tax credits and cash subsidies to lower the cost of electric vehicles (EVs) and electric vehicle supply equipment (EVSE) (Department of Energy 2021, 2020). Prior studies fault the federal tax credit on equity and efficiency; pointing out that credits go to high-income households, and replace fuel efficient vehicles that are driven at far lower rates than the US fleet average (Borenstein and Davis 2016; Xing, Leard, and Li 2021; Burlig et al. 2021; Davis 2019).

In this study we then ask: What are the potential emissions reductions from a strategy that targets EVs to displacing sales of internal combustion engine vehicles (ICEVs) in the highest emitting market segment?

One factor complicating this analysis is that if an EV is driven the same number of lifetime kilometers before being scrapped, regardless of its annual vehicle kilometers traveled (VKT), its lifetime greenhouse gas (GHG) emissions will remain static and make the same contribution to keeping society within the global GHG budget (Jenn 2019; Rajagopal and Phadke 2019; Slowik, Pavlenko, and Lutsey 2019). However prior work shows the depreciation effects of different driver behaviors during the use-phase will impact the lifetime mileage of a given EV (Karabasoglu and Michalek 2013; Neubauer, Brooker, and Wood 2012; Plötz, Funke, and Jochem 2018; Weymar and Finkbeiner 2016). We hypothesize that a vehicle’s scrap rate is a function of its age and its mileage, rather than mileage alone. Depending on the magnitude of the effect of age on scrap rate, vehicles driven at higher annual VKT will achieve higher lifetime mileage, and thus greater reductions in GHG emissions if displaced with an EV at the time of initial sale.

2. Methods

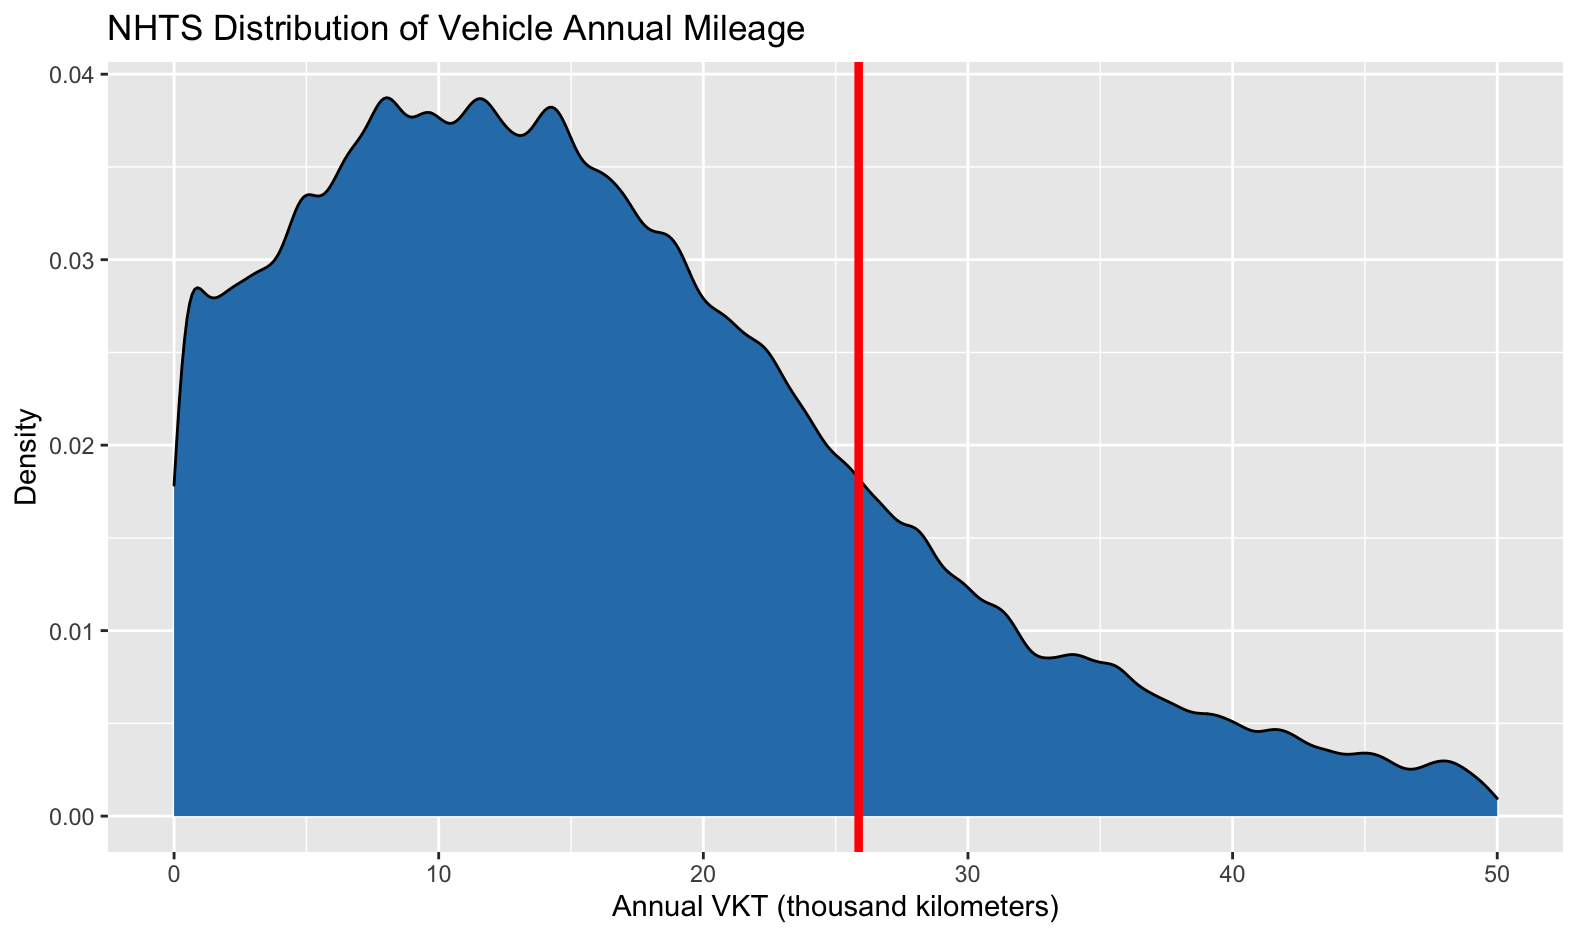
The National Household Travel Survey (NHTS) provides data from 2017 characterizing the emissions of 250,000 vehicles driven by US survey respondents, as well as their travel behavior. Using these data, we analyze the passenger vehicle fleet by annual VKT and note that the top quintile includes a long tail of vehicles with very high mileage. (Figure 1).

Figure 1
Figure 1.Weighted distribution of vehicle annual VKT according to the NHTS (Mean=18,119, SD=18,178).

The red line indicates the start of the uppermost quintile, above which electrification will achieve the largest emissions reductions. Upper bound for annual VKT is 320,000 kilometers per year.

To quantify the impact of annual mileage on total lifetime mileage, we estimate a linear relationship between annual VKT and lifetime mileage fit to the oldest vehicles in the NHTS vehicle dataset (model years 1985-2000), which are assumed to accumulate only a few additional kilometers before being scrapped. This gives an estimate for initial (\(\alpha\)=42,600) and additional lifetime kilometers per average annual kilometer (\(\beta\)=17.2) (Equation 1). We treat this linear fit as an upper bound for the effect of annual VKT on lifetime mileage. For a more conservative base case, we assume a linear relationship with a slope equal to half this upper-bound value (\(\alpha\)=123,600, \(\beta\)=8.6). Additionally, we limit the analysis between the means of the first and fifth NHTS annual VKT quintiles.

\[\small{\begin{aligned} Lifetime\ Mileage = \alpha + &\beta \cdot Average\ Annual\ VKT\\ & 3,400\ \leq \ Average\ Annual\ VKT\ \leq \ 41,500 \end{aligned}\tag{1}}\]

To calculate life cycle emissions for EVs and ICEVs from the passenger vehicle fleet, we apply Argonne National Laboratory’s GREET model, which provides well-to-wheel estimates of emissions rates per kilometer for various vehicle classes and fuels including emissions from vehicle manufacturing (Argonne National Laboratory 2006). In the GREET model we use the proportion of passenger cars, SUVs and pickup-trucks belonging to each mileage quintile to weight emission reductions between an ICEV and a BEV. We use the US electric grid mix to examine prototypical results for an ICEV replacement.

3. Findings

Table 1 summarizes how the total annual GHG emissions of the US passenger vehicle fleet are distributed across market segments of annual VKT and emissions per mile. Vehicles in the lower right corner have the highest emissions per mile and highest annual VKT; these represent 4 percent of the fleet but generate nearly 14 percent of annual emissions.

Table 1.Share of Annual GHG Emissions by 2017 Household Fleet Segment
Emissions (g/km) Annual VKT (thousand km/yr)
Quintile Mean 3.4 9.3 14.8 21.6 41.5
Quintile Bin 0-⁠6.0 6.0-⁠11.6 11.6-⁠17.4 17.4-⁠25.7 25.7-⁠320
Quintile 1 2 3 4 5 Total
128 44-212 1 0.6% 1.3% 2.3% 3.5% 7.3% 15.0%
232 212-⁠251 2 0.3% 1.3% 2.3% 3.4% 6.3% 13.6%
264 251-276 3 0.5% 1.6% 2.5% 3.9% 6.9% 15.4%
300 276-324 4 0.8% 2.7% 4.4% 6.3% 11.9% 26.1%
623 324-920 5 1.2% 3.6% 5.1% 6.5% 13.5% 29.9%
Total 3.4% 10.5% 16.6% 23.6% 45.9% 100.0%

The large share of emissions generated by high mileage vehicles means a program that targets the top quintile in annual VKT could potentially deliver 50 percent more annual emissions reductions than a program that targets the top quintile in emissions per kilometer.

Using Equation 1, EVs replacing ICEVs with higher annual VKT accumulate higher lifetime mileage and thus generate greater emissions savings than replacing ICEVs that are driven fewer kilometers per year as shown in Table 2. Displacing combustion engine vehicle sales in the top mileage quintile with EVs would reduce annual tailpipe greenhouse gas emissions and certain criteria pollutants by more than 15 times as much as displacing vehicles in the bottom mileage quintile. As noted earlier, the greenhouse gas emissions reductions are sensitive to the assumptions about the relationship between annual and lifetime kilometers for electric vehicles.

Table 2.Per-Vehicle Reduction in Annual Emissions from Replacing an ICEV with an EV
Annual VKT (thousand km/yr)
Quintile Mean 3.4 9.3 14.8 21.6 41.5
Quintile Bin 0-6.0 6.0-11.6 11.6-17.4 17.4-25.7 25.7-320
Quintile 1 2 3 4 5
GHG Emissions (Annual metric tons/yr) -0.5 -1.5 -2.5 -3.7 -7.5
CO (Annual kg/yr) -9.0 -23.6 -35.8 -51.4 -96.4
NOx (Annual kg/yr) -0.9 -2.1 -3.1 -4.3 -7.5
SOx (Annual kg/yr) 1.6 3.5 4.8 6.1 9.1
PM10 (Annual kg/yr) -0.1 -0.2 -0.3 -0.3 -0.5
PM2.5 (Annual kg/yr) -0.1 -0.1 -0.2 -0.2 -0.3

We find that policymakers could improve the efficiency of EV subsidy programs by designing them to target high annual mileage drivers. Such an approach could increase the per vehicle reductions in three out of five criteria pollutants by up to a factor of 10 compared to the lowest mileage quintile. There is more uncertainty about the magnitude of GHG savings from such an approach, given that lifetime emission reductions depend on the effects of age and mileage on EV and ICEV scrap rate (an area for potential future research). However, reasonable bounds on the relationship between annual kilometers and lifetime mileage show a potential reduction in GHG emissions by up to a factor of 15 by shifting EV conversions from the lowest annual VKT quintile to the highest.


Acknowledgments

This research was supported by a grant from Uber to the University of Washington through the Mobility Innovation Center.

Submitted: October 25, 2022 AEST

Accepted: May 04, 2023 AEST

References

Argonne National Laboratory. 2006. “Development and Applications of GREET 2.7—The Transportation Vehicle-Cycle Model.” Department of Energy. https:/​/​greet.es.anl.gov/​publication-lkldbrwj.
Borenstein, Severin, and Lucas W. Davis. 2016. “The Distributional Effects of US Clean Energy Tax Credits.” Tax Policy and the Economy 30 (1): 191–234. https:/​/​doi.org/​10.1086/​685597.
Google Scholar
Burlig, Fiona, James Bushnell, David Rapson, and Catherine Wolfram. 2021. “Low Energy: Estimating Electric Vehicle Electricity Use.” AEA Papers and Proceedings 111 (May):430–35. https:/​/​doi.org/​10.1257/​pandp.20211088.
Google Scholar
Davis, Lucas W. 2019. “How Much Are Electric Vehicles Driven?” Applied Economics Letters 26 (18): 1497–1502. https:/​/​doi.org/​10.1080/​13504851.2019.1582847.
Google Scholar
Department of Energy. 2020. “California Laws and Incentives.” Alternative Fuels Data Center. October 1, 2020. https:/​/​afdc.energy.gov/​laws/​state_summary?state=CA.
———. 2021. “Federal Tax Credits for New All-Electric and Plug-in Hybrid Vehicles.” November 22, 2021. https:/​/​www.fueleconomy.gov/​feg/​taxevb.shtml.
Jenn, A. 2019. “Emissions Benefits of Electric Vehicles in Uber and Lyft Services.” National Center for Sustainable Transportation. https:/​/​escholarship.org/​uc/​item/​15s1h1kn.
Karabasoglu, Orkun, and Jeremy Michalek. 2013. “Influence of Driving Patterns on Life Cycle Cost and Emissions of Hybrid and Plug-in Electric Vehicle Powertrains.” Energy Policy 60:445–61. https:/​/​doi.org/​10.1016/​j.enpol.2013.03.047.
Google Scholar
Neubauer, Jeremy, Aaron Brooker, and Eric Wood. 2012. “Sensitivity of Battery Electric Vehicle Economics to Drive Patterns, Vehicle Range, and Charge Strategies.” Journal of Power Sources 209:269–77. https:/​/​doi.org/​10.1016/​j.jpowsour.2012.02.107.
Google Scholar
Plötz, Patrick, Simon Árpád Funke, and Patrick Jochem. 2018. “The Impact of Daily and Annual Driving on Fuel Economy and CO2 Emissions of Plug-in Hybrid Electric Vehicles.” Transportation Research Part A: Policy and Practice 118:331–40. https:/​/​doi.org/​10.1016/​j.tra.2018.09.018.
Google Scholar
Rajagopal, Deepak, and Amol Phadke. 2019. “Prioritizing Electric Miles over Electric Vehicles Will Deliver Greater Benefits at Lower Cost.” Environmental Research Letters 14 (9): 091001. https:/​/​doi.org/​10.1088/​1748-9326/​ab3ab8.
Google Scholar
Slowik, P., N. Pavlenko, and N. Lutsey. 2019. “Emerging Policy Approaches to Electrify Ride-Hailing in the United States.” No. 01705529. International Council on Clean Transportation. https:/​/​trid.trb.org/​view/​1584765.
Weymar, Elisabeth, and Matthias Finkbeiner. 2016. “Statistical Analysis of Empirical Lifetime Mileage Data for Automotive LCA.” The International Journal of Life Cycle Assessment 21 (2): 215–23. https:/​/​doi.org/​10.1007/​s11367-015-1020-6.
Google Scholar
Xing, Jianwei, Benjamin Leard, and Shanjun Li. 2021. “What Does an Electric Vehicle Replace?” Journal of Environmental Economics and Management 107:102432. https:/​/​doi.org/​10.1016/​j.jeem.2021.102432.
Google Scholar

This website uses cookies

We use cookies to enhance your experience and support COUNTER Metrics for transparent reporting of readership statistics. Cookie data is not sold to third parties or used for marketing purposes.

Powered by Scholastica, the modern academic journal management system