

1. Questions
Researchers studying energy systems and decarbonization rely heavily on census data to understand environmental justice outcomes (Brockway, Conde, and Callaway 2021; Burger 2019; Tessum et al. 2021; Thind et al. 2019). Population counts of different racial and ethnic groups at various spatial resolutions – state, county, census tract, block groups, and blocks – are used to find out which populations are adversely affected and where do they reside. Finer data resolution can help identify specific neighborhoods and communities for targeted energy and environmental policies by government. At the same time, Census Bureau is required by law to protect the privacy of Census participants and has implemented various disclosure avoidances systems (DAS) since 1960s. The bureau introduced a new DAS called differential privacy (DP) for the Census data of 2020. DP injects top-down random noise to Census tabulations. Noise is smallest at the national or state level and highest for smaller spatial units such as block group or blocks. Various post-processing steps, though not formally part of differential privacy, are required to maintain the facial validity of census products (Kenny et al. 2021). The question is whether the infusion of random noise coupled with post-processing adjustments lead to unintentional systemic deviations in understanding environmental justice outcomes.
Air quality is a useful case-study to investigate in this context. Air pollution can vary significantly across small distances. Estimates of exposure disparities are impacted by the spatial resolution at the level of input (spatial unit at which outcome is observed) as well as level of aggregation (spatial unit at which outcome is reported). Pollution exposure, which can change over short distances, is more accurately observed at finer spatial scale, usually block or block-group level data, while increasing the level of aggregation to larger spatial resolution (state or county level) underestimates disparities compared to census tract or block group level aggregation (Clark et al. 2022; Paolella et al. 2018). Noise and adjustments in census data can significantly alter these estimates.
In this piece, I answer how introducing differential privacy in Census data impact:
-
Air pollution exposure of different race and ethnicity in the United States
-
Exposure disparities when aggregated to county and census tract levels.
2. Methods
I use population data at census block group level (CBG) from the original 2010 Census and from the latest experimental runs of differential privacy algorithm applied to the original 2010 Census (Vintage 2022-08-25) from IPUMS NHGIS (Manson et al. 2022). Americans who identify as non-Hispanic blacks only, non-Hispanic whites only, non-Hispanic Asians only, non-Hispanic native American and American Indian only are referred to as Blacks, Whites, Asians, and Native Americans in this work. Latinos include all Americans who identify as Latinos or Hispanics. Americans who identify as mixed race aren’t included in this analysis. I use census block group level (CBG) ambient pollution estimates of four air pollutants (PM2.5, PM10, NO2, SO2) for the year 2010 from the Center for Air, Climate and Energy Solutions (“The Center for Air, Climate, and Energy Solutions,” n.d.) as described in published work (Kim et al. 2020).
Exposure of pollutant i by race and ethnicity j is aggregated to census tract level and county level is given as:
Exposurei, j, census tract or county= ∑(over all CBG in a census tract or countyExposurei,CBG X Populationj, CBG)∑(over all CBG in a census tract or county Populationj, CBG)
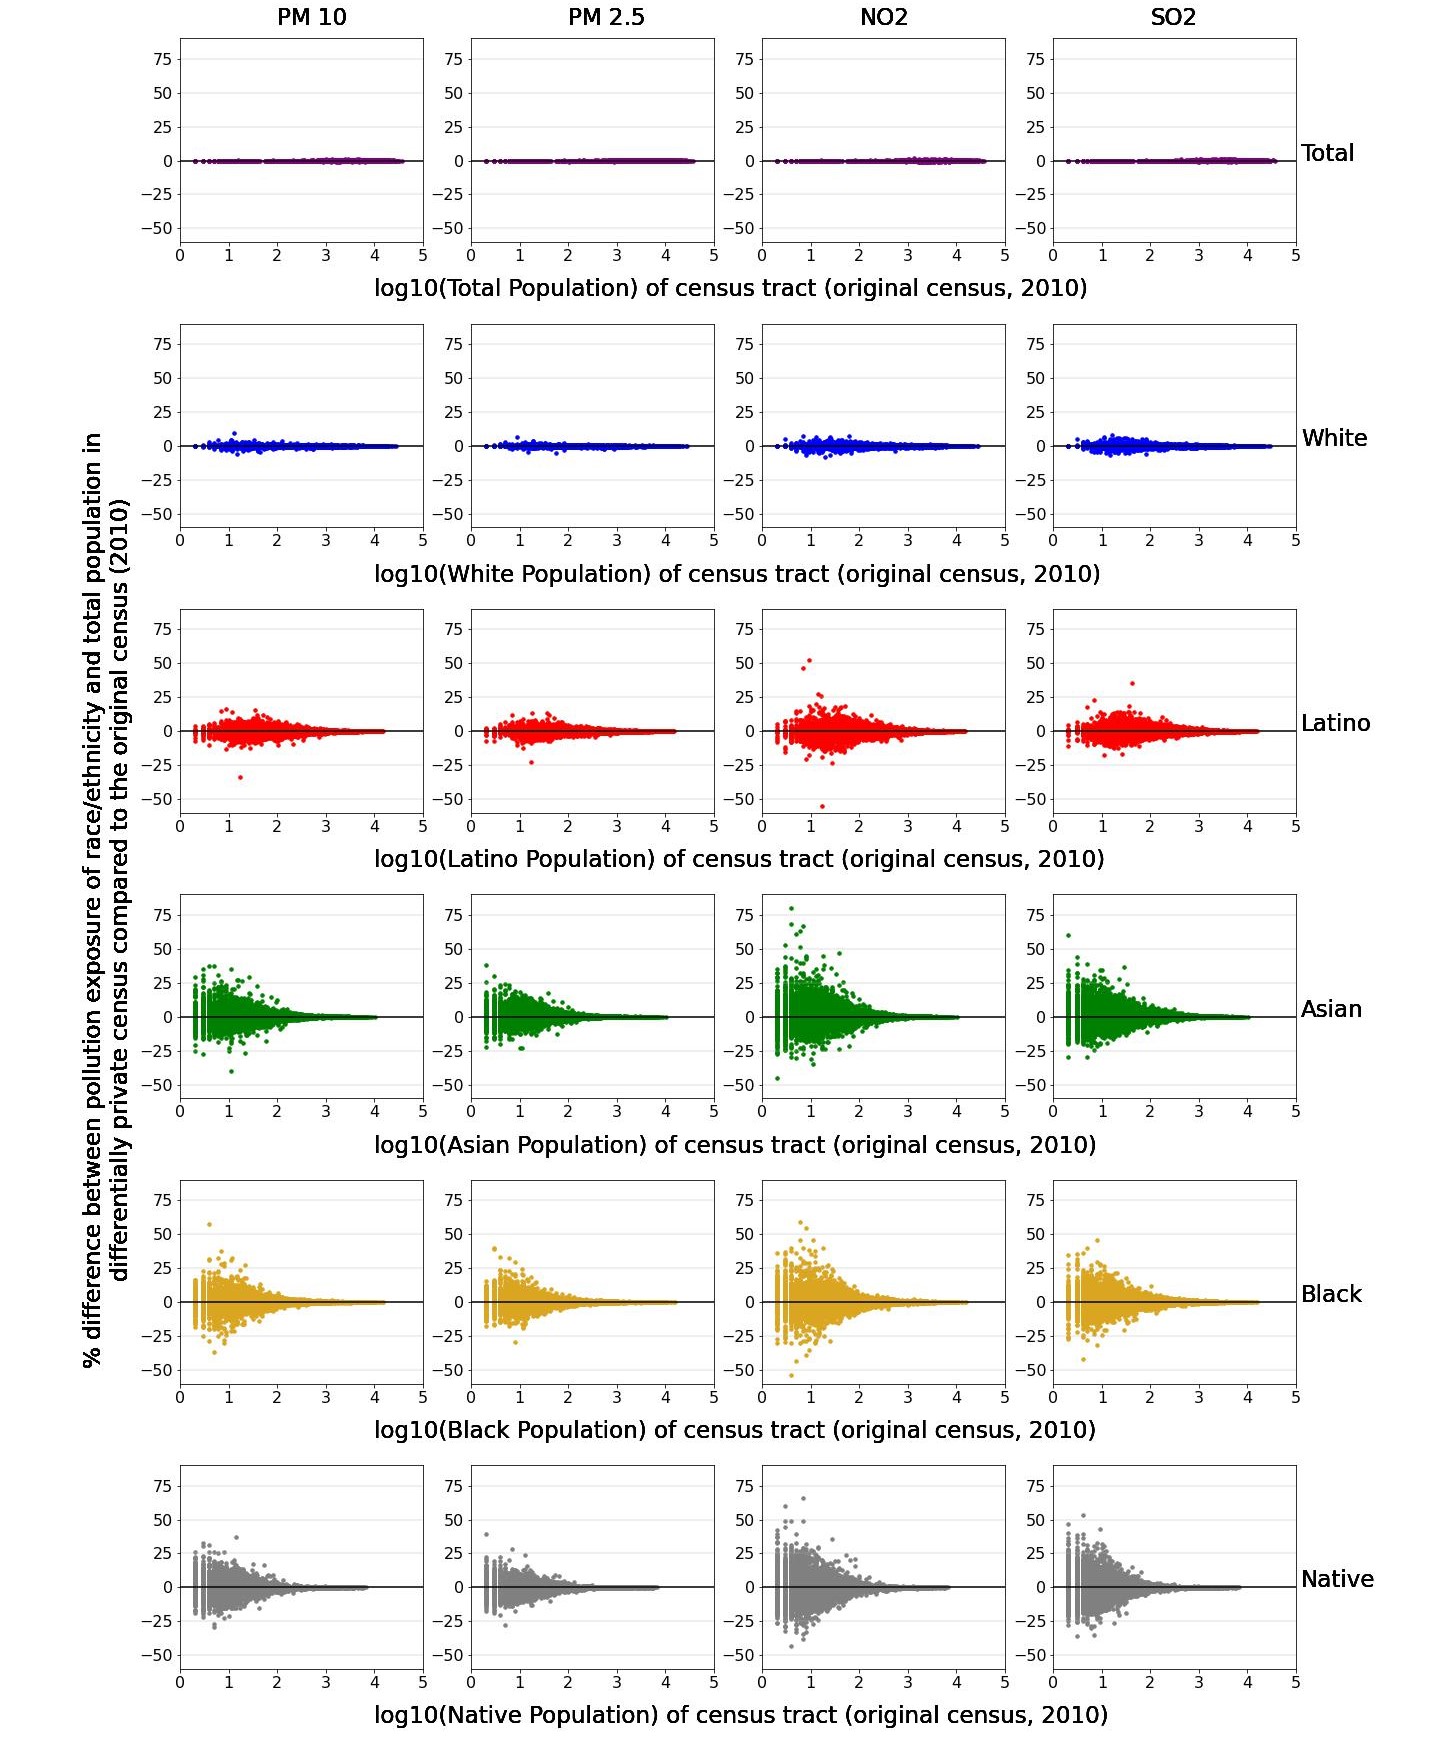
Where denotes the ambient pollution estimate of pollutant in each census block group and denotes the total population or population of race/ethnicity in each census block group summed over all census block groups in a census tract or county. Figure 1 and 2 plot the percentage difference of exposure of pollutants experienced by total population and different race and ethnicity in the differentially private census compared to the original census aggregated at county and census tract level respectively. Census tracts or counties with any population count of 0 in either original or differentially private census are removed.
To understand the impact of differential private census products on pollution disparities, I estimate risk gap at county and census tract levels. Risk gap is defined as the difference between the pollution exposure of most burdened group, i.e., maximum value of exposure for a race and ethnicity as calculated above and the total population average exposure.
Risk Gapi,census tract or county=max(Exposurei,j,census tract or county)−Exposurei, population, census tract or county
Where is pollution exposure of pollutant i by race and ethnicity j in census tract or county and is the pollution exposure of pollutant i for the entire population in census tract or county. Figure 3 plots the ratio of risk gap calculated using the DP and original census by the population average pollution exposure at census tract and county. Ratio above (below) 1 denotes that DP census shows larger (smaller) risk gap compared to the original census.
3. Findings
Differential privacy in census data significantly changes the ambient pollution exposure in small spatial units with sparse population of people of color (Figure 1 and 2). Census tracts have higher variations than counties. White American have the lowest variance in exposure, followed by Latinos, Asian, and Black Americans. This is, in part, due to post-processing procedure which gives priority to the accuracy counts for the largest racial group in an area. The changes in pollution exposure also depends on the pollutant. For example, in counties with sparse population of Asian and Black Americans, the NO2 exposure changes can be as high as +/- 50%. Exposure differences nullify for larger population counts.
_of_total_.jpg)
_of_total_.jpg)
Figure 3 displays the ratio of the risk gap calculated by DP census and original census with ambient pollutant levels for both county and census tract aggregation. Differentially private census underestimates (ratio less than 1) the disparity for SO2 in both county and census tract aggregations. The ratio decreases with higher levels of ambient SO2. DP overestimates the risk gap associated with PM10 for both county and census tract compared to original census (ratio greater than 1), with the ratio increasing as the ambient pollution of PM10 increases. The trends in risk gap ratio at the county level for NO2 and PM2.5 are not significant, but DP significantly underestimates the disparity for PM2.5 at the census tract level, particularly in more polluted census tracts.
_and_census_tract_(right)_level_of_dp_cen.jpg)
ACKNOWLEDGMENTS
I acknowledge that I received no funding in support of this research. I thank Josh Apte and Inês Azevedo for their feedback on an earlier version of this work. I thank the two anonymous reviewers that greatly improved the quality of this manuscript.