

RESEARCH QUESTION AND HYPOTHESES
Research has shown the importance of using factors associated with land use to explain public transport ridership (Cervero 1996; Dill et al. 2013; Foth, Manaugh, and El-Geneidy 2013; Schwanen and Mokhtarian 2005). In particular, some research has sought to examine the relationship between accessibility (or the ease of reaching destinations within a certain time threshold) and public transport mode share (Owen and Levinson 2018).
Our research examines the relationship between public transport mode share and accessibility to jobs by public transport for low- and higher-income groups of individuals leaving their home census tracts in 11 Canadian metropolitan areas. We did this as an introductory analysis through a series of scatter plots and fitted curves to discern patterns. We hypothesize that public transport mode share is higher in denser regions and at higher levels of accessibility. We also expect that the low-income group will exhibit higher public transport use compared to the higher-income group at the same accessibility levels.
METHODS AND DATA
The number of jobs in each census tract was obtained from the Statistics Canada Census flow tables. The tables present the number of commuters by income and mode of transport (car, public transport, or active mode) commuting between a pair of origin and destination census tracts. The number of individuals working in each census tract (sum of all commuters arriving at that tract) is a proxy for the number of jobs available. The total number of people leaving a home census tract is comprised of the commuters whose origin–destination trips originate from that census tract. The low-income threshold is taken as 30% of the lowest paying jobs in a region, and the higher-income group includes all income brackets above this threshold.
The public transport travel time matrix (the constraining factor in accessibility) is generated in ArcGIS using General Transit Feed Specification data for 8:00 a.m. on a Tuesday morning.
The accessibility measures for the two income groups are as follows:
\[ A_{\text{iELI}} = \sum_{j = 1}^{J}{E_{LI,j}f\left( t_{\text{ij}} \right)\text{ and f}\left( t_{\text{ij}} \right)} = \ \left\{ \begin{matrix} 1\ if\ t_{\text{ij}} \leq t_{threshold,LI} \\ 0\ if\ t_{\text{ij}} > t_{threshold,LI} \\ \end{matrix} \right. \]
\[ A_{\text{iEH}} = \sum_{j = 1}^{J}{E_{HI,j}f\left( t_{\text{ij}} \right)\text{ and f}\left( t_{\text{ij}} \right)} = \ \left\{ \begin{matrix} 1\ if\ t_{\text{ij}} \leq t_{threshold,HI} \\ 0\ if\ t_{\text{ij}} > t_{threshold,HI} \\ \end{matrix} \right. \]
where:
i = home census tract
j = destination census tract
AiELI = accessibility to low-income jobs from i
AiEHI = accessibility to higher-income jobs from i
ELI,j = number of low-income jobs in j
EHI,j = number of higher-income jobs in j
tij = commute time between i and j
tthreshold,LI = average commute time of low-income group
tthreshold,HI = average commute time of higher-income group
The travel time threshold is specific to income group and region to represent actual levels of accessibility experienced (based on realistic average commute times for the two income groups in different cities).
In order to compare the impact of public transport mode share for the two income groups in the same scatter plot, z-scores for accessibility are generated. This transforms the data distribution into a normal distribution with a mean of 0 and a standard deviation of 1. The range of accessibility values in all regions skews positively, causing z-scores to lean more heavily to the positive side of the mean.
A series of basic curve fitting models were applied to the Toronto–Hamilton dataset (Figure 1) to find the model to be used for all regions. We included a polynomial model to capture the nonlinearities present in the dataset but we limited this to the second order. We found that the polynomial model provided the best fit of the data.
_a.png)
FINDINGS
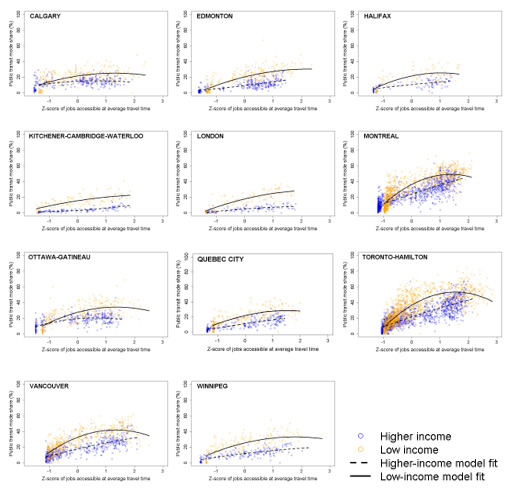
Scatter plots of public transport mode share and accessibility by public transport for low- and higher-income groups in the 11 metropolitan areas are shown in Figure 2. Table 1 contains the model coefficients and R2 values. As expected, at the same level of accessibility, the low-income group exhibits higher public transport use than the higher-income group in all regions. In addition, public transport use increases as accessibility by public transport increases for both income groups. The increase in public transport uptake as a result of an improvement in accessibility is faster for the low-income group as shown by the steeper curves between z-scores of −1 and 0. This implies that improving accessibility to be closer to the average accessibility in a region has a greater impact on low-income than higher-income groups.
Interestingly, low-income public transport mode share starts to decrease at very high levels of accessibility in major metropolitan regions including Montreal, Toronto–Hamilton, Vancouver, and Ottawa–Gatineau. This could be attributed to increased uptake of active modes in areas with very high levels of accessibility (i.e., at denser city centers). Public transport mode share is highest in places with developed mass public transport systems, such as Toronto–Hamilton, Montreal, and Vancouver. In fact, the higher-income group uses public transport almost as frequently as the low-income group in these regions, but only when accessibility by public transport is very high. Although there is a developed light rail transit system in Calgary, the mode share (especially at higher levels of accessibility) is lower than in cities without heavy rail public transport, such as Quebec City and Winnipeg.
That mode choice is a complex issue and several confounders can explain some of the variances we noticed in our analysis. This article presents a first step toward a comprehensive mode choice analysis, where different confounders are included.
ACKNOWLEDGMENTS
The authors would like to thank Prof. David Levinson for sharing his early work on accessibility and mode choice in US cities. This research was funded by the Social Sciences and Humanities Research Council of Canada (SSHRC).