Loading [Contrib]/a11y/accessibility-menu.js
Skip to main content
null
Findings
  • Menu
  • Articles
    • Energy Findings
    • Resilience Findings
    • Safety Findings
    • Transport Findings
    • Urban Findings
    • All
  • For Authors
  • Editorial Board
  • About
  • Blog
  • covid-19
  • search

RSS Feed

Enter the URL below into your favorite RSS reader.

http://localhost:59642/feed
Transport Findings
April 04, 2023 AEST

Equity Analysis of Bikeshare Access: A Case Study of New York City

Ramina Javid, Eazaz Sadeghvaziri,
BikeshareNew York Cityequity
Copyright Logoccby-sa-4.0 • https://doi.org/10.32866/001c.73906
Photo by Anthony Fomin on Unsplash
Findings
Javid, Ramina, and Eazaz Sadeghvaziri. 2023. “Equity Analysis of Bikeshare Access: A Case Study of New York City.” Findings, April. https:/​/​doi.org/​10.32866/​001c.73906.
Save article as...▾
Download all (3)
  • Figure 1. Percentage of Trips Starting from Each Census Tract
    Download
  • Figure 2. Bikeshare Usage Rate per Household at Census Tract level
    Download
  • Figure 3. Median Household Income at Census Tract Level
    Download

Sorry, something went wrong. Please try again.

If this problem reoccurs, please contact Scholastica Support

Error message:

undefined

View more stats

Abstract

This study investigates the association between bikeshare program usage and neighborhoods with different socio-demographic information. This study investigated 2023 Citi Bike bikeshare data in New York City. For the analysis, Generalized Linear Regression (GLR) in ArcGIS Pro was used. The results revealed that Citi Bike bikeshare ridership increases in neighborhoods with higher income, more workers, more males, higher density, and lower African American and Hispanic population in New York City.

1. Questions

With the recent increase in bicycling and the rise of bikeshare systems, a significant number of US cities and communities are investigating the use of bikeshare to improve the transportation system’s environmental, social, and health results. Researchers and scholars interested in bikeshare programs frequently concentrate their attention on the demographics of bikeshare customers. In addition to ethnicity, gender and educational attainment (Javid and Sadeghvaziri 2023), aspects such as income are factors that are taking into consideration (Sadeghvaziri et al. 2023). Given this, we ask: How does bikeshare usage differ with socio-demographics at Census Tract level in New York City?

2. Methods

As our study area, we used New York’s Citi Bike. Citi Bike is New York City’s bikeshare system and the largest bikeshare system in the US (“Citi Bike New Jersey | Citi Bike NYC,” n.d.). We used the most recent data of Citi Bike, from January 1st, 2023, to February 28th, 2023, for New York City, Manhattan Borough. During this period, Citi Bike data includes 3,607,349 trip records and each record includes the location of the origin of each ride (“Citi Bike System Data | Citi Bike NYC,” n.d.). Moreover, the independent variables were retrieved form the most current release of data from the American Community Survey (ACS). These variables includes median household income, race, number of workers, and gender in the past 5 years which were retrieved from the Census Bureau’s API for American Community Survey at the Census Tract level (U.S. Census Bureau, n.d.; “Esri’s Profile,” n.d.).

The data were imported into ArcGIS Pro. We regressed the CitiBike bikeshare rides on the aforementioned variables using the Generalized Linear Regression (GLR) built-in tool of ArcGIS Pro. Table 1 lists the dependent and independent variables.

Table 1.List of Variables
Variables Source Description
Trip Count Citi Bike Trip Data Number of trips starting in a census tract during the selected period
Household Income ACS Median Household Income in past 12 months
Density ACS Population density at census tract level
Race ACS Race of the population broken down by race and Hispanic origin at the census tract level
Gender ACS Gender of the population at the census tract level
Means to Work ACS Workers’ mode of commute at the census tract level

As is demonstrated in Figures 1 and 2, bikeshare trips are highly concentrated in the downtown area and decay with distance from those centers with a smaller concentration of trip origins in the Uptown.

Figure 1
Figure 1.Percentage of Trips Starting from Each Census Tract
Figure 2
Figure 2.Bikeshare Usage Rate per Household at Census Tract level

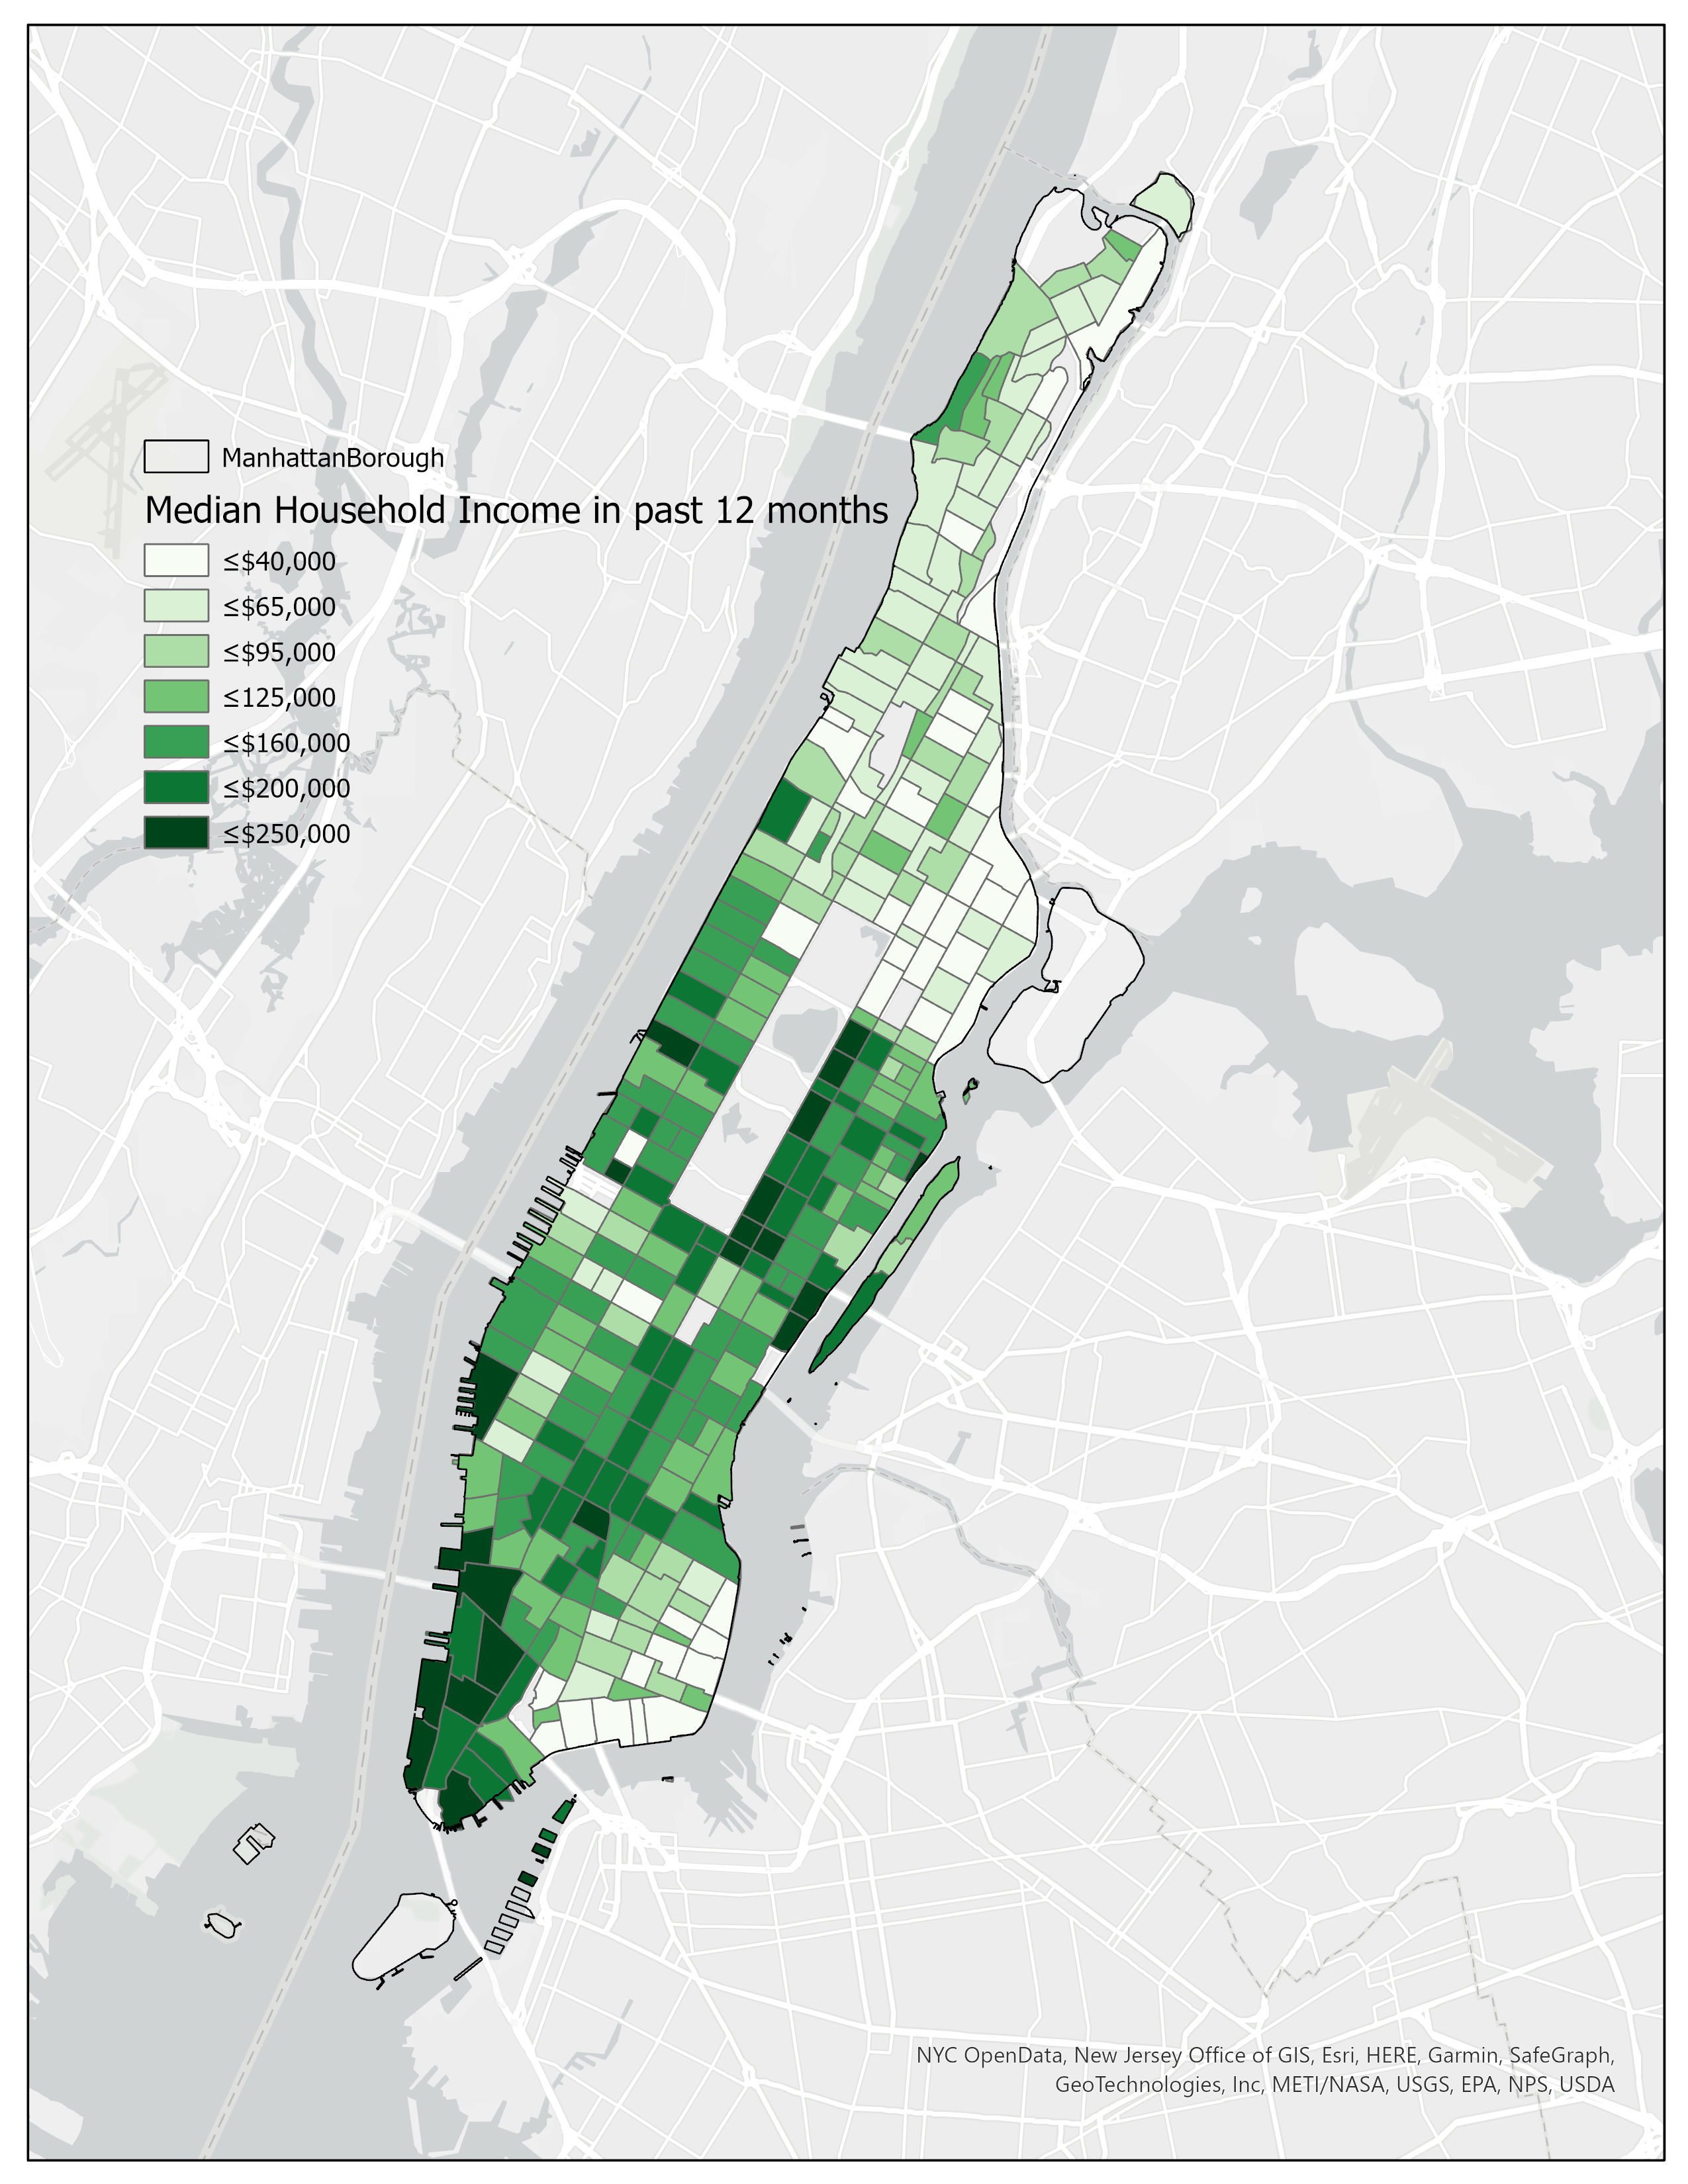
Using ACS data, Figure 3 presents median household income in past 12 months in New York City. It shows that household income decays with distance from the downtown with a lower income level households living in the north of the city.

Figure 3
Figure 3.Median Household Income at Census Tract Level

3. Findings

Table 2 presents the regression model. The dependent variable is number of trips generated at each census tract during the two-month period.

Table 2.Model Results
Variable Coefficient Std Error t-Statistic Robust_Pr
Intercept 3343.826 1600.081 2.090 0.034 *
Household Income 0.023 0.010 2.207 0.033 *
Density 50.431 8.849 5.699 0.000 *
White Population -2.651 2.718 -0.975 0.189
Black or African American Population -4.317 2.804 -1.539 0.040 *
Asian Population -1.925 2.771 -0.695 0.377
Hispanic or Latino Population -4.212 2.661 -1.583 0.035 *
Male Population 5.946 2.710 2.194 0.008 *
Female Population 0.078 2.709 0.029 0.968
Workers 13.343 5.353 2.493 0.011 *

Adjusted R-Squared: 0.316

The results of the model show that higher bikeshare ridership is associated with higher household income, a greater number of workers, greater number of males and higher density at the census tract level. Moreover, neighborhoods with higher African Americans and Hispanic population have less bikeshare ridership.

Based on the results of the analyses, it can be concluded that there is significant interaction between the levels of income groups and bikeshare ridership and we can conclude that bikeshare ridership is lower in low-income neighborhoods in New York City.


Acknowledgments

This is to acknowledge that there is no financial interest or benefit arising from the direct applications our research.

Submitted: February 08, 2023 AEST

Accepted: March 25, 2023 AEST

References

“Citi Bike New Jersey | Citi Bike NYC.” n.d. Accessed June 27, 2022. https:/​/​ride.citibikenyc.com/​nj.
“Citi Bike System Data | Citi Bike NYC.” n.d. Accessed June 25, 2022. https:/​/​ride.citibikenyc.com/​system-data.
“Esri’s Profile.” n.d. Accessed March 19, 2023. https:/​/​www.arcgis.com/​home/​user.html?user=esri_demographics.
Javid, Ramina, and Eazaz Sadeghvaziri. 2023. “Assessing Gender Gaps in Citi Bike Ridership in New York City.” SSRN Electronic Journal. https:/​/​doi.org/​10.2139/​ssrn.4358660.
Google Scholar
Sadeghvaziri, E., R. Javid, M. Jeihani, and E. Center. 2023. “Investigating Walking and Biking Activities Among Low-Income African Americans.”
U.S. Census Bureau. n.d. “Available APIs.” Census.Gov. Accessed March 18, 2023. https:/​/​www.census.gov/​data/​developers/​data-sets.html.

This website uses cookies

We use cookies to enhance your experience and support COUNTER Metrics for transparent reporting of readership statistics. Cookie data is not sold to third parties or used for marketing purposes.

Powered by Scholastica, the modern academic journal management system