Loading [Contrib]/a11y/accessibility-menu.js
Skip to main content
null
Findings
  • Menu
  • Articles
    • Energy Findings
    • Resilience Findings
    • Safety Findings
    • Transport Findings
    • Urban Findings
    • All
  • For Authors
  • Editorial Board
  • About
  • Blog
  • covid-19
  • search

RSS Feed

Enter the URL below into your favorite RSS reader.

http://localhost:3561/feed
Transport Findings
March 25, 2023 AEST

The Effect of Built Environment on Urban Park Visits during the Early Outbreak of COVID-19

Xiaoxiao Liu, Wei Zhai,
built environmenturban parkbig datacovid-19
Copyright Logoccby-sa-4.0 • https://doi.org/10.32866/001c.73734
Findings
Liu, Xiaoxiao, and Wei Zhai. 2023. “The Effect of Built Environment on Urban Park Visits during the Early Outbreak of COVID-19.” Findings, March. https:/​/​doi.org/​10.32866/​001c.73734.
Save article as...▾
Download all (1)
  • Figure 1. Framework of the structure equation modeling
    Download

Sorry, something went wrong. Please try again.

If this problem reoccurs, please contact Scholastica Support

Error message:

undefined

View more stats

Abstract

During the COVID-19 early outbreak, the effects of built environment on individuals’ urban park visitation are understudied. We employed structural equation modeling to disentangle such complex relationships and investigate the impacts over time at the census tract level across the 100 largest American cities. The results show that density and design both explain park visitation, while only the dimension of density has major influences on the distance to urban parks.

1. Questions

Urban parks are instrumental to public health. However, the outbreak of the COVID-19 pandemic dramatically changed the public mobility patterns due to the containment measures. Urban residents were, therefore, likely to exhibit different patterns of park visitation due to various built environment factors (Xiong et al. 2020), so that people’s mental and physical well-being were at risk during the pandemic (Ding, Li, and Sang 2022; Krendl and Perry 2020). For example, densely populated cities, where people are under higher risk of the detrimental effects of COVID-19 (Cortwright 2020), might see a decrease in large urban park visit (Zhai, Yue, and Deng 2022). Sometimes, urban parks may even serve as transmission hotspots for the virus transmission (Volenec et al. 2021), because pedestrian activity increased in city parks, peri-urban forests, green open spaces, as well as restricted open areas due to different built environment characteristics of the area (Venter et al. 2020). In addition to urban park shutdowns that were posited to reduce the risk, social distancing policies, restrictions on social gatherings, and closure of workspace in urban parks may have also affected park visits (Geng et al. 2021; Fu and Zhai 2021); however, none of these containment measures have been examined yet in the context of urban green space. Hence we seek to answer the following questions: how the neighborhood built environment impacts individuals’ urban park visits during the early outbreak of COVID-19, and how the built environment effects change after the declare of containment measures?

2. Methods

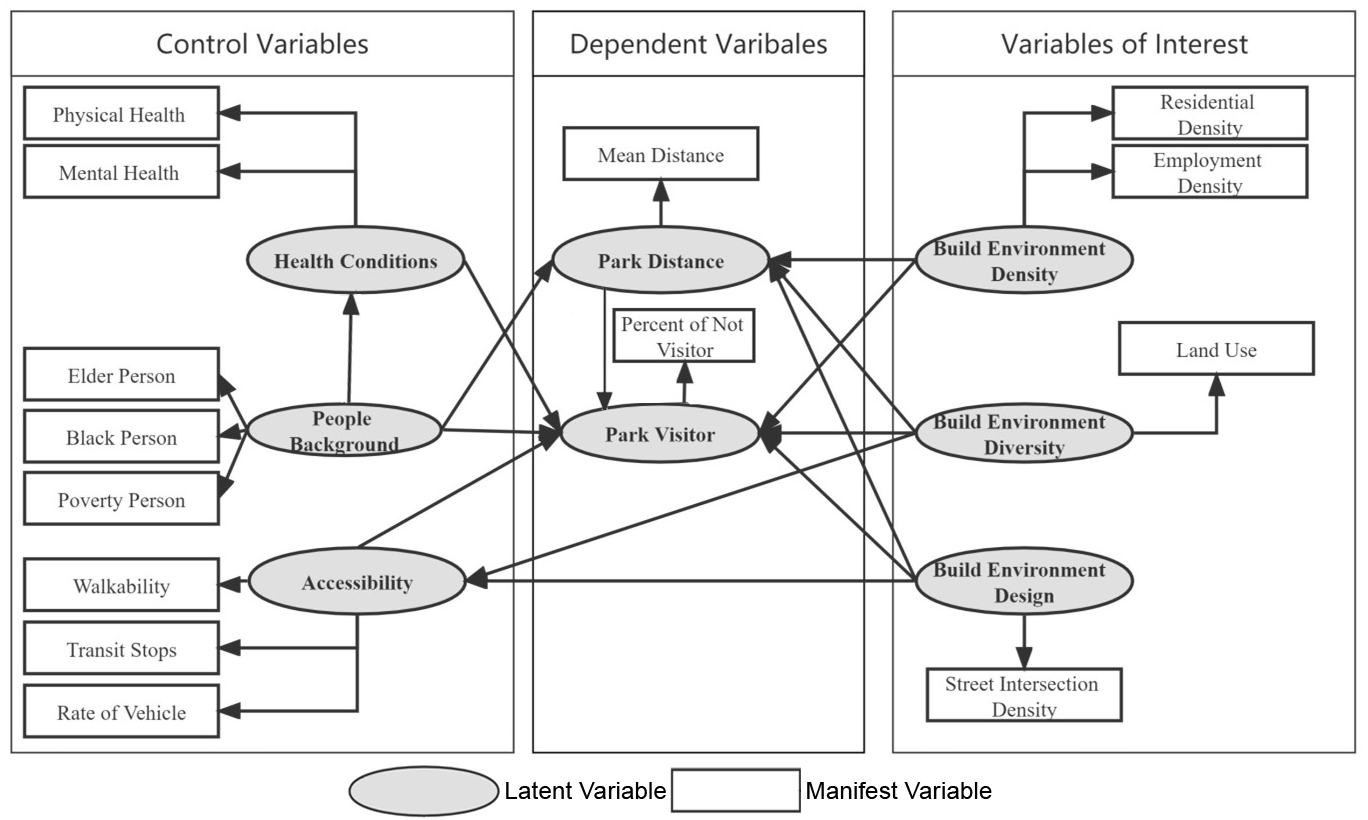
The census tract group is used as the spatial unit. The study region has 11,269 census tracts from the 100 largest American cities, spanning the time period between March 16, 2020 and April 20, 2020 on a weekly basis. In order to explore the relationship between the built environment and park visitations systematically, we applied structure equation modeling (SEM) in this work (Figure 1). There are eight latent variables that are the variables of interest in this research. The motive of using SEM is that it allows us to study both the direct and indirect effects of built environment variables while conventional OLS regressions cannot address such questions. In Table 1, we specify the variables.

Figure 1
Figure 1.Framework of the structure equation modeling
Table 1.describes variables, data sources and summary statistics (N=11,269)
Variable Description Mean SD Min Max
Urban Parka
Distance The average distance for each community to parks 12.8 28.74 0.01 915.51
Park Visit Percentage of residents who did not visit urban green parks 0.75 0.33 0 0.99
Socioeconomicsb
Elderly People The rate of elder people 0.12 0.06 0 1
Poverty The rate of poverty people 0.3 0.28 0 1
Black The rate of black people 0.21 0.27 0 1
Accessibilityc
Transit Stops The quantity of transit stops in one square mile (2,588,881m2) 28.64 38.87 0 484.37
Rate of Vehicle The rate of people who have any vehicle 0.83 0.43 0 1.65
Walkability 13.4 2.91 0 32.6
Health Conditionsd
Mental Health Mental health not good for >=14 days among adults aged >=18 Years 11.75 5.86 0 32.6
Physical Health Physical health not good for >=14 days among adults aged >=18 Years 11.04 5.64 0 32.4
Built environment-Densitye
Residential Density Gross residential density(house/acre) on unprotected land 13 17.83 0 298.63
Employment Density Gross employment density(jobs/acre) on unprotected land 12.44 57.37 0 2826.67
Built environment-Diversity
Land Use Entropy Calculated by authors 6.72 20.34 0 484.37
Built environment-Designe
Street Intersection Density Intersection density per square mile 113.26 87.31 0 1422.45

Note: The data sources can be found below
a. SafeGraph COVID-19 Data Consortium (https://www.safegraph.com/)
b. American Community Survey (https://www.census.gov/programs-surveys/acs)
c. Smart Location Database (https://www.epa.gov/smartgrowth/smart-location-mapping)
d. 500 Cities Project (https://www.cdc.gov/places/about/500-cities-2016-2019/index.html)

Dependent variables. The dependent variables are the distance to the urban parks and the percentage of residents who visit urban green parks, derived from the SafeGraph mobility data. The raw data includes the mobility records of over 40 million users’ mobile devices across the United States, revealing the number of weekly trips from each neighborhood to different types of points of interest (Weill et al. 2020; Zhai et al. 2021). Specifically, the variable of distance is calculated by the arithmetic mean distance of mobile devices from each neighborhood to parks. Likewise, the park visit is the percent of mobile devices in a census tract that visited the urban park during a given week. We assume that distance to the park will impact the park visitations since people are less likely to travel to urban parks that are farther away from their homes (Gao, Zhai, and Fu 2023).

Independent variables. Built environment is a multi-dimensional variable resulting from a myriad of spatial variables (Handy et al. 2002). Here, we use density, diversity and design. (1) Density is represented by residential density and employment density at tract level. (2) Land use entropy is used to indicate the diversity of built environment, because it takes into account the purposes for which various buildings are made in an area. Mathematically, the measure was obtained by land use entropy\(= \sum_{i}^{}\frac{P_{i}*\ln\left( P_{i} \right)}{\ln(i)}\). In the equation, i is the number of land uses included and Pi represents the share of each land use i. We used commercial, official, residential, industrial and other land use types for this variable. The value ranges are from 1 to 0. A greater land use entropy represents more diverse land use, while a lower value indicates less types of land use. (3) The dimension of design is represented by street intersection density, indicating street design in an urban area.

Control variables. Age and demographic background may partially explain park visitation. We also added accessibility variables, including the numbers of stops per square mile, number of vehicles per family, and walkability. Due to the high correlation between people’s mobility and health conditions, variables for mental health and physical health are also considered, respectively.

3. Findings

Our results of the SEM can be found in Tables 2 and 3, regarding the direct effects and indirect effects, respectively. Note that since we have weekly trips from SafeGraph, we ran the SEM over the weeks between March 16th, 2020 and April 20th, 2020 to examine the effects over time.

Table 2.Effects of all variables on park visitations
03/16/2020 03/23/2020 03/30/2020 04/06/2020 04/13/2020 04/20/2020
Coeff p value Coeff p value Coeff p value Coeff p value Coeff p value Coeff p value
Total Effects
Health Conditions 0.225*** 0 0.12*** 0.002 0.069 0.077 0.158*** 0 0.206*** 0 0.104*** 0.005
Socioeconomics 0.303* 0.078 0.171 0.103 0.092 0.178 0.298** 0.018 0.275* 0.04 0.156 0.673
Density -1.28** 0.018 -1.321*** 0 -1.56*** 0 -1.988*** 0 -1.311*** 0 -2.23*** 0
Design -0.003** 0.038 0.013** 0.018 0.031* 0.078 0.046* 0.086 0.001** 0.011 0.052** 0.012
Diversity -0.101 0.123 -0.107 0.232 -0.132 0.223 -0.132 0.182 -0.124 0.132 -0.134 0.232
Accessibility 0.049*** 0.001 0.081*** 0 0.084*** 0 0.124*** 0 0.079*** 0 0.121*** 0
Direct Effects
Health Conditions 0.225*** 0 0.12*** 0.002 0.069 0.077 0.158*** 0 0.206*** 0 0.104*** 0.005
Socioeconomics -0.059** 0.012 -0.016 0.507 -0.015 0.515 0.053** 0.028 -0.044* 0.07 -0.005 0.838
Density -0.645** 0.016 -0.668*** 0 -0.799*** 0 -1.007*** 0 -0.676*** 0 -1.124*** 0
Design -0.061** 0.041 -0.052 0.027 -0.039 0.137 -0.041 0.146 -0.057 0.013 -0.04 0.203
Diversity -0.097*** 0 -0.102*** 0 -0.126*** 0 -0.123*** 0 -0.122*** 0 -0.126*** 0
Accessibility 0.049*** 0.001 0.081*** 0 0.084*** 0 0.124*** 0 0.079*** 0 0.121*** 0
Indirect Effects
Health Conditions - - - - - - - - - - - -
Socioeconomics 0.362*** 0 0.187*** 0.002 0.107* 0.078 0.245*** 0 0.319*** 0 0.161*** 0.005
Density -0.635** 0.019 -0.653*** 0 -0.761*** 0 -0.981*** 0 -0.635*** 0 -1.106*** 0
Design 0.058 0.034 0.065*** 0.001 0.07*** 0.002 0.087*** 0 0.057*** 0.003 0.092*** 0.001
Diversity -0.004 0.519 -0.005 0.379 -0.006 0.421 -0.009 0.349 -0.002 0.679 -0.008 0.454
Accessibility - - - - - - - - - - - -

*p<0.1; ** p<0.05; ***p<0.01

Table 3.Total effects of all variables on travel distance to urban parks
03/16/2020 03/23/2020 03/30/2020 04/06/2020 04/13/2020 04/20/2020
Coeff p value Coeff p value Coeff p value Coeff p value Coeff p value Coeff p value
Health Conditions -0.073 0.144 -0.147*** 0 -0.091 0.022 -0.104*** 0.008 -0.102*** 0.009 -0.132*** 0.001
Socioeconomics 0.018 0.446 0.085*** 0.001 0.051 0.035 0.006 0.823 0.03 0.228 0.056** 0.02
Density -0.969*** 0.005 -0.854*** 0 -0.778*** 0 -0.602*** 0 -0.493*** 0.001 -0.989*** 0
Design 0.07* 0.07 0.059 0.227 0.033 0.206 0.021 0.331 0.018 0.387 0.048 0.189
Diversity 0.039*** 0.004 -0.01 0.432 -0.014 0.254 0.004 0.612 -0.015 0.204 0.002 0.891
Accessibility 0.049*** 0.001 0.081*** 0 0.084*** 0 0.124*** 0 0.079*** 0 0.121*** 0

*p<0.1; ** p<0.05; ***p<0.01
Note: Based on Figure 1, there are no mediating effects of all the variables on distance to urban parks. That is to say, the total effects equal direct effects.

(1) Density. The total effects of neighborhood density on park visitations, including direct and indirect effects, are significant and negative after the nationwide emergency announcement of COVID-19 (Mar 13th, 2020). This suggests that higher neighborhood density is associated with a lower rate of urban park visits during the pandemic. This could be due to the fact that higher population or employment density results in more green spaces accessible within the neighborhood, reducing the need to visit urban public parks, which could potentially expose residents to the risk of infection. This explanation also applies to the negative effect of density on the distance to urban parks, which exhibits a similar pattern as the effects on park visitations.

(2) Design. The built environment design has significant positive effects on park visitations after March 16th, 2020. This could be because individuals prefer to engage in physical activities around their homes rather than in public parks during the pandemic, as noted by Carr, Dunsiger, and Marcus (2010). Moreover, higher levels of intersection densities and street connectivity are known to contribute to increased physical activity, promoting walkability and public health enhancement (Molaei, Tang, and Hardie 2021). Interestingly, the direct effects of built environment design are not statistically significant for either urban park visitations or travel distance to urban parks, over time. However, the indirect effects are significant after the declaration of State of Emergency for COVID-19. On the other hand, the total effects of distance to parks are not significant after March 16th, 2020.

(3) Diversity. The overall impact of diversity on park visitation is not statistically significant; however, the direct effect of diversity is worth noting. This could be due to research indicating that mixed land use can enhance walkability in a community, potentially reducing residents’ inclination to visit urban parks (Mavoa et al. 2018). On the other hand, diversity does not significantly affect the distance to parks post-March 16th, 2020, implying that the effects of land use diversity are negligible during the pandemic. This could be attributed to the fact that many individuals are now working remotely, making them more likely to visit parks in close proximity to their homes or within their neighborhoods.


Acknowledgements

We would like to thank the comments from Dr. Xinyu Fu at University of Waikato.

Submitted: January 13, 2023 AEST

Accepted: March 20, 2023 AEST

References

Carr, Lucas J., Shira I. Dunsiger, and Bess H. Marcus. 2010. “Walk ScoreTM as a Global Estimate of Neighborhood Walkability.” American Journal of Preventive Medicine 39 (5): 460–63. https:/​/​doi.org/​10.1016/​j.amepre.2010.07.007.
Google ScholarPubMed CentralPubMed
Cortwright, Joe. 2020. “Cities and Coronavirus: Some Thoughts.” 2020. https:/​/​cityobservatory.org/​cities-and-coronavirus-some-thoughts-2/​.
Ding, Yizhen, Dongying Li, and Huiyan Sang. 2022. “Park Characteristics and Changes in Park Visitation before, during, and after COVID-19 Shelter-in-Place Order.” Sustainability 14 (6): 3579. https:/​/​doi.org/​10.3390/​su14063579.
Google Scholar
Fu, X., and W. Zhai. 2021. “Examining the Spatial and Temporal Relationship between Social Vulnerability and Stay-at-Home Behaviors in New York City during the COVID-19 Pandemic.” Sustainable Cities and Society 67:102757.
Google Scholar
Gao, Shuqi, Wei Zhai, and Xinyu Fu. 2023. “Green Space Justice amid COVID-19: Unequal Access to Public Green Space across American Neighborhoods.” Frontiers in Public Health 11 (February). https:/​/​doi.org/​10.3389/​fpubh.2023.1055720.
Google ScholarPubMed CentralPubMed
Geng, Dehui Christina, John Innes, Wanli Wu, and Guangyu Wang. 2021. “Impacts of COVID-19 Pandemic on Urban Park Visitation: A Global Analysis.” Journal of Forestry Research 32 (2): 553–67. https:/​/​doi.org/​10.1007/​s11676-020-01249-w.
Google ScholarPubMed CentralPubMed
Handy, Susan L., Marlon G. Boarnet, Reid Ewing, and Richard E. Killingsworth. 2002. “How the Built Environment Affects Physical Activity: Views from Urban Planning.” American Journal of Preventive Medicine 23 (2): 64–73. https:/​/​doi.org/​10.1016/​s0749-3797(02)00475-0.
Google Scholar
Krendl, A.C., and B.L. Perry. 2020. “The Impact of Sheltering-in-Place during the Covid-19 Pandemic on Older Adults’ Social and Mental Well-Being.” The Journals of Gerontology Series B Psychological Sciences and Social Sciences.
Google Scholar
Mavoa, Suzanne, Serryn Eagleson, Hannah M Badland, Lucy Gunn, Claire Boulange, Joshua Stewart, and Billie Giles-Corti. 2018. “Identifying Appropriate Land-Use Mix Measures for Use in a National Walkability Index.” Journal of Transport and Land Use 11 (1): 681–700. https:/​/​doi.org/​10.5198/​jtlu.2018.1132.
Google Scholar
Molaei, Pouya, Liyaning Tang, and Mary Hardie. 2021. “Measuring Walkability with Street Connectivity and Physical Activity: A Case Study in Iran.” World 2 (1): 49–61. https:/​/​doi.org/​10.3390/​world2010004.
Google Scholar
Venter, Zander S., David N. Barton, Vegard Gundersen, Helene Figari, and Megan Nowell. 2020. “Urban Nature in a Time of Crisis: Recreational Use of Green Space Increases during the COVID-19 Outbreak in Oslo, Norway.” Environmental Research Letters 15 (10): 104075. https:/​/​doi.org/​10.1088/​1748-9326/​abb396.
Google Scholar
Volenec, Zoe M., Joel O. Abraham, Alexander D. Becker, and Andy P. Dobson. 2021. “Public Parks and the Pandemic: How Park Usage Has Been Affected by COVID-19 Policies.” PloS One 16 (5): e0251799. https:/​/​doi.org/​10.1371/​journal.pone.0251799.
Google ScholarPubMed CentralPubMed
Weill, Joakim A., Matthieu Stigler, Olivier Deschenes, and Michael R. Springborn. 2020. “Social Distancing Responses to COVID-19 Emergency Declarations Strongly Differentiated by Income.” Proceedings of the National Academy of Sciences 117 (33): 19658–60. https:/​/​doi.org/​10.1073/​pnas.2009412117.
Google ScholarPubMed CentralPubMed
Xiong, Jiaqi, Orly Lipsitz, Flora Nasri, Leanna M.W. Lui, Hartej Gill, Lee Phan, David Chen-Li, et al. 2020. “Impact of COVID-19 Pandemic on Mental Health in the General Population: A Systematic Review.” Journal of Affective Disorders 277 (December):55–64. https:/​/​doi.org/​10.1016/​j.jad.2020.08.001.
Google ScholarPubMed CentralPubMed
Zhai, Wei, Mengyang Liu, Xinyu Fu, and Zhong-Ren Peng. 2021. “American Inequality Meets COVID-19: Uneven Spread of the Disease across Communities.” Annals of the American Association of Geographers 111 (7): 1–21. https:/​/​doi.org/​10.1080/​24694452.2020.1866489.
Google Scholar
Zhai, Wei, Haoyu Yue, and Yihan Deng. 2022. “Examining the Association between Urban Green Space and Viral Transmission of COVID-19 during the Early Outbreak.” Applied Geography 147 (October):102768. https:/​/​doi.org/​10.1016/​j.apgeog.2022.102768.
Google ScholarPubMed CentralPubMed

This website uses cookies

We use cookies to enhance your experience and support COUNTER Metrics for transparent reporting of readership statistics. Cookie data is not sold to third parties or used for marketing purposes.

Powered by Scholastica, the modern academic journal management system