
1. Questions
About one-third of all jobs are estimated to be “remote-eligible” (Dingel and Neiman 2020) but the San Francisco Bay Area is an outlier in that nearly 50% of the 1.79 million jobs in the region can be categorized this way (Bay Area Council Economic Institute 2020). This is more than any other metropolitan area in the United States, mostly due to the high concentration of employees in the fast-growing technology sector (i.e., Silicon Valley).
During the COVID-19 pandemic, the rapid adoption of remote work by tech employees (Levy 2020) led many to wonder if there would be a “mass exodus” (sf.citi 2022) of talent towards other tech hubs with a lower cost of living, less taxation, or higher quality of life. This research seeks to understand the true level of relocation interest among Bay Area tech workers, their underlying motivations, and the nature of intended destinations. Their migration patterns also suggest potential impacts on other “superstar” cities with tech-heavy workforces.
2. Methods
An online survey ran from November 2021 to March 2022, targeted at employees working at Silicon Valley technology companies. Participants only needed to meet the criteria of having a full-time employer in the software/technology sector and an assigned office in the Bay Area as of February 2020, thus allowing for employees who had relocated out of the region during the COVID-19 pandemic (though remaining with the same firm throughout was required). Participant recruitment began with known contacts identified at the top 20 (in terms of employee count) technology firms headquartered in the region, with subsequent waves reaching the target audience via snowball sampling.
Demographic data was summarized and compared with statistics from the American Community Survey (Czepiel 2016) and the U.S. EEOC (U.S. Equal Employment Opportunity Commission 2014) to ensure survey respondents were representative of the high-tech sector population as a whole. For example, the median age of the sample was 39.5 and thus comparable to the general population of software developers (39.0). The sample was also 66% male, compared to 64% of the population from EEOC data.
The survey included questions about participants’ employers and their remote work policies, interest in relocation due to remote work, potential destinations, and basic demographic information. The questions were crafted based on similar research regarding telework conducted on a national scale (Menon, Keita, and Bertini 2020) and commissioned research on a similar audience but in a different region (Sea.citi 2021).
661 survey respondents fit the screening criteria, out of 1,100 survey participants in total. Sample sizes for each question varied between 300-500 due to item non-response (all questions were optional). Over 120 unique technology firms were represented, with offices throughout the region and a slight concentration in downtown San Francisco.
3. Findings
53% of respondents expressed interest in relocation (out of N=382), with 20% having already moved by the time of survey. Of those with relocation interest, 64% cited remote work options as a primary factor in their consideration. A binary logit model for whether a participant had relocation interest showed meaningful contributing factors included age (younger) and number of children (fewer), but the most significant driver was the number of days expected in the office after the pandemic (Table 1). In fact, controlling for other variables, each additional day expected in the office post-pandemic reduced odds of relocation interest by 3%.
In turn, the number of employer-mandated days in the office as part of remote work policy accounted for 86% of days expected in the office in a separate linear regression model (R2 = 0.61, P-Value < 0.01, AIC = 348). Hence, as tech employers mandate more days in the office, employees feel the need to remain close by and reconsider their relocation plans.
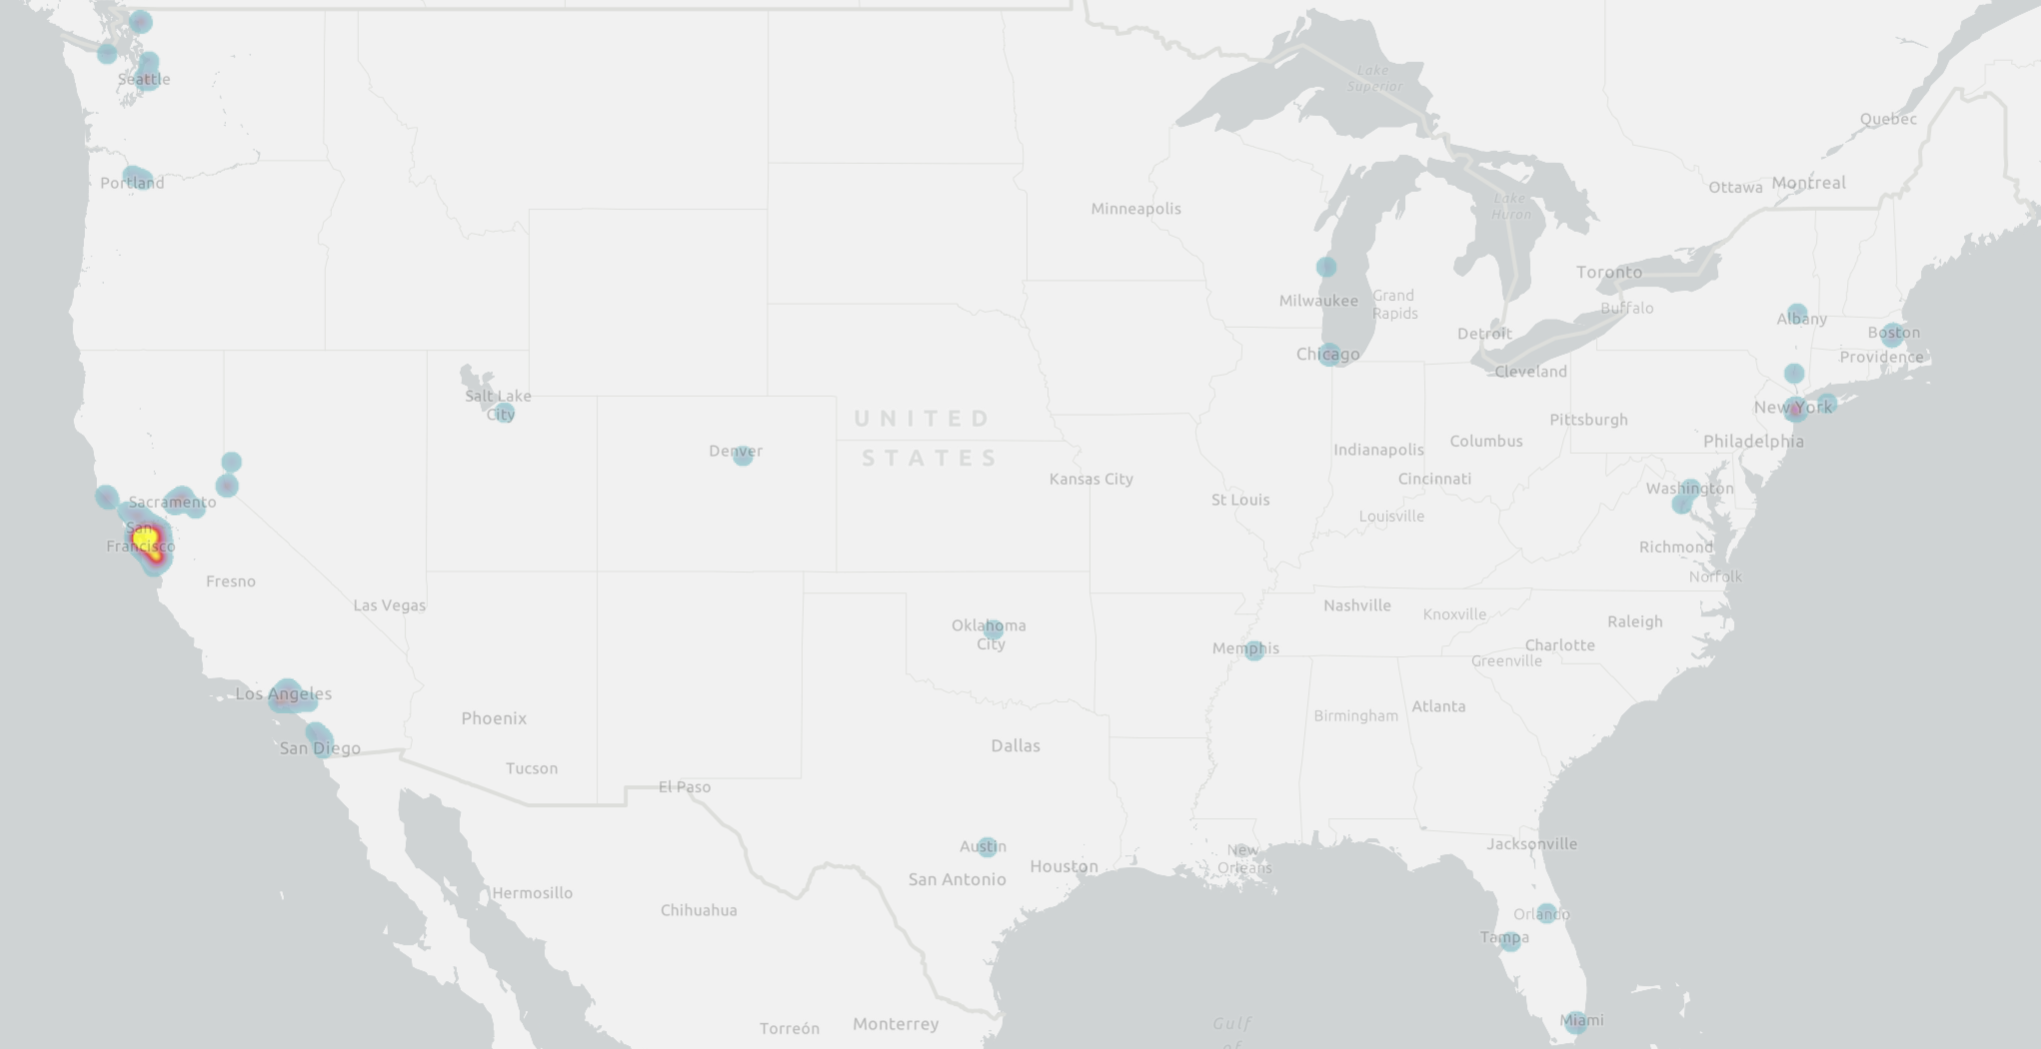
The median potential relocation distance (based on reported ZIP codes) was 33.68 km (N=143), suggesting that most moves would be within the region as opposed to between states. In fact, most participants with relocation interest were planning to stay within California (Figure 1). Other studies found pandemic-related decentralization of the tech industry, but that effect seems to stem primarily from distributed growth in new tech jobs rather than relocation of existing workers (Muro and You 2022).

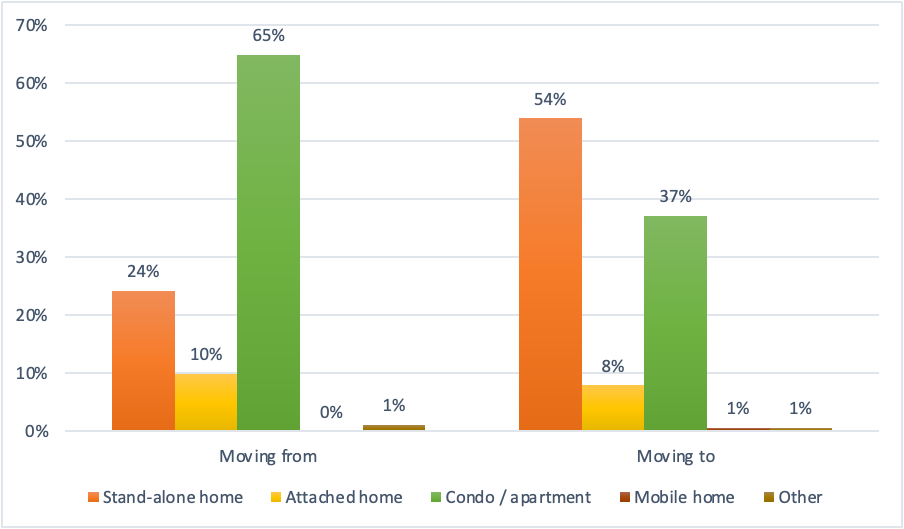
Instead of long-distance relocations, evidence pointed to tech workers simply dispersing into nearby suburbs. 43% of respondents with relocation interest expressed a preference to live in a suburb near a large city after the pandemic, as compared to 32% pre-pandemic (N=202). Additionally, 19% of those respondents cited “more space” as a reason for moving (N=203), echoed in preferences shifting towards stand-alone homes. (Figure 2).
.png)
Analyzing ZIP codes that respondents with relocation interest reported potential moves from/to revealed shifts towards areas with more traditionally “suburban” qualities such as lower population density and more households with children (Table 2). The slightly lower median home values in the destination ZIP codes suggest movers may also be seeking housing affordability.
Those who rented prior to the pandemic were also more likely to have already moved, and a substantial number became homeowners (Figure 3). A chi-squared test showed a correlation between renter/owner status before COVID-19 and interest in relocation (N=199, Cramér’s V = 0.160, P-Value = 0.0366). This aligned with national trends showing homeownership rates spiking during the pandemic (U.S. Department of Commerce 2022).
.png)
These findings mostly reflect the “donut effect” found by (Ramani and Bloom 2021) and aligns with the historical growth of suburbs over the last decade (Muller 2017), as nearly all relocation interest remained within the immediate suburbs of the region. The desired characteristics of moving destinations (e.g., single-family homes, more space) also reflected mostly “lifestyle” based rationale, matching findings for high-income households in the study by (Haslag and Weagley 2022).
Together, this paints a narrative of tech workers, flush with cash and stock equity during the COVID-19 pandemic, deciding to finally leave their expensive apartments in San Francisco and purchase larger homes in the surrounding suburbs. Notably, the lower cost of living in other states was not enough to sway most tech workers from migrating out of California. Employer pressure to come back into the office at least some days of the week has tempered what fleeting interest there was in more far-flung relocation.