


1. Questions
Several surveys conducted within the first year of the COVID-19 pandemic identified a potential for increased car ownership. Basu and Ferreira (2021) found that 18% of zero-car households in the Boston metro area planned to buy a car due to the pandemic, with 26% planning to do so within a year of the survey. According to a survey of 3,021 respondents conducted by cars.com, a major online marketplace for cars, nearly 20% of those who had never owned a car were actively considering purchasing one (Newman 2020). Respondents cited the airborne transmission risks of the disease and the need for physical distancing to be major motivations for the need for a car.
The goal in this paper is to assess how far the intentions for increased car ownership have been actually realized. The main research question considered is: to what extent has car-ownership levels changed after the COVID-19 pandemic, compared to before? The primary indicator of interest is carlessness, or the proportion of households with zero owned or leased cars, with the hypothesis being that carlessness levels have declined since the pandemic. For a more complete evaluation of changes in car-ownership during the pandemic, I also analyze changes in the total number of cars per household.
The second research question is: to what extent do altered levels of car-ownership, if any, vary among different types of households? I evaluate changes in the ownership measures by income levels, and by minority and age (young household) status.
These questions are motivated by a need to understand which households were financially burdened during the pandemic due to the need to purchase a car. I focus on the aforementioned household subgroups due to their documented transportation-related hardships in the aftermath of a previous (economic) crisis, the Great Recession of 2008 (Thakuriah and Keita 2014; Papagiannakis, Baraklianos, and Spyridonidou 2018), as well as due to the continued need for low-wage workers to travel during the pandemic due to lower opportunities for remote work (Brough, Freedman, and Phillips 2021). Changes in car-ownership levels could also potentially have an impact on public transportation ridership, which has been greatly impacted by the pandemic.
2. Methods
The analysis utilizes data on 13,140 urban and rural households (first quarter of 2018 to the first quarter of 2022) from the Consumer Expenditure Survey (CEX), a nationally representative and continuous survey with quarterly reports on household socio-demographics, assets, expenditures and income, including data on car-ownership (U. S. Bureau of Labor Statistics, n.d.). Each observation in the dataset used is on a household’s 12-month expenditure and income characteristics, which was constructed by using repeated data on each household over four or more quarters. Details on covariates and household groups are given in Table 1.
Binary logit and Poisson models were estimated of carless (an indicator that takes a value of 1 if a household spent one or more quarters with zero owned or leased automobiles) and vehicles (total count of cars), respectively. The key covariate, COVID, takes a value of 1 if the earliest quarter that the ith household is in the sample, is on or after March 2020, when physical distancing measures were widely instituted in many parts of the US. The goals of these two parsimonious models are an exploratory analysis of carless and vehicles for the two time periods – and not to build predictive or causal models. The sign of the COVID variable remains robust across a variety of model specifications, although the effect sizes and significance levels change. A range of goodness-of-fit measures indicate that the estimated models are a reasonable basis to evaluate the research questions. χ2 tests of carless and Welch’s t-tests of vehicles provide secondary evidence of changes by value of COVID.
3. Findings
The proportion of carless households among all households peaked at over 8% in 2015, and has been declining since then. Figure 1 shows that within the study period, the greatest decline in carlessness occurred during the second quarter of 2020, particularly for low-income, minority and young households. However, carlessness among some groups of households increased after the last quarter of 2021.

Table 2 shows that the unconditional sample proportions of carless households in the full sample declined from 5.10% prior to the pandemic, to 3.8% after. Controlling for the additional covariates, the marginal effect of COVID is -0.014 and significant at the .01 level for the model for all households.
_model.png)
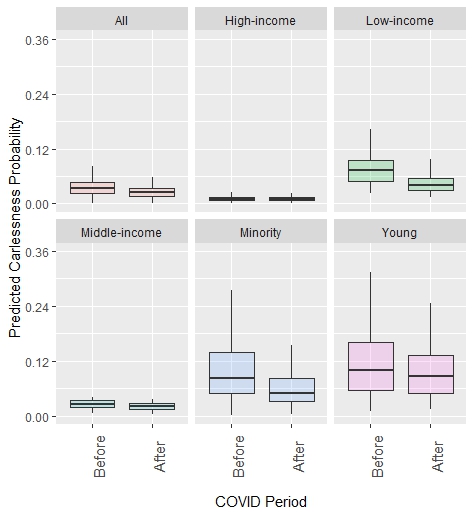
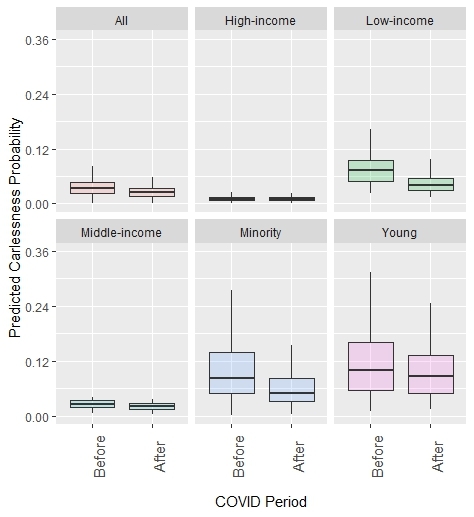
Prior to the pandemic, about 10% of low-income households and 11% of minority households did not have a car, compared to 5.8% and 6.8% after, a statistically significant decline for both groups, with the binary logit marginal effects being -0.037 and -0.04 respectively. Considering the propensity of households to maintain steady consumption levels over a period of time that is consistent with their expectations, as per the permanent income hypothesis, yearly expenditures rather than annual incomes have been used to assess household economic wellbeing. Middle-income households experienced only a minor decrease with a marginal effect of -0.007, while COVID is not significant for young households (the unconditional proportion carless before was 12%, compared to 10% after). Figure 2, which presents the predicted probabilities of being carless with boxplots, shows that the propensity for carlessness is lower after the pandemic for the full sample, low-income and minority households, and to a minor extent, for middle-income households.
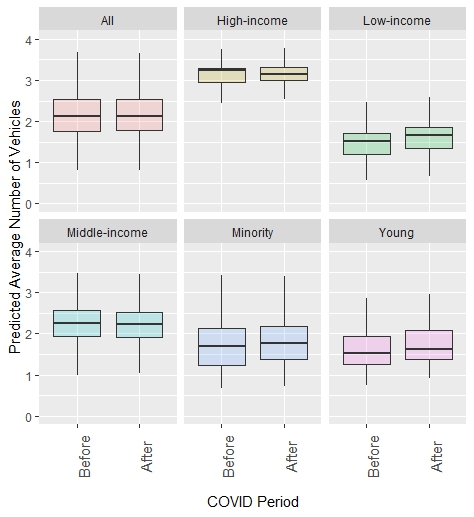
For the full sample of households, the unconditional mean vehicles per household increased slightly, from 2.14 before the pandemic, to 2.16 after (Table 3), but the difference is not statistically significant. After adjusting for the controls, the estimated 12.9% increase in vehicles is significantly higher only for low-income households (p < .01), as shown in the boxplots on predicted vehicles in Figure 3.

_from_poisson_regr.jpeg)
The model results also show that vehicles for high-income households decreased 8% after the pandemic, which presumably reflects a reduced need for multiple household vehicles, or even a single vehicle, due to a decline in out-of-home travel for work or other purposes. There is no discernable difference in total number of vehicles for young and middle-income households between the two periods. Inflation-adjusted prices of both new and used cars from November 2020 onwards till the end of the “after” period considered were at their highest levels since 2001, which may have also affected car-ownership levels (The Fred Blog 2022).
Over the period considered, an increase in family size predicts a decline in carlessness and an increase in the number of vehicles. An increase in the proportion of working members is predicted to decrease carlessness for minority, young and middle-income households, and to increased number of vehicles for all groups except low-income households. Carlessness is higher among urban residents and apartment dwellers; these two covariates are further associated with lower rates of vehicles. An increase in annual expenditures is predicted to lead to a lower propensity for carlessness for all groups, except for the low-income group, and higher rates of household vehicles for all except the high-income group.
The analysis provides empirical evidence that increased intentions to purchase an automobile as documented by surveys conducted early in the pandemic, have translated into lower levels of carlessness among all households considered, and for minority, and low- and middle-income households, in particular. There is also evidence of higher number of vehicles owned by low-income households.
The findings underscore the additional financial burden of higher car-ownership on families who suffered from high unemployment rates and health inequities during the pandemic, and are also more likely to have members working in low-wage occupations that require a person to physically be present at work. Members of such households are also more likely to use public transportation, which may have a detrimental influence on transit ridership recovery due to their shift to car use. There is also evidence of an increase in carlessness for specific households after the fourth quarter of 2021. The revival could be attributed to reduced numbers of carless households moving to car ownership about two years following the beginning of the pandemic. It could, however, also entail the loss of recently purchased vehicles due to financial difficulties in making auto payments. Car loan defaults were lower during the pandemic, thanks in part to COVID relief provided by vehicle dealers and other coping techniques such as the US government’s stimulus funds. However, the reasons for the revival are likely to differ by subgroup, which warrants further analysis, for example, young households’ carlessness levels may have increased recently because many young adults moved back with their parents during the pandemic. Overall, sustained car-ownership may not be viable for some in the long-term, pointing to a renewed impetus for affordable and healthy travel alternatives to the private car.