Processing math: 100%
Findings
  • Menu
  • Articles
    • Resilience Findings
    • Transport Findings
    • Urban Findings
    • All
  • For Authors
  • Editorial Board
  • About
  • Blog
  • search

    Sorry, something went wrong. Please try your search again.
    ×

    • Articles
    • Blog posts

RSS Feed

Enter the URL below into your favorite RSS reader.

https://findingspress.org/feed
×
Transport Findings
February 15, 2019 AEST

Understanding Trip Happiness using Smartphone-Based Data: The Effects of Trip- and Person-Level Characteristics

Yingling Fan, Roland Brown, Kirti Das, Julian Wolfson,
smartphone happiness well-being emotion affect travel behavior trip
Copyright Logoccby-nc-4.0 • https://doi.org/10.32866/7124
Photo by JULIAN ALEXANDER on Unsplash
Findings
Fan, Yingling, Roland Brown, Kirti Das, and Julian Wolfson. 2019. “Understanding Trip Happiness Using Smartphone-Based Data: The Effects of Trip- and Person-Level Characteristics.” Findings, February. https://doi.org/10.32866/7124.
Save article as...▾
  • PDF
  • XML
  • Citation (BibTeX)
Data Sets/Files (6)
Download all (6)
  • Figure 1: Daynamica Main Interface
    Download
  • Table 1: Percentage Distribution of Survey Participants (N=350)
    Download
  • Figure 2: Percentage Distribution of Emotional Experiences During the Trip
    Download
  • Table 2: Percentage Distribution of Trips (N=9,541)
    Download
  • Table 3: Regression Results
    Download
  • Figure 3: Radar Plot Indicating Relationship Strength
    Download

Sorry, something went wrong. Please try again.

If this problem reoccurs, please contact Scholastica Support

Error message:

undefined
×

View more stats

Abstract

Understanding trip happiness—a measurement of people’s emotional well-being during trips—is an essential aspect of people-oriented transportation planning. We use data collected via smartphones from 350 residents in the Minneapolis-St. Paul region to examine trip- and person-level factors associated with trip happiness. Trip mode, purpose, duration, distance, companionship, activities during the trip, and temporal characteristics of the trip are significantly associated with trip happiness. Mode and companionship are the strongest predictors of trip happiness. Among personal factors, age is the strongest predictor, followed by general happiness of the person. Race, gender, and neighborhood have modest effects on trip happiness.

Research Question and Hypotheses

Trip happiness, defined as people’s emotional well-being during daily trips, can play a significant role in people’s general health and wellness. Using unique smartphone-based survey data, this research examines how trip and personal characteristics may affect trip happiness in the Minneapolis–St. Paul metropolitan region in the United States. The research contributes to the limited literature on travel behavior and emotional well-being available (Raveau et al. 2016; De Vos 2018; Zhu and Fan 2018a, 2018b; Chen et al. 2019). The research questions include:

  • How does trip happiness vary across trip categories?

  • How does trip happiness vary across population groups?

The corresponding research hypotheses are:

  • Trip happiness is significantly associated with a number of trip characteristics, including mode, purpose, companionship, temporal characteristics, distance, duration, and activities during the trip.

  • Trip happiness is significantly associated with a number of personal characteristics, including gender, age, race, income, education, family structure, neighborhood location, and general happiness levels.

Methods and Data

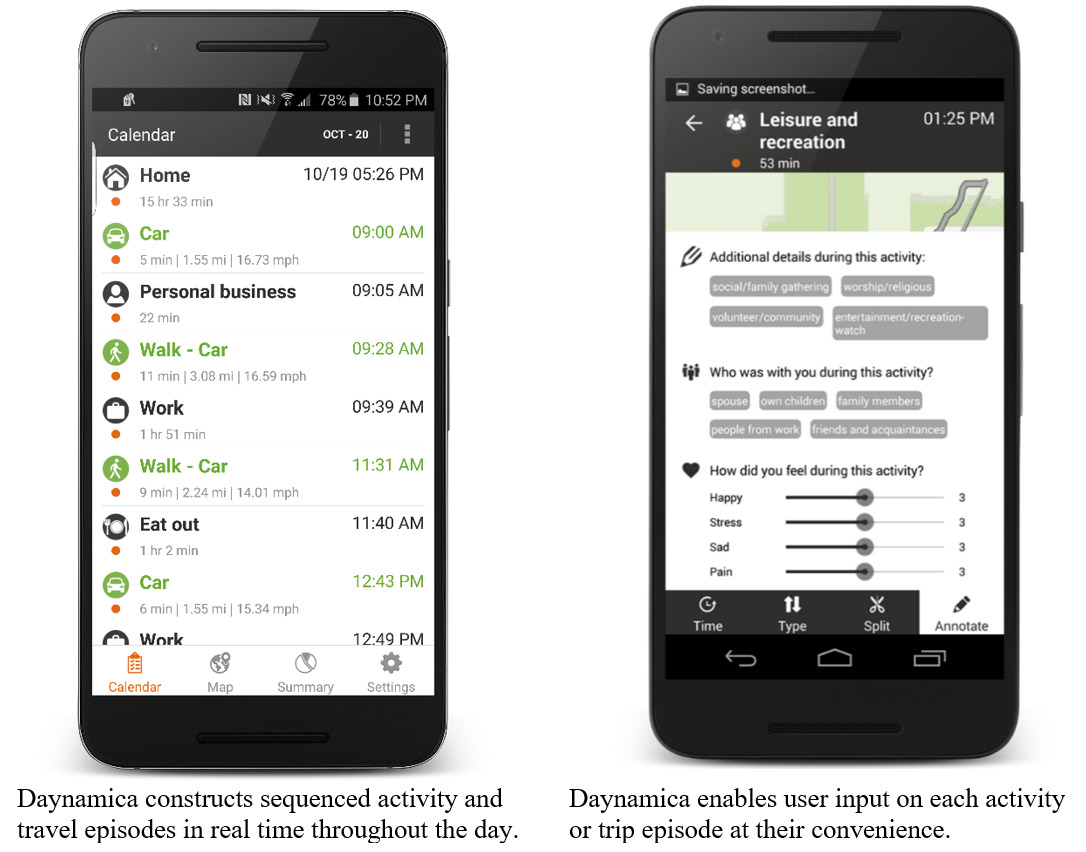
To collect trip happiness data, the study used the Android-based smartphone application Daynamica, previously SmarTrAC (Fan et al. 2015). Daynamica is capable of detecting activities and trips in real time to construct sequenced activity/trip episodes throughout the day (Figure 1, left). It also allows the user to annotate the detected activities/trips with additional information such as emotional experiences during each activity/trip at their convenience (Figure 1, right).

Figure 1
Figure 1:Daynamica Main Interface

Daynamica constructs sequenced activity and travel episodes in real time throughout the day.

A Daynamica-based trip happiness survey was conducted in the Minneapolis–St. Paul metropolitan region between October 17, 2016 and October 25, 2017. The survey successfully recruited 372 residents from six neighborhoods in the region. Each participant carried a smartphone equipped with the Daynamica app for seven consecutive days. Among the 372 participants, 350 provided valid activity and trip data. The final sample used in the analysis included a total of 9,541 completed trips generated by the 350 survey participants.

Table 1 summarizes the characteristics of the 350 survey participants. The majority of the participants were female (67%), home owners (72%), married (61%), white (78%), pretty happy in general (57%), held a bachelor’s degree or higher (71%), and had an annual household income greater than US$50,000 (64%).

Table 1:Percentage Distribution of Survey Participants (N=350)
Gender Home Ownership
Category Percentage Category Percentage
Male 33% Owner 72%
Female 67% Renter 28%
Total 100% Total 100%
Spouse Presence Children Presence
Category Percentage Category Percentage
Yes 61% Yes 31%
No 39% No 69%
Total 100% Total 100%
Age Race
Category Percentage Category Percentage
18–25 7% White 78%
26–30 11% Asian 4%
31–40 17% Black 10%
41–50 17% American Indian 2%
51–65 29% Multiracial 6%
> 65 20%
Total 100% Total 100%
Income Education
Category Percentage Category Percentage
<10k 7% Below HS 2%
10k–25k 10% HS/GED 7%
25k–50k 15% Associate/Technical 7%
50k–75k 19% Some College 14%
75k–100k 17% Bachelors 33%
>100k 27% Graduate 38%
Unknown/Missing 4%
Total 100% Total 100%
Neighborhood General Happiness
Category Percentage Category Percentage
Blaine 14% Very Happy 35%
Brooklyn Center 14% Pretty Happy 57%
Near North 15% Not Happy 8%
Phillips 18%
Prospect Park 19%
St. Anthony Park 19%
Total 100% Total 100%

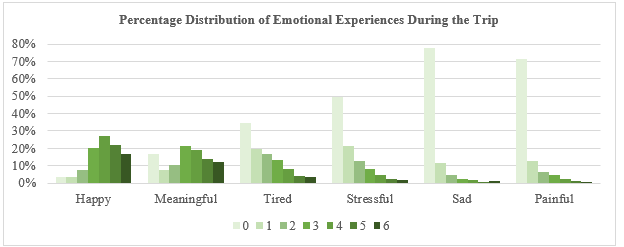
For each trip episode, the Daynamica app prompts the respondent to rate the intensity of six different emotion variables, using a scale of 0–6: happy, pain, sad, tired, stressful, and meaningful. The questions were phrased similarly for rating each of the six variables. For example, the question for the “happy” dimension was: “From 0 to 6, where a 0 means you were not happy at all and a 6 means you were very happy, how happy did you feel during this time?”

Figure 2 shows the percentage distribution of the six variables. During most trips, people reported relatively high levels of happy and meaningful emotions. Over 90% of the trips were associated with some level of happiness, and over 80% of the trips were associated with some level of meaningfulness. In contrast, less than 30% of the trips were associated with any levels of sad or painful feelings.

Figure 2
Figure 2:Percentage Distribution of Emotional Experiences During the Trip

Overall trip happiness is measured by a composite index score that takes into account all six emotion variables. Following the concept of average net affect, trip happiness is average positive feelings less average negative feelings. The formula to calculate trip happiness follows. The calculated trip happiness scores in this study range between –6 and +6 and have a mean of 2.55 and a standard deviation of 1.92.

Trip Happiness =Average Net Affect=Happy+Meaningful2−Tired+Stressful+Sad+Painful4

In addition to trip happiness, Daynamica records detailed spatiotemporal information about each trip, including the trip start and end times, the date, locations of the trip origin and destination, and the trip trajectory. The recorded information also includes the transportation modes involved in the trip, the main trip purpose, trip companionship, as well as activities performed during the trip.

Table 2 summarizes the characteristics of the trip data. The majority of the trips were car trips (68%), trips made alone (57%), trips made between 9:00 a.m. and 4:00 p.m. (52%), and trips made on weekdays (76%). The most common trip purpose category was to return home (30%), the largest activity-during-trip category was listening to music (41%), and the largest trip duration and distance categories were respectively 5–15 minutes (44%) and 3–10 miles (33%).

Table 2:Percentage Distribution of Trips (N=9,541)
Primary Trip Modea Primary Trip Purpose
Category Percentage Category Percentage
Car 68% Home 30%
Walk 18% Leisure 15%
Bike 4% Work 15%
Bus 4% Shop 14%
In Vehicle 4% Personal Business 13%
Rail 1% Eat Out 6%
Other 1% Other 6%
Education 3%
Total 100% Total 100%
Trip Companionship Activity During Trip
Category Percentage Category Percentage
Alone 57% Listen to Music 41%
Spouse 17% Talk with People 31%
Children 13% Relax 27%
Friends 10% Nothing 21%
Family 8% Work 2%
Neighbors 2% Pleasure Reading 1%
Coworker 2%
Totalb 109% Totalb 124%
Trip Duration Trip Start Time
Category Percentage Category Percentage
<5 minutes 21% 0:00–6:00 4%
5–15 minutes 44% 6:00–9:00 16%
15–30 minutes 24% 9:00–16:00 52%
30–60 minutes 9% 16:00–19:00 20%
>60 minutes 2% 19:00–0:00 8%
Total 100% Total 100%
Trip Distance Weekday Status
Category Percentage Category Percentage
<1 mile 25% Weekday 76%
1–3 miles 26% Weekend 24%
3–10 miles 33%
>10 miles 17%
Total 100% Total 100%

aMutliple modes may be involved in a trip. The primary trip mode is defined as the mode that is associated with the longest travel distance during the entire trip.
bThe total percentages of trip companionship and activities during the trip is higher than 100% because people can select multiple companionship and activity categories.

To estimate the effects of trip- and person-level factors on the trip happiness score (i.e., the average net affect score), we used a linear mixed effects model with a random intercept for each individual. We chose this model for two reasons: (1) to account for dependence between multiple trip entries from the same individual, and (2) the dependent variable is the net affect score, which is continuous, ranging from –6 to +6.

A full model was fit with all independent variables of interest included as fixed effects, and a final model was chosen by removing factors that were not significant at the 0.05 level. P-values were calculated using Satterthwaite’s degrees of freedom and were not adjusted for multiple comparisons. The factors removed from the final model include education, income, home ownership, and family structure. Race was kept as a factor in the final model because one of the race categories, Black, positively predicts trip happiness at a p-value of 0.056.

Two R2 analogues for mixed effects models were used to assess goodness-of-fit for each model: (1) marginal R2, which measures the proportion of variance explained by the fixed effects; and (2) conditional R2, which measures the proportion of variance explained by both the fixed and random effects (Nakagawa and Schielzeth 2013). Analyses were completed in R version 3.5.1 (R Core Team 2018), using the lme4 package model estimation (Bates et al. 2015), the lmerTest package for calculating Satterthwaite’s degrees of freedom and p-values (Kuznetsova, Brockhoff, and Christensen 2017), and the MuMIn package for calculation of the pseudo-R2 values (Barton 2018).

Findings

Table 3 presents the results from the two linear mixed effects models: One is the full model with all variables included, and the other is the final model with deliberately reduced variables. The R2 statistics show that the full and final models have similar levels of goodness-of-fit. In addition, conditional R2 is much higher than marginal R2 in both models, indicating the importance of allowing both fixed and random effects.

For the purpose of clarity, results from the final models are interpreted as follows. Results from the full model are not interpreted but are reported in Table 3 for reference purposes only. According to the final model in Table 3, trip mode, purpose, duration, distance, companionship, activities during the trip, and temporal characteristics of the trip all significantly affect trip happiness in the following manners:

  • Mode: Biking and walking trips have significantly higher happiness ratings than car trips. There is no significant difference in trip happiness among car, bus, and rail trips.

  • Purpose: Trips made for eating out and leisure purposes are significantly rated happier than return home trips and other nondiscretionary trips such as education, personal business, and shopping trips.

  • Temporal Characteristics: Trips made earlier than 6:00 a.m. and later than 7:00 p.m. are rated significantly less happy than trips made during other times of the day. Weekday trips are rated significantly less happy than weekend trips.

  • Companionship: Trips made alone or with coworkers are rated significantly less happy than trips made with family and/or friends.

  • Activities during Trip: Trips during which people reported talking, relaxing, and listening to music are rated significantly happier than trips where people are working, reading, or doing nothing.

  • Trip Length: Trips with a duration of between 15 and 30 minutes are rated the happiest, and trips with a distance longer than 10 miles are rated the most unhappy.

Among various personal factors, age, gender, neighborhood, and general happiness of the person significantly affect trip happiness at the significance level of 0.05. Male, older adults (age >50), and people who reported being generally happy in their lives had higher levels of trip happiness. Residents in Near North and St. Anthony Park have lower levels of trip happiness than residents in other neighborhoods in the study. Race is not significant in most cases, but one of the race variables, Black, positively predicts trip happiness with a p-value of 0.056. Income, education, home ownership, and family structure were excluded from the final model because they show no association with trip happiness.

Table 3:Regression Results
The Full Model The Final Model
Covariate Estimate (95% CI) p-value Estimate (95% CI) p-value
(Intercept) 3.50 (2.60, 4.40) <0.001 3.39 (2.87, 3.92) <0.001
Primary Mode: Bike (vs. Car) 0.87 (0.71, 1.03) <0.001 0.87 (0.71, 1.03) <0.001
Primary Mode: Bus (vs. Car) -0.05 (-0.22, 0.12) 0.583 -0.05 (-0.22, 0.12) 0.588
Primary Mode: In Vehicle (vs. Car) 0.05 (-0.11, 0.20) 0.573 0.05 (-0.11, 0.20) 0.573
Primary Mode: Other (vs. Car) 0.19 (-0.13, 0.51) 0.244 0.19 (-0.13, 0.51) 0.243
Primary Mode: Rail (vs. Car) 0.11 (-0.12, 0.34) 0.352 0.11 (-0.12, 0.34) 0.349
Primary Mode: Walk (vs. Car) 0.60 (0.50, 0.69) <0.001 0.60 (0.50, 0.69) <0.001
Trip Purpose: Eat Out (vs. Home) 0.18 (0.07, 0.29) 0.001 0.18 (0.07, 0.29) 0.001
Trip Purpose: Education (vs. Home) -0.11 (-0.28, 0.05) 0.171 -0.12 (-0.28, 0.05) 0.168
Trip Purpose: Leisure (vs. Home) 0.27 (0.18, 0.35) <0.001 0.27 (0.18, 0.35) <0.001
Trip Purpose: Other (vs. Home) -0.09 (-0.21, 0.02) 0.111 -0.09 (-0.21, 0.02) 0.107
Trip Purpose: Personal Business (vs. Home) -0.03 (-0.12, 0.05) 0.456 -0.03 (-0.12, 0.05) 0.461
Trip Purpose: Shop (vs. Home) -0.02 (-0.10, 0.07) 0.684 -0.02 (-0.10, 0.07) 0.696
Trip Purpose: Work (vs. Home) -0.06 (-0.15, 0.03) 0.166 -0.06 (-0.15, 0.03) 0.167
Weekday (vs. Weekend) -0.18 (-0.24, -0.12) <0.001 -0.18 (-0.24, -0.12) <0.001
Start Time: 0:00–6:00 (vs. 6:00–9:00) -0.16 (-0.30, -0.02) 0.025 -0.16 (-0.30, -0.02) 0.027
Start Time: 9:00–16:00 (vs. 6:00–9:00) 0.02 (-0.06, 0.09) 0.637 0.02 (-0.06, 0.09) 0.633
Start Time: 16:00–19:00 (vs. 6:00–9:00) 0.02 (-0.07, 0.11) 0.693 0.02 (-0.07, 0.11) 0.690
Start Time: 19:00–0:00 (vs. 6:00–9:00) -0.16 (-0.28, -0.05) 0.005 -0.16 (-0.28, -0.05) 0.005
Trip Duration: 5–15 min (vs. < 5 min) 0.04 (-0.04, 0.11) 0.388 0.03 (-0.05, 0.11) 0.395
Trip Duration: 15–30 min (vs. < 5 min) 0.14 (0.04, 0.25) 0.009 0.14 (0.04, 0.25) 0.009
Trip Duration: 30–60 min (vs. < 5 min) 0.06 (-0.08, 0.20) 0.377 0.06 (-0.08, 0.20) 0.383
Trip Duration: > 60 min (vs. < 5 min) 0.11 (-0.10, 0.31) 0.311 0.11 (-0.10, 0.31) 0.312
Trip Distance: 1–3 mi (vs. < 1 mi) 0.02 (-0.07, 0.11) 0.610 0.02 (-0.07, 0.11) 0.612
Trip Distance: 3–10 mi (vs. < 1 mi) -0.01 (-0.11, 0.10) 0.907 -0.01 (-0.11, 0.10) 0.902
Trip Distance: > 10 mi (vs. < 1 mi) -0.16 (-0.30, -0.02) 0.026 -0.16 (-0.30, -0.02) 0.026
Trip Companion: Family 0.30 (0.19, 0.41) <0.001 0.30 (0.20, 0.41) <0.001
Trip Companion: Friends 0.51 (0.41, 0.61) <0.001 0.51 (0.41, 0.61) <0.001
Trip Companion: Children 0.32 (0.22, 0.41) <0.001 0.32 (0.23, 0.42) <0.001
Trip Companion: Spouse 0.23 (0.15, 0.32) <0.001 0.23 (0.14, 0.31) <0.001
Trip Companion: Boss/Coworker 0.07 (-0.11, 0.26) 0.442 0.07 (-0.12, 0.26) 0.456
Trip Companion: Neighbors 0.34 (0.16, 0.52) <0.001 0.34 (0.16, 0.52) <0.001
Activity During Trip: Work -0.02 (-0.24, 0.20) 0.831 -0.02 (-0.24, 0.20) 0.854
Activity During Trip: Reading -0.16 (-0.41, 0.09) 0.207 -0.16 (-0.41, 0.09) 0.207
Activity During Trip: Listen to Music 0.15 (0.09, 0.22) <0.001 0.16 (0.09, 0.22) <0.001
Activity During Trip : Relax 0.16 (0.09, 0.23) <0.001 0.16 (0.09, 0.23) <0.001
Activity During Trip: Talk 0.31 (0.24, 0.38) <0.001 0.31 (0.24, 0.38) <0.001
Male (vs. Female) 0.29 (-0.03, 0.60) 0.076 0.32 (0.02, 0.62) 0.037
Brooklyn Center (vs. Blaine) -0.47 (-1.03, 0.08) 0.095 -0.51 (-1.04, 0.02) 0.060
Near North (vs. Blaine) -0.53 (-1.13, 0.07) 0.084 -0.57 (-1.14, 0.00) 0.050
Phillips (vs. Blaine) -0.36 (-0.90, 0.18) 0.194 -0.43 (-0.94, 0.09) 0.103
Prospect Park (vs. Blaine) -0.32 (-0.85, 0.20) 0.227 -0.42 (-0.92, 0.07) 0.095
St. Anthony Park (vs. Blaine) -0.58 (-1.11, -0.05) 0.033 -0.71 (-1.20, -0.21) 0.006
Age: 18–25 (vs. >65) -1.98 (-2.69, -1.28) <0.001 -1.81 (-2.46, -1.16) <0.001
Age: 26–30 (vs. >65) -1.31 (-1.89, -0.72) <0.001 -1.34 (-1.88, -0.80) <0.001
Age: 31–40 (vs. >65) -1.21 (-1.74, -0.67) <0.001 -1.15 (-1.63, -0.67) <0.001
Age: 41–50 (vs. >65) -0.95 (-1.48, -0.41) <0.001 -0.91 (-1.38, -0.44) <0.001
Age: 51–65 (vs. >65) -0.25 (-0.68, 0.18) 0.258 -0.28 (-0.70, 0.14) 0.186
Race: Black (vs. White) 0.41 (-0.23, 1.06) 0.208 0.57 (-0.01, 1.15) 0.056
Race: Other (vs. White) -0.01 (-0.50, 0.49) 0.984 0.01 (-0.47, 0.49) 0.957
HS and Below (vs. Graduate) 0.40 (-0.23, 1.04) 0.212
Assoc/Tech/Some College (vs. Graduate) 0.32 (-0.15, 0.78) 0.181
Bachelors (vs. Graduate) 0.14 (-0.22, 0.49) 0.460
Income: <25k (vs. >100k) -0.42 (-1.06, 0.21) 0.189
Income: 25k–50k (vs. >100k) -0.17 (-0.72, 0.39) 0.555
Income: 50k–75k (vs. >100k) -0.23 (-0.70, 0.23) 0.329
Income: 75k–100k (vs. >100k) -0.18 (-0.64, 0.28) 0.438
Income: Unknown (vs. >100k) -0.03 (-0.86, 0.81) 0.952
Homeowner 0.01 (-0.46, 0.48) 0.979
Spouse Present -0.25 (-0.61, 0.11) 0.172
Child <18 Years 0.16 (-0.21, 0.53) 0.386
Pretty Happy (vs. Very Happy) -0.33 (-0.65, -0.01) 0.043 -0.32 (-0.64, -0.01) 0.043
Not Happy (vs. Very Happy) -1.39 (-2.02, -0.76) <0.001 -1.37 (-1.98, -0.77) <0.001
Summary Statistics
N 9,541 9,541
Marginal R2: Fixed Effects Only 0.176 0.171
Conditional R2: Fixed + Random Effects 0.629 0.624

Note: Variables with a p-value of less than 0.05 in the final model are shown in bold font.

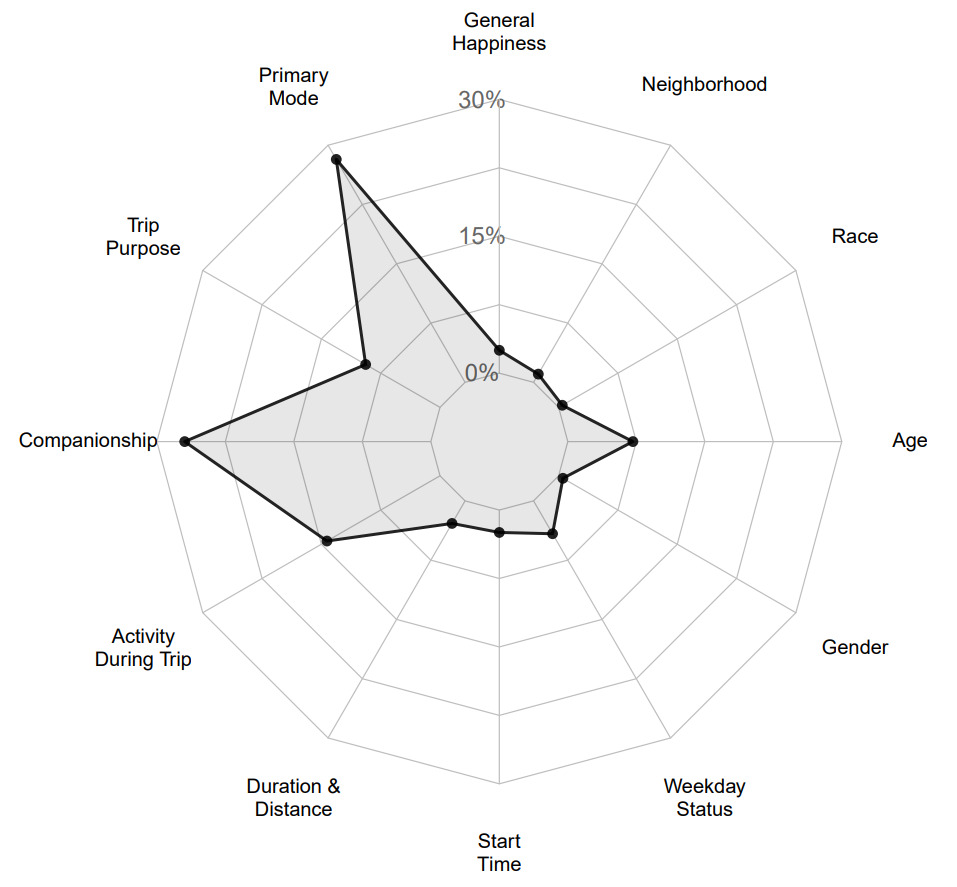
Figure 3 shows a variable importance radar chart indicating the percentage of explained variability in the happiness outcome attributable to 12 different sets of factors. Among the trip-level factors, mode and companionship explain the greatest amount of variability in trip happiness. Among personal factors, age explains the most, followed by general happiness of the individual. Race, gender, and neighborhood have modest effects on trip happiness. Overall, trip-level characteristics are much more important than person-level characteristics in predicting trip happiness.

Figure 3
Figure 3:Radar Plot Indicating Relationship Strength

Acknowledgments

This study was funded by the Sustainable Research Network project of the US National Science Foundation: Integrated Urban Infrastructure Solutions for Environmentally Sustainable, Healthy and Livable Cities. (Award #: 1444745).

Dr. Yingling Fan is cofounder and Chief Executive Officer of Daynamica, Inc. Dr. Julian Wolfson is cofounder and Chief Technology Officer of Daynamica, Inc. They hold equity and royalty interests in Daynamica along with the University of Minnesota, pursuant to the exclusive license agreement involving the software program that provides smartphone solutions for travel and activity capturing. These interests have been reviewed and managed by the University of Minnesota in accordance with its Conflict of Interest policies.

References

Barton, K. 2018. “MuMIn: Multi-Model Inference. R Package Version 1.42.1.” https://CRAN.R-project.org/package=MuMIn.
Google Scholar
Bates, D., M. Mächler, B. Bolker, and S. Walker. 2015. “Fitting Linear Mixed-Effects Models Using Lme4.” Journal of Statistical Software 67: 1–48. https://www.jstatsoft.org/article/view/v067i01.
Google Scholar
Chen, Shuyan, Yingling Fan, Yang Cao, and Aemal Khattak. 2019. “Assessing the Relative Importance of Factors Influencing Travel Happiness.” Travel Behaviour and Society, January. https://doi.org/10.1016/j.tbs.2019.01.002.
Google Scholar
De Vos, J. 2018. “Towards Happy and Healthy Travellers: A Research Agenda.” Journal of Transport & Health 11: 80–85.
Google Scholar
Fan, Y., J. Wolfson, G. Adomavicius, K. Vardhan Das, Y. Khandelwal, and J. Kang. 2015. “SmarTrAC: A Smartphone Solution for Context-Aware Travel and Activity Capturing.” https://conservancy.umn.edu/handle/11299/173005.
Google Scholar
Kuznetsova, A., P.B. Brockhoff, and R.H.B. Christensen. 2017. “lmerTest Package: Tests in Linear Mixed Effects Models.” Journal of Statistical Software 82: 1–26. https://www.jstatsoft.org/article/view/v082i13.
Google Scholar
Nakagawa, S., and H. Schielzeth. 2013. “A General and Simple Method for Obtaining R2 from Generalized Linear Mixed‐effects Models.” Methods in Ecology and Evolution 4: 133–42.
Google Scholar
R Core Team. 2018. “R: A Language and Environment for Statistical Computing.” In The R Project for Statistical Computing. Vienna, Austria. https://www.R-project.org/.
Google Scholar
Raveau, S., A. Ghorpade, F. Zhao, M. Abou-Zeid, C. Zegras, and M. Ben-Akiva. 2016. “Smartphone-Based Survey for Real-Time and Retrospective Happiness Related to Travel and Activities.” Transportation Research Record: Journal of the Transportation Research Board 2566: 102–10.
Google Scholar
Zhu, J., and Y. Fan. 2018a. “Commute Happiness in Xi’an, China: Effects of Commute Mode, Duration, and Frequency.” Travel Behaviour and Society 11: 43–51.
Google Scholar
———. 2018b. “Daily Travel Behavior and Emotional Well-Being: Effects of Trip Mode, Duration, Purpose, and Companionship.” Transportation Research Part A: Policy and Practice 118: 360–73.
Google Scholar

Powered by Scholastica, the modern academic journal management system