Loading [Contrib]/a11y/accessibility-menu.js
Skip to main content
null
Findings
  • Menu
  • Articles
    • Energy Findings
    • Resilience Findings
    • Safety Findings
    • Transport Findings
    • Urban Findings
    • All
  • For Authors
  • Editorial Board
  • About
  • Blog
  • covid-19
  • search

RSS Feed

Enter the URL below into your favorite RSS reader.

https://findingspress.org/feed
Transport Findings
January 19, 2023 AEST

Changes in E-bike Awareness and Consideration for Commute

Aakansha Jain, Susan L. Handy,
e-bikecampuscommutesurvey
Copyright Logoccby-sa-4.0 • https://doi.org/10.32866/001c.67840
Findings
Jain, Aakansha, and Susan L. Handy. 2023. “Changes in E-Bike Awareness and Consideration for Commute.” Findings, January. https:/​/​doi.org/​10.32866/​001c.67840.
Save article as...▾
Download all (1)
  • Figure 1. Change in e-bike awareness and commute consideration
    Download

Sorry, something went wrong. Please try again.

If this problem reoccurs, please contact Scholastica Support

Error message:

undefined

View more stats

Abstract

This paper examines changes in e-bike awareness and consideration among commuters to the University of California, Davis campus using data from an annual travel survey. The analysis shows that awareness of e-bikes increased among commuters while consideration declined between 2019 and 2021. Awareness significantly increased among staff and undergraduate students and also increased among those who feel safe biking to campus. Consideration declined significantly among undergraduate students and commuters who bike to campus or use other modes.

1. Questions

E-bike sales have grown rapidly since the beginning of the COVID pandemic, as have media reports about this notable trend. We thus hypothesized that both awareness and consideration of e-bikes among commuters to the UC Davis campus in 2021 would be higher than the level measured in 2019 (Handy and Fitch 2022).

We answer the following questions:

  1. Has overall awareness and consideration for e-bikes increased?

  2. Does change in the level of awareness and consideration vary by demographic characteristics, commute mode, or transportation preferences?

2. Methods

We use data from the 2019 and 2021 UC Davis annual Campus Travel Survey (Jain and Miller 2022; Lee 2020). The city of Davis and the UC Davis campus have long been known for their culture of promoting bicycling as a primary mode of transportation. The presence of extensive bike infrastructure, compact urban form, and several environmental factors offer favorable circumstances for the proliferation of bicycling (Buehler and Handy 2008; Handy and Thigpen 2019). Close to 37 percent of UC Davis students and employees commute to campus by bike and this share increases to 45 percent among those who live in Davis (Jain and Miller 2022). The city and the university have been awarded the “Platinum” rating by The League of American Bicyclists (Murphy 2022; Wells 2021). The city provides a favorable setting for understanding whether a bike-friendly environment can also promote the uptake of new micro-mobility systems such as e-bikes which could further prove useful in reducing car dependence.

The survey is administered every year in October and November using the online Qualtrics platform. In 2019, the survey was distributed by email to a stratified random sample of 17, 094 UC Davis students, faculty, and staff. A total of 3,098 respondents completed the survey during that year. In 2021, it was distributed to 20,169 students, faculty, and staff out of which 4,265 complete responses were collected. In addition to collecting information about their daily travel behavior, the survey collected data on the attitudes and other demographics of the respondents. To capture the e-bike awareness levels among UC Davis commuters, respondents were asked this survey question: Do you know what an electric assist bicycle is? They are also known as “e-bikes.” For measuring e-bike consideration for commuting, respondents were asked this survey question: Have you ever thought about riding an e-bike to campus? Both of these questions were asked in the 2019 and 2021 surveys. So that the sample would be representative of the campus population, we weighted responses by gender, role group, and usual commute mode. We use descriptive and bivariate statistics to examine changes in the level of awareness and consideration. We also assess if the changes are statistically significant at the 95 percent confidence level.

3. Findings

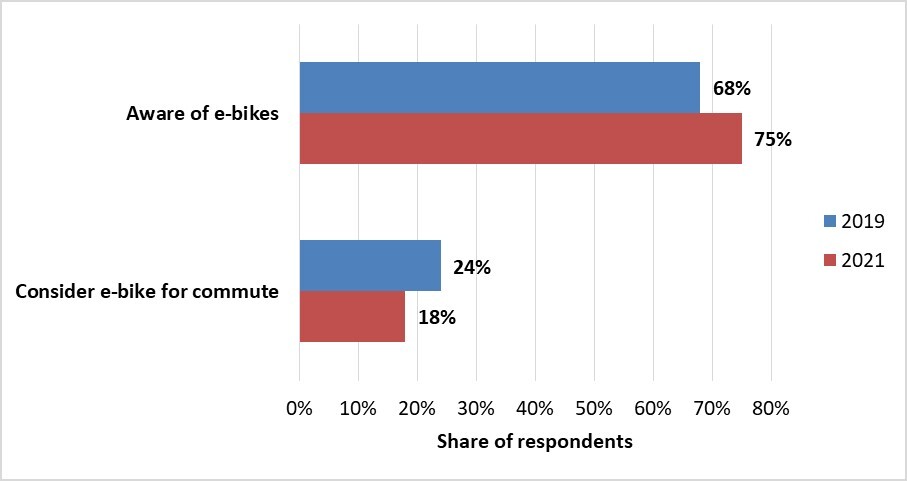
The survey results show that overall awareness of e-bikes increased among UC Davis commuters by 7 percentage points, from 68 percent in 2019 to 75 percent in 2021. On the other hand, consideration went down by 6 percentage points, from 24 percent in 2019 to 18 percent in 2021 (Figure 1).

Figure 1
Figure 1.Change in e-bike awareness and commute consideration

Awareness of e-bikes changed more for some groups than others (Table 1). Across role groups, awareness about e-bikes increased the most among staff members (+ 11.4 percentage points) followed by undergraduate students (+8 percentage points). While the share of women who said that they were aware of e-bikes was lower than the share of men in both years, awareness among women increased significantly and by more than men (10 percentage points versus 2.2 percentage points). Awareness of e-bikes increased more among commuters who drove to campus (+9.8 percentage points) than those who biked (+4.3 percentage points) (Table 2). Awareness increased significantly except among commuters who said they do not like driving and who feel concerned about the environment (Table 3). Across travel attitudes, awareness increased the most among commuters who said they do not feel concerned about the environment (+11.3 percentage points) and do not like riding bikes (+10.9 percentage points).

Table 1.Change in e-bike awareness and commute consideration by demographic variables
Aware of e-bikes Consider e-bike for commute
2019 n 2021 n change 2019 n 2021 n change
Overall sample 68.1% 2685 74.8% 3314 6.8%* 23.7% 2684 18.1% 3314 -5.6%*
Living in Davis 67.0% 1969 73.4% 2526 6.4%* 26.4% 1969 20.5% 2526 -6.0%*
Living Outside Davis 70.9% 715 79.3% 788 8.4%* 16.3% 713 10.5% 787 -5.8%*
Faculty 84.5% 118 86.9% 118 2.4% 21.9% 118 19.0% 118 -2.8%
Staff 75.6% 713 87.0% 632 11.4%* 20.2% 711 17.0% 632 -3.2%
Grad student, US-born 77.5% 247 80.4% 351 2.8% 24.0% 247 15.2% 351 -8.8%*
Grad student, foreign born 67.5% 110 71.6% 159 4.1% 33.5% 110 32.1% 159 -1.5%
Undergraduate student 61.7% 1497 69.7% 2052 8.0%* 24.8% 1497 17.8% 2052 -7.0%*
Women 61.8% 1573 71.8% 1937 10%* 18.4% 1572 14.2% 1936 -4.2%*
Men 76.9% 1112 79.1% 1376 2.2% 31.2% 1112 23.6% 1378 -7.7%*
Household has no children 67.8% 1647 75.3% 1881 7.5%* 24.8% 1646 17.7% 1883 -7.1%*
Household has children 77.0% 365 87.3% 325 10.3%* 20.1% 365 20.8% 325 0.7%

* Change in awareness and consideration significant at 0.05 level

Table 2.Change in e-bike awareness and commute consideration by usual mode of travel and bicycling confidence
Aware of e-bikes Consider e-bike for commute
2019 n 2021 n change 2019 n 2021 n change
Overall sample 68.1% 2685 74.8% 3314 6.8%* 23.7% 2684 18.1% 3314 -5.6%*
Usual commute mode
Bike to campus 74.8% 951 79.1% 1288 4.3%* 28.6% 951 22.9% 1286 -5.7%*
Drive to campus 67.4% 1002 77.2% 1214 9.8%* 18.0% 1001 15.1% 1213 -3.0%
Other modes 60.2% 731 64.4% 811 4.3% 25.2% 731 15.2% 814 -10.1%*
Bicycling confidence
Not very confident bicyclist 50.4% 299 57.1% 452 6.7% 11.1% 299 9.9% 451 -1.2%
Somewhat confident bicyclist 61.0% 618 70.2% 843 9.2%* 23.5% 617 18.0% 845 -5.5%*
Very confident bicyclist 75.2% 1690 80.8% 2016 5.6%* 26.5% 1690 20.0% 2015 -6.4%*

* Change in awareness and consideration significant at 0.05 level

Table 3.Change in e-bike awareness and commute consideration by attitudes
Aware of e-bikes Consider e-bike for commute
2019 n 2021 n change 2019 n 2021 n change
Overall sample 68.1% 2685 74.8% 3314 6.8%* 23.7% 2684 18.1% 3314 -5.6%*
Traveling to campus stresses me out Agree/strongly agree 64.1% 1055 72.7% 1367 8.6%* 23.1% 1053 17.0% 1370 -6.1%*
Disagree/⁠strongly disagree 72.3% 1171 78.0% 1336 5.7%* 23.7% 1171 18.2% 1334 -5.4%*
I feel safe biking on campus Agree/strongly agree 73.2% 1455 79.2% 1880 6.0%* 27.1% 1453 20.9% 1880 -6.2%*
Disagree/strongly disagree 62.2% 546 69.6% 530 7.3%* 21.3% 546 15.2% 530 -6.1%*
Travel time is generally wasted time Agree/strongly agree 67.6% 1323 72.1% 1594 4.5%* 24.1% 1321 17.1% 1596 -6.9%*
Disagree/strongly disagree 71.0% 848 78.5% 1066 7.6%* 23.9% 848 19.4% 1064 -4.5%*
I like driving Agree/strongly agree 70.1% 1332 76.9% 1724 6.7%* 24.5% 1332 19.5% 1727 -5.0%*
Disagree/strongly disagree 71.2% 649 73.3% 778 2.1% 24.6% 647 14.2% 778 -10.4%*
I like riding a bike Agree/strongly agree 74.6% 1656 80.2% 1988 5.6%* 27.4% 1654 20.4% 1989 -7.0%*
Disagree/strongly disagree 54.2% 482 65.1% 678 10.9%* 15.8% 482 13.4% 678 -2.4%
I need to dress professionally for my job Agree/strongly agree 71.7% 976 76.4% 1004 4.7%* 26.7% 975 18.9% 1002 -7.8%*
Disagree/strongly disagree 69.2% 931 77.8% 1262 8.6%* 21.4% 931 17.1% 1262 -4.3%*
Environmental concerns affect the choices I make about my daily travel Agree/strongly agree 73.6% 1207 75.7% 1563 2.1% 28.3% 1206 21.9% 1561 -6.5%*
Disagree/strongly disagree 63.3% 716 74.6% 833 11.3%* 17.0% 716 13.8% 833 -3.2%

* Change in awareness and consideration significant at 0.05 level

Consideration of commuting by e-bikes changed significantly across several demographic variables (Table 1). Across role groups, consideration declined the most among US-born graduate students (-8.8 percentage points) and undergraduate students (-7 percentage points). A higher proportion of men considered commuting by e-bikes than women in both years, but consideration decreased more for men (-7.7 percentage points) than women (-4.2 percentage points). Unlike other groups, consideration increased among households with children, though the increase was not significant. Consideration decreased the most among “other mode” users (-10.1 percentage points) (Table 2). Consideration decreased significantly except among commuters who said they do not like riding a bike and those who are not concerned about the environment (Table 3). Across travel attitudes, consideration decreased the most for commuters who said they do not like driving (-10.4 percentage points) and who need to dress professionally for work (-7.8 percentage points).

The suspension of JUMP bike share system in Davis during COVID pandemic could be one explanation for the decline in consideration of e-bikes. JUMP bikes provided an opportunity for people to learn more about e-bikes and had the potential to increase consideration among people of using them for commute purposes (Handy and Fitch 2022). Another possible reason for the decline in consideration of commuting by e-bikes could be remote working as commuters might not see the need for using an e-bike if they are not commuting to campus frequently. Data from future surveys could be used to assess if the decline in consideration is primarily related to remote working or due to other factors. A better understanding of attitudes could be especially helpful in assessing the potential of e-bikes as a commute mode.


ACKNOWLEDGMENTS

Thanks to Amy E. Lee and Ryan G. Miller for their work on the 2019-20 and 2021-22 Campus Travel Survey, respectively. The annual survey is funded by the Transportation Services at UC Davis and the National Center for Sustainable Transportation.

Submitted: December 01, 2022 AEST

Accepted: January 07, 2023 AEST

References

Buehler, Ted, and Susan Handy. 2008. “Fifty Years of Bicycle Policy in Davis, California.” Transportation Research Record: Journal of the Transportation Research Board 2074 (1): 52–57. https:/​/​doi.org/​10.3141/​2074-07.
Google Scholar
Handy, Susan L., and Dillon T. Fitch. 2022. “Can an E-Bike Share System Increase Awareness and Consideration of e-Bikes as a Commute Mode? Results from a Natural Experiment.” International Journal of Sustainable Transportation 16 (1): 34–44. https:/​/​doi.org/​10.1080/​15568318.2020.1847370.
Google Scholar
Handy, Susan L., and Calvin Thigpen. 2019. “Commute Quality and Its Implications for Commute Satisfaction: Exploring the Role of Mode, Location, and Other Factors.” Travel Behaviour and Society 16:241–48. https:/​/​doi.org/​10.1016/​j.tbs.2018.03.001.
Google Scholar
Jain, Aakansha, and Ryan G. Miller. 2022. “Results of the 2021-22 Campus Travel Survey.” https:/​/​escholarship.org/​uc/​item/​7x7826v8.
Lee, Amy. 2020. “Results of the 2019-20 Campus Travel Survey.” https:/​/​escholarship.org/​uc/​item/​9929r4j1.
Murphy, Liz. 2022. “Universities.” League of American Bicyclists. https:/​/​www.bikeleague.org/​university.
Wells, Raven. 2021. “55 Communities Transforming Bicycling This Fall.” League of American Bicyclists. https:/​/​bikeleague.org/​content/​55-communities-transforming-bicycling-fall.

This website uses cookies

We use cookies to enhance your experience and support COUNTER Metrics for transparent reporting of readership statistics. Cookie data is not sold to third parties or used for marketing purposes.

Powered by Scholastica, the modern academic journal management system