

1. Questions
Transit users’ access to one-seat rides – direct service where riders do not need to conduct transfers – to and from their destination is a key concern in transportation planning, particularly in light of recent transit programs meant to increase efficiency of service (Brown and Thompson 2009). While transit providers have developed ways to highlight routes that, considering the existing transit network, best provide one-seat service, less is known about the areas where one-seat service best matches existing commutes, and conversely where such service is lacking. This lack of knowledge is especially pronounced for populations traditionally underserved by existing transit infrastructure, such as reverse commuters (Cervero 2004).
In this paper, we advance the framework of a spatial coverage ratio for transit (Cha and Murray 2020; Murray 2001; Murray et al. 1998) to describe generalized access to one seat service while accounting for the localized presence of realized reverse commutes – commutes from an urban home/origin to a suburban workplace/destination – as described by administrative origin and destination (O-D) data (Davidson, Feiglin, and Ryerson 2021). In doing so, we indicate areas with a paucity of one-seat service as compared to demand and highlight areas for future intervention. We ask:
-
What is the one-seat, reverse commute transit coverage ratio per census tract when accounting for observed commuting patterns?
-
How can this coverage ratio help to craft a ranking of service to inform future planning?
To illustrate this new coverage ratio and ranking approach, we build on previous work and look specifically at the case study of the reverse commuting population in Philadelphia (Davidson, Feiglin, and Ryerson 2021; Davidson and Ryerson 2018). This analysis of reverse commutes is one application of the proposed method that can be adjusted to different commute patterns and locations.
2. Methods
We first identify reverse commute O-D pairs in Philadelphia that travel only within Pennsylvania counties of the Philadelphia metropolitan statistical area, using US Census Longitudinal Employer Household Dynamics (LEHD) data based on criteria described in previous work (Davidson, Feiglin, and Ryerson 2021; Davidson and Ryerson 2018). The analytic dataset contains 68,068 unique, reverse commute O-D observations when measured at the census tract level. LEHD data are provided at the census block level; however, block level estimates are suppressed when fewer than five observations are present (Lane et al. 2003). We therefore aggregate observations to the tract level to ensure representation across the study area, an approach that mirrors other public transit research (Dong 2022). O-D data are enriched with the spatial definition of the bus network from the Southeastern Pennsylvania Transportation Authority (SEPTA) that serves the metropolitan Philadelphia area.
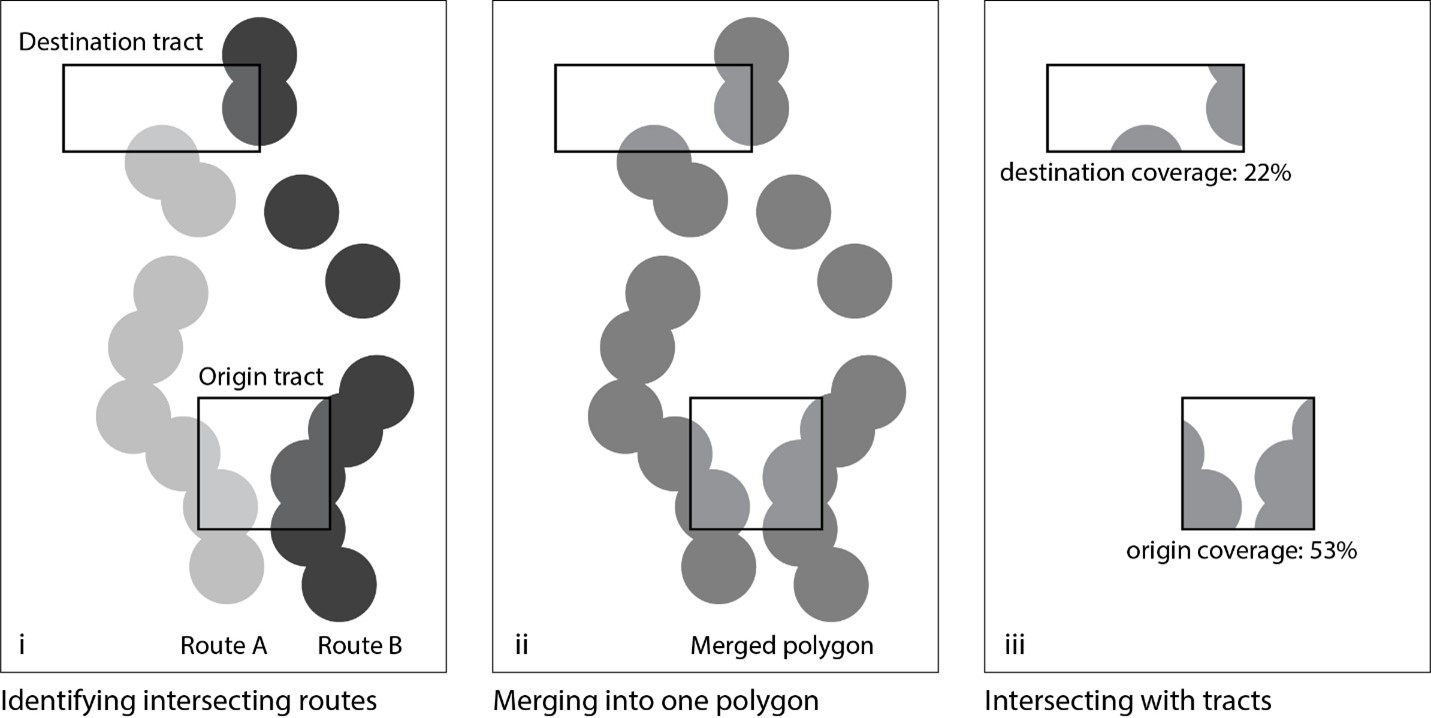
The one-seat coverage index, CoverageSpatial, is defined for each O-D pair based on the spatial intersection of buffers around SEPTA bus stations and routes with the census tracts that constitute the O-D pair as follows:
- All SEPTA bus stops are buffered at 500 meters, a rough approximation of reasonable walking distance (Guerra, Cervero, and Tischler 2012).
- All stop buffers are then aggregated to their respective bus route(s) (see Figure 1i).
- For each O-D pair, route polygons that intersect both origin and destination tracts are identified (see Figure 1i).
- Any routes that intersect both origin and destination tracts are merged into one polygon, reflecting the choice set of one-seat service for that O-D pair (see Figure 1ii).
- The final one-seat choice set polygon is intersected with the origin and destination tracts, reflecting the one-seat coverage area of both tracts (see Figure1iii).
- For each O-D pair, the percent of both the origin and destination tracts that is constituted by the one-seat coverage area is calculated (see Figure 1iii).

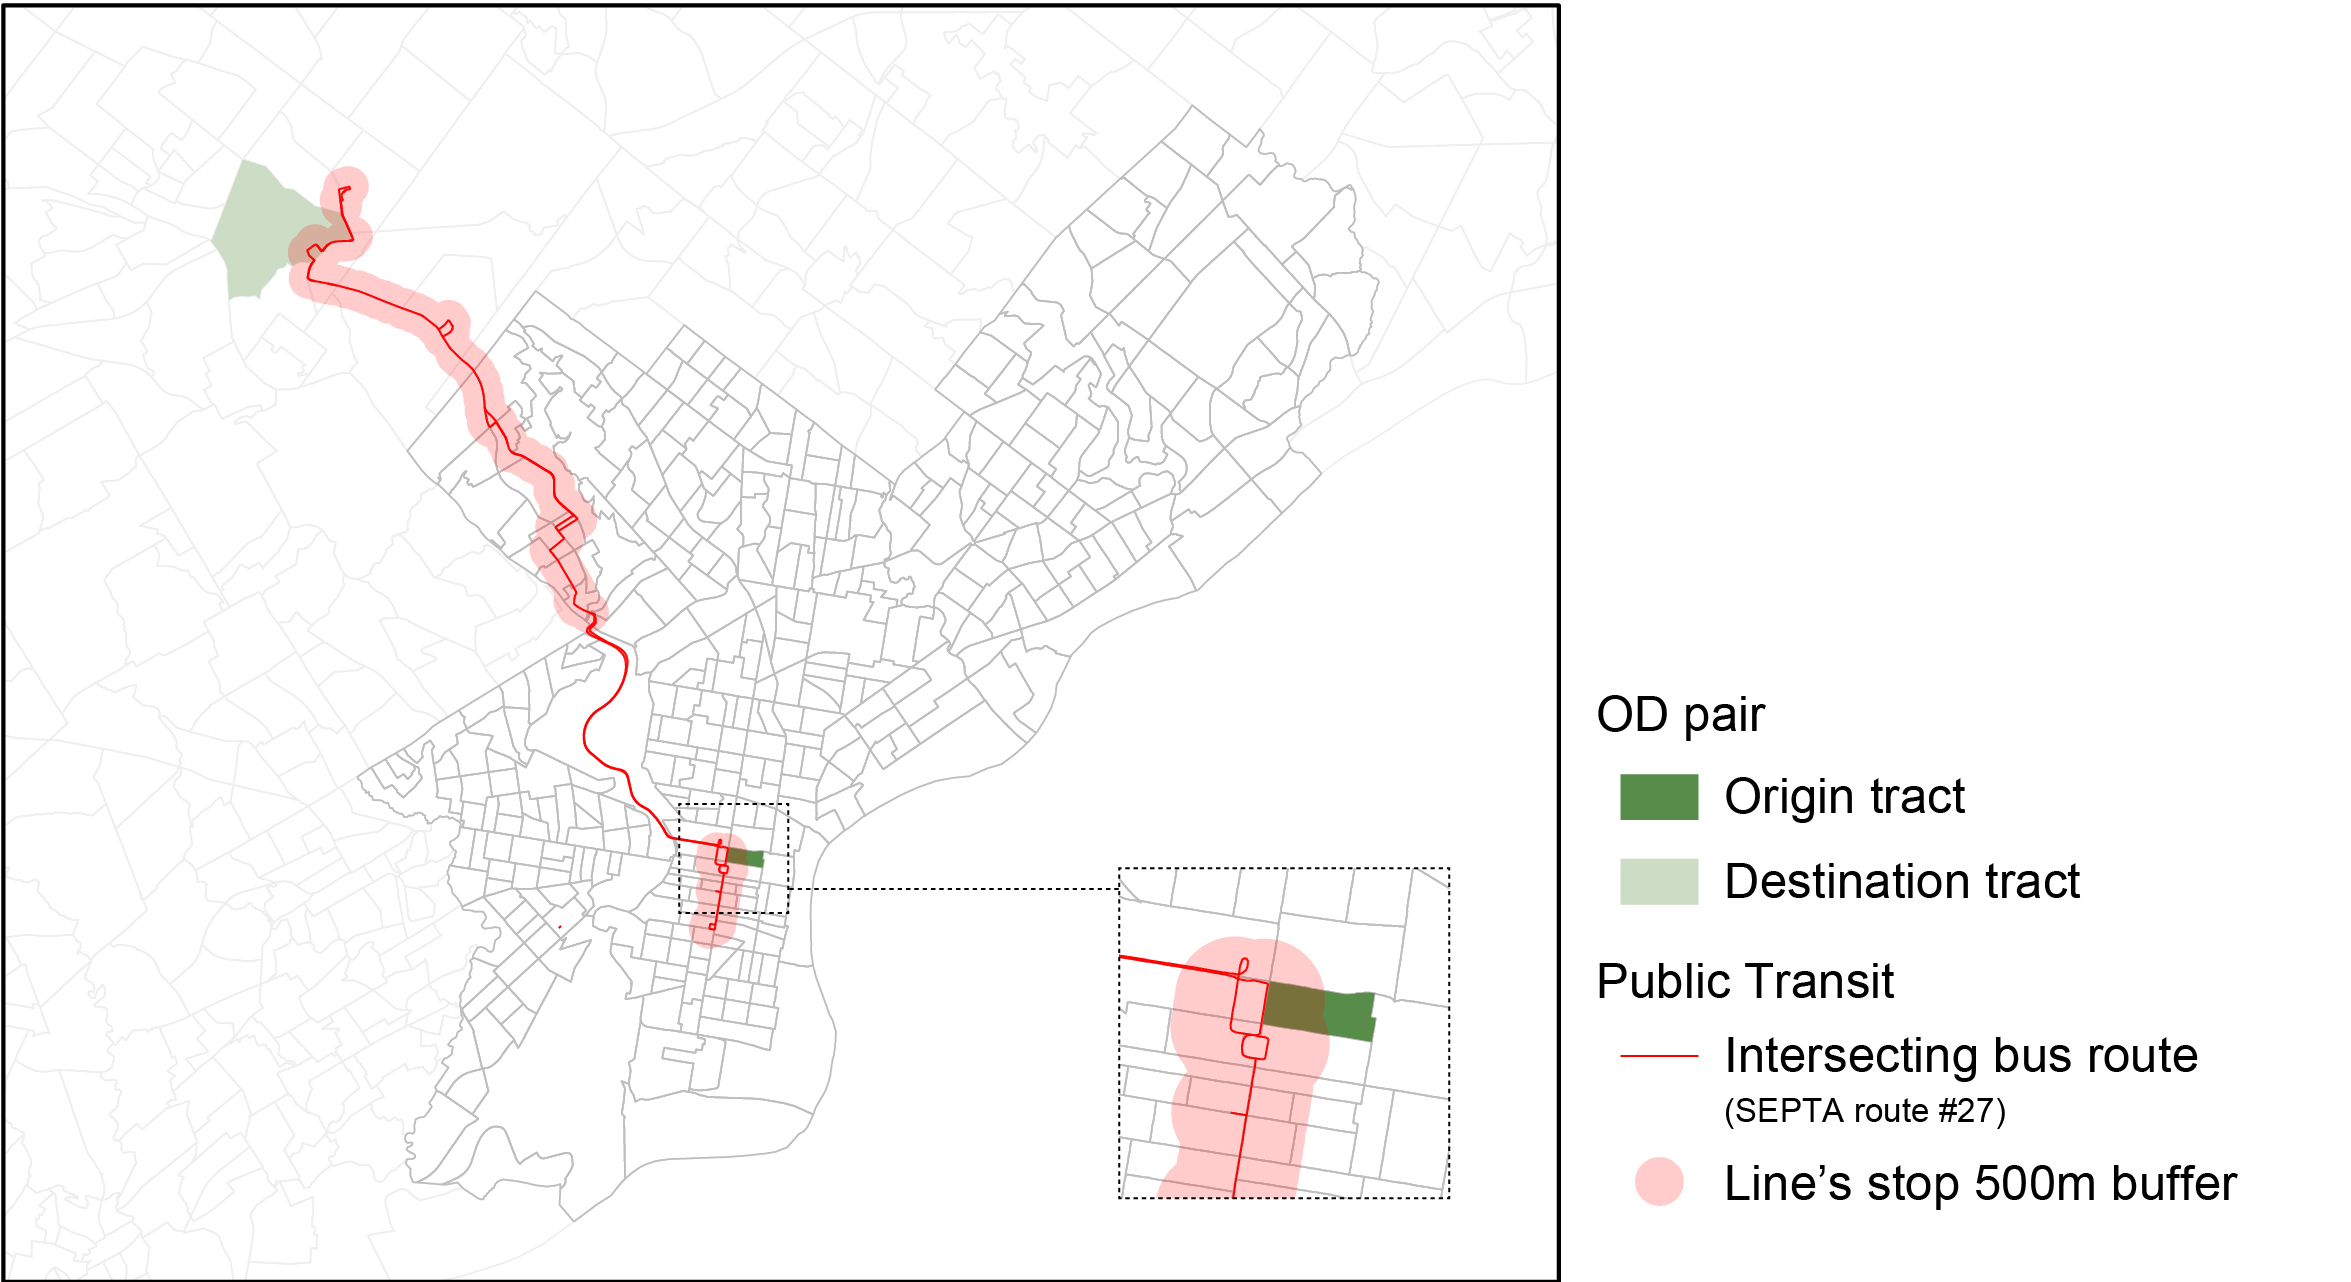
A geographic illustration of CoverageSpatial using a simplified example of one origin tract in Philadelphia’s downtown, one destination tract in the Northwest suburbs, and one bus route that connects them, is provided in Figure 2.
We then develop an aggregate score, CoverageScore, for each census tract in the data that accounts for the level of CoverageSpatial and the preponderance of jobs nested in all the O-D pairs that start or end in that tract – a measure of observed commuter flows. CoverageScore can thus be used to inform priority areas for transit intervention as the metric accounts for both existing one-seat service and observed commutes.
Let i and j reflect either origin and destination tracts, such that i ≠ j:
JobsWeighted(i)j=JobsNested(i)j∗CoverageSpatial(i)j
where JobsNested reflects the number of jobs held by individuals who commute from tract i to tract j and JobsWeighted is a measure of these jobs that could be hypothetically served by one-seat services, as reflected by CoverageSpatial. All data reflect reverse commuters, thus the set of census tracts that define origins is exclusive of the set that define destinations.
Jobsweighted is then aggregated to origin and destination tracts as follows:
CoverageScorei=∑(jJobsWeighted(i)j∑(jJobsNested(i)j
where CoverageScore is a continuous variable ranging from 0 to 1, such that lower values describe origin or destination tracts that feature limited one-seat coverage for existing commuter flows, and higher values describe tracts that feature high levels of jobs served by one-seat coverage. Recall, the denominator in CoverageScore reflect only reverse commute jobs.
3. Findings
The distribution of CoverageScore is described in Table 1. There is substantial variation in these values, though it is equally important to note that, especially on the destination side, there are many tracts that feature no coverage at all. No origin or destination tracts feature values of CoverageScore greater than 37%, meaning that only limited reverse commutes are reasonably served by one seat service. Furthermore, the distribution of high CoverageScore values are clustered in space, at the origin in downtown districts that feature high transit service or in outlying tracts of Philadelphia that benefit from proximity to suburban destinations (see Figure 3). At the destination, only the most inner ring suburban tracts that border the city boundary see high values of CoverageScore. Many tracts, particularly at the destination, feature a substantive mismatch between existing service and observed commuter flows, as indicated by above average levels of reverse commuting workers, but also low values CoverageScore (see Figure 3).

It is unreasonable to expect SEPTA or similar transit operators to provide a high one-seat-ride coverage ratios for all tracts, within and outside the city. However, targeting tracts with above-average jobs and low one-seat coverage could benefit users greatly. For example, by using administrative data, as we do here, transit providers can modulate desired thresholds for one-seat coverage and expand applications to users beyond the reverse commuting population. In doing so, operators can develop new priority areas for intervention and line adaptation.