Loading [Contrib]/a11y/accessibility-menu.js
Skip to main content
null
Findings
  • Menu
  • Articles
    • Energy Findings
    • Resilience Findings
    • Safety Findings
    • Transport Findings
    • Urban Findings
    • All
  • For Authors
  • Editorial Board
  • About
  • Blog
  • covid-19
  • search

RSS Feed

Enter the URL below into your favorite RSS reader.

http://localhost:52307/feed
Transport Findings
January 07, 2023 AEST

Predictors of Early Adoption of the General Transit Feed Specification

Carole Turley Voulgaris, Charuvi Begwani,
Technology adoptionTransitOpen dataStandardsInnovation diffusionGTFS
Copyright Logoccby-sa-4.0 • https://doi.org/10.32866/001c.57722
Findings
Voulgaris, Carole Turley, and Charuvi Begwani. 2023. “Predictors of Early Adoption of the General Transit Feed Specification.” Findings, January. https:/​/​doi.org/​10.32866/​001c.57722.
Save article as...▾
Download all (3)
  • Figure 1. Correlations among continuous independent variables
    Download
  • Figure 2. Market penetration of General Transit Feed Specification over time
    Download
  • Figure 3. Modeled relationships between probability of GTFS adoption and significant predictors
    Download

Sorry, something went wrong. Please try again.

If this problem reoccurs, please contact Scholastica Support

Error message:

undefined

View more stats

Abstract

The use of the general transit feed specification (GTFS) data standard has spread rapidly since its introduction in 2007, although it is still not universal in the United States. To explain which transit agencies are likely to have been early adopters of GTFS, we estimate a logistic regression model predicting GTFS adoption based on service area and agency characteristics. We find that agencies with higher ridership and those providing lower shares of a region’s total vehicle revenue kilometers have tended to adopt GTFS earlier.

1. Questions

In late 2005, the Tri-County Metropolitan Transportation District of Oregon (TriMet) partnered with Google to develop a data standard for incorporating transit route and schedule information into third-party navigation applications (McHugh 2013). Two years later, this data standard was published as Google Transit Feed Specification (GTFS) (and retained the acronym when it was subsequently renamed as General Transit Feed Specification). GTFS has transformed the way travelers plan trips, and its success has relied on the willingness of transit operators to adopt it.

What might explain a transit agency’s decision to adopt the GTFS standard earlier? Frick, Kumar, and Post (2020) have found that small transit agencies (those with reduced reporting requirements from the Federal Transit Administration) and rural transit agencies were less likely to have published GTFS feeds and that independent public transit authorities are more likely than other organization types (such as transit agencies that are organized within local government units) to publish real-time vehicle locations in the more-recent GTFS-realtime data format. This may suggest that independent authorities are more open to early technology adoption.

If transit agency characteristics are associated with earlier technology adoption, findings by Iseki at al. (2007) on early adoption of smart card fare collection may be informative. They found that early adopters tended to be those with greater funding availability and those with established relationships with other transit agencies. Rogers’ (2003) review of four decades of innovation diffusion literature highlights several characteristics of organizations that correlate with being early adopters of new technologies, including larger size, social interconnectedness, and organizational slack (i.e. additional resources beyond what is required to deliver a firm’s core product).

Based on the above background, we developed a set of hypothesized relationships with the likelihood that a transit agency will have been an early adopter of the GTFS data standard. These are listed in Table 1.

Table 1.Hypotheses and sources for variables included in regression analysis
Variable Hypothesized relationship Source
Service area (urbanized area) characteristics
Population Positive coefficient: Agencies serving larger populations will adopt earlier because they have more potential riders. United States Census Bureau via tidycensus
Number of transit agencies Positive coefficient: Agencies in areas with more transit agencies will adopt earlier because they are more closely networked with peer agencies (Rogers 2003). NTD
Percent renter households Positive coefficient: Agencies in areas with more renters will adopt earlier because they serve a higher turnover population and more riders who are unfamiliar with their systems. United States Census Bureau via tidycensus
Agency characteristics
Annual vehicle revenue distance Positive coefficient: Agencies with more vehicle revenue distance will adopt earlier because they are larger (Rogers 2003). NTD
Annual ridership Positive coefficient: Agencies with higher ridership will adopt earlier because they have more customers who would benefit from it. NTD
Organization type Positive coefficient for independent agencies: Independent agencies and authorities will adopt earlier (Frick, Kumar, and Post 2020) NTD
Overhead Positive coefficient: Agencies with a greater share of operating costs allocated to general administration will adopt earlier because they have greater organizational slack (Rogers 2003). Calculated from NTD as total salary and fringe benefits for general administration divided by total operation expenses.
Farebox recovery Positive coefficient: Agencies with a greater reliance on farebox revenue for their operating expenses will adopt earlier because of potential gains from increased ridership. Calculated from NTD as fare revenue divided by operating expenses
Local vehicle revenue distance share Negative coefficient: Agencies that offer a lower share of the total service in their area have a greater need to coordinate with other agencies and will have stronger interagency relationships (Rogers 2003). Calculated from NTD as annual vehicle revenue distance divided by total annual vehicle revenue distance for all agencies in the urbanized area
Context characteristics
Years since publication of GTFS standard Positive coefficient: Agencies will have had time to learn about GTFS, and cost-saving software tools for generating and testing GTFS feeds will have been developed. Calculated for each year.
GTFS market penetration Positive coefficient: Agencies will have observed lessons learned from prior adopters. Calculated from adoption dates.

Source notes: NTD = National Transit Database (Federal Transit Administration 2007–2010)
tidycensus (Walker and Herman 2022)

2. Methods

We identified 471 transit agencies from the National Transit Database that carried passengers on scheduled service in 2007 (shortly after the GTFS standard was published in September 2006). For each agency, we identified the earliest GTFS feed available from any of three online archives: GTFS Data Exchange (Czebotar 2016), OpenMobilityData (Mobility Data IO 2021), and Transitland (Interline Technologies 2022). We used the earliest date in the earliest publicly available feed as each transit agency’s date of GTFS adoption.[1]

We structured the dataset so that each observation represents a specific agency in a specific year. We compiled a set of variables (listed with their sources in Table 1) for each agency for each year from 2007 to the earlier of (1) 2020 or (2) the year in which the agency adopted the GTFS data standard. Each agency only appears in the dataset for years in which it could have adopted the standard, and not in years when it had already adopted it.

The resulting dataset included 3,514 observations for 471 agencies. Table 2 summarizes the variables of interest for 2007 (the year for which all 471 agencies are included in the analysis).

Table 2.Summary of 2007 values for independent variables
Variable Average Median Standard deviation
Population 2,368,384 310,945 4,677,966
Annual ridership 18,041,465 1,481,472 135,115,710
Annual vehicle revenue kilometers 6,731,636 1,718,909 18,331,415
Number of transit agencies 5.5     1.0     9.1    
Percent renter households 39.0% 38.3% 7.7%
Overhead 7.7% 7.3% 4.5%
Farebox recovery 22.0% 16.5% 19.0%
Local vehicle revenue distance share 66.2% 100.0% 42.3%
Local government unit Independent agency or authority Other
Organization type 211 (45%) 198 (42%) 62 (13%)

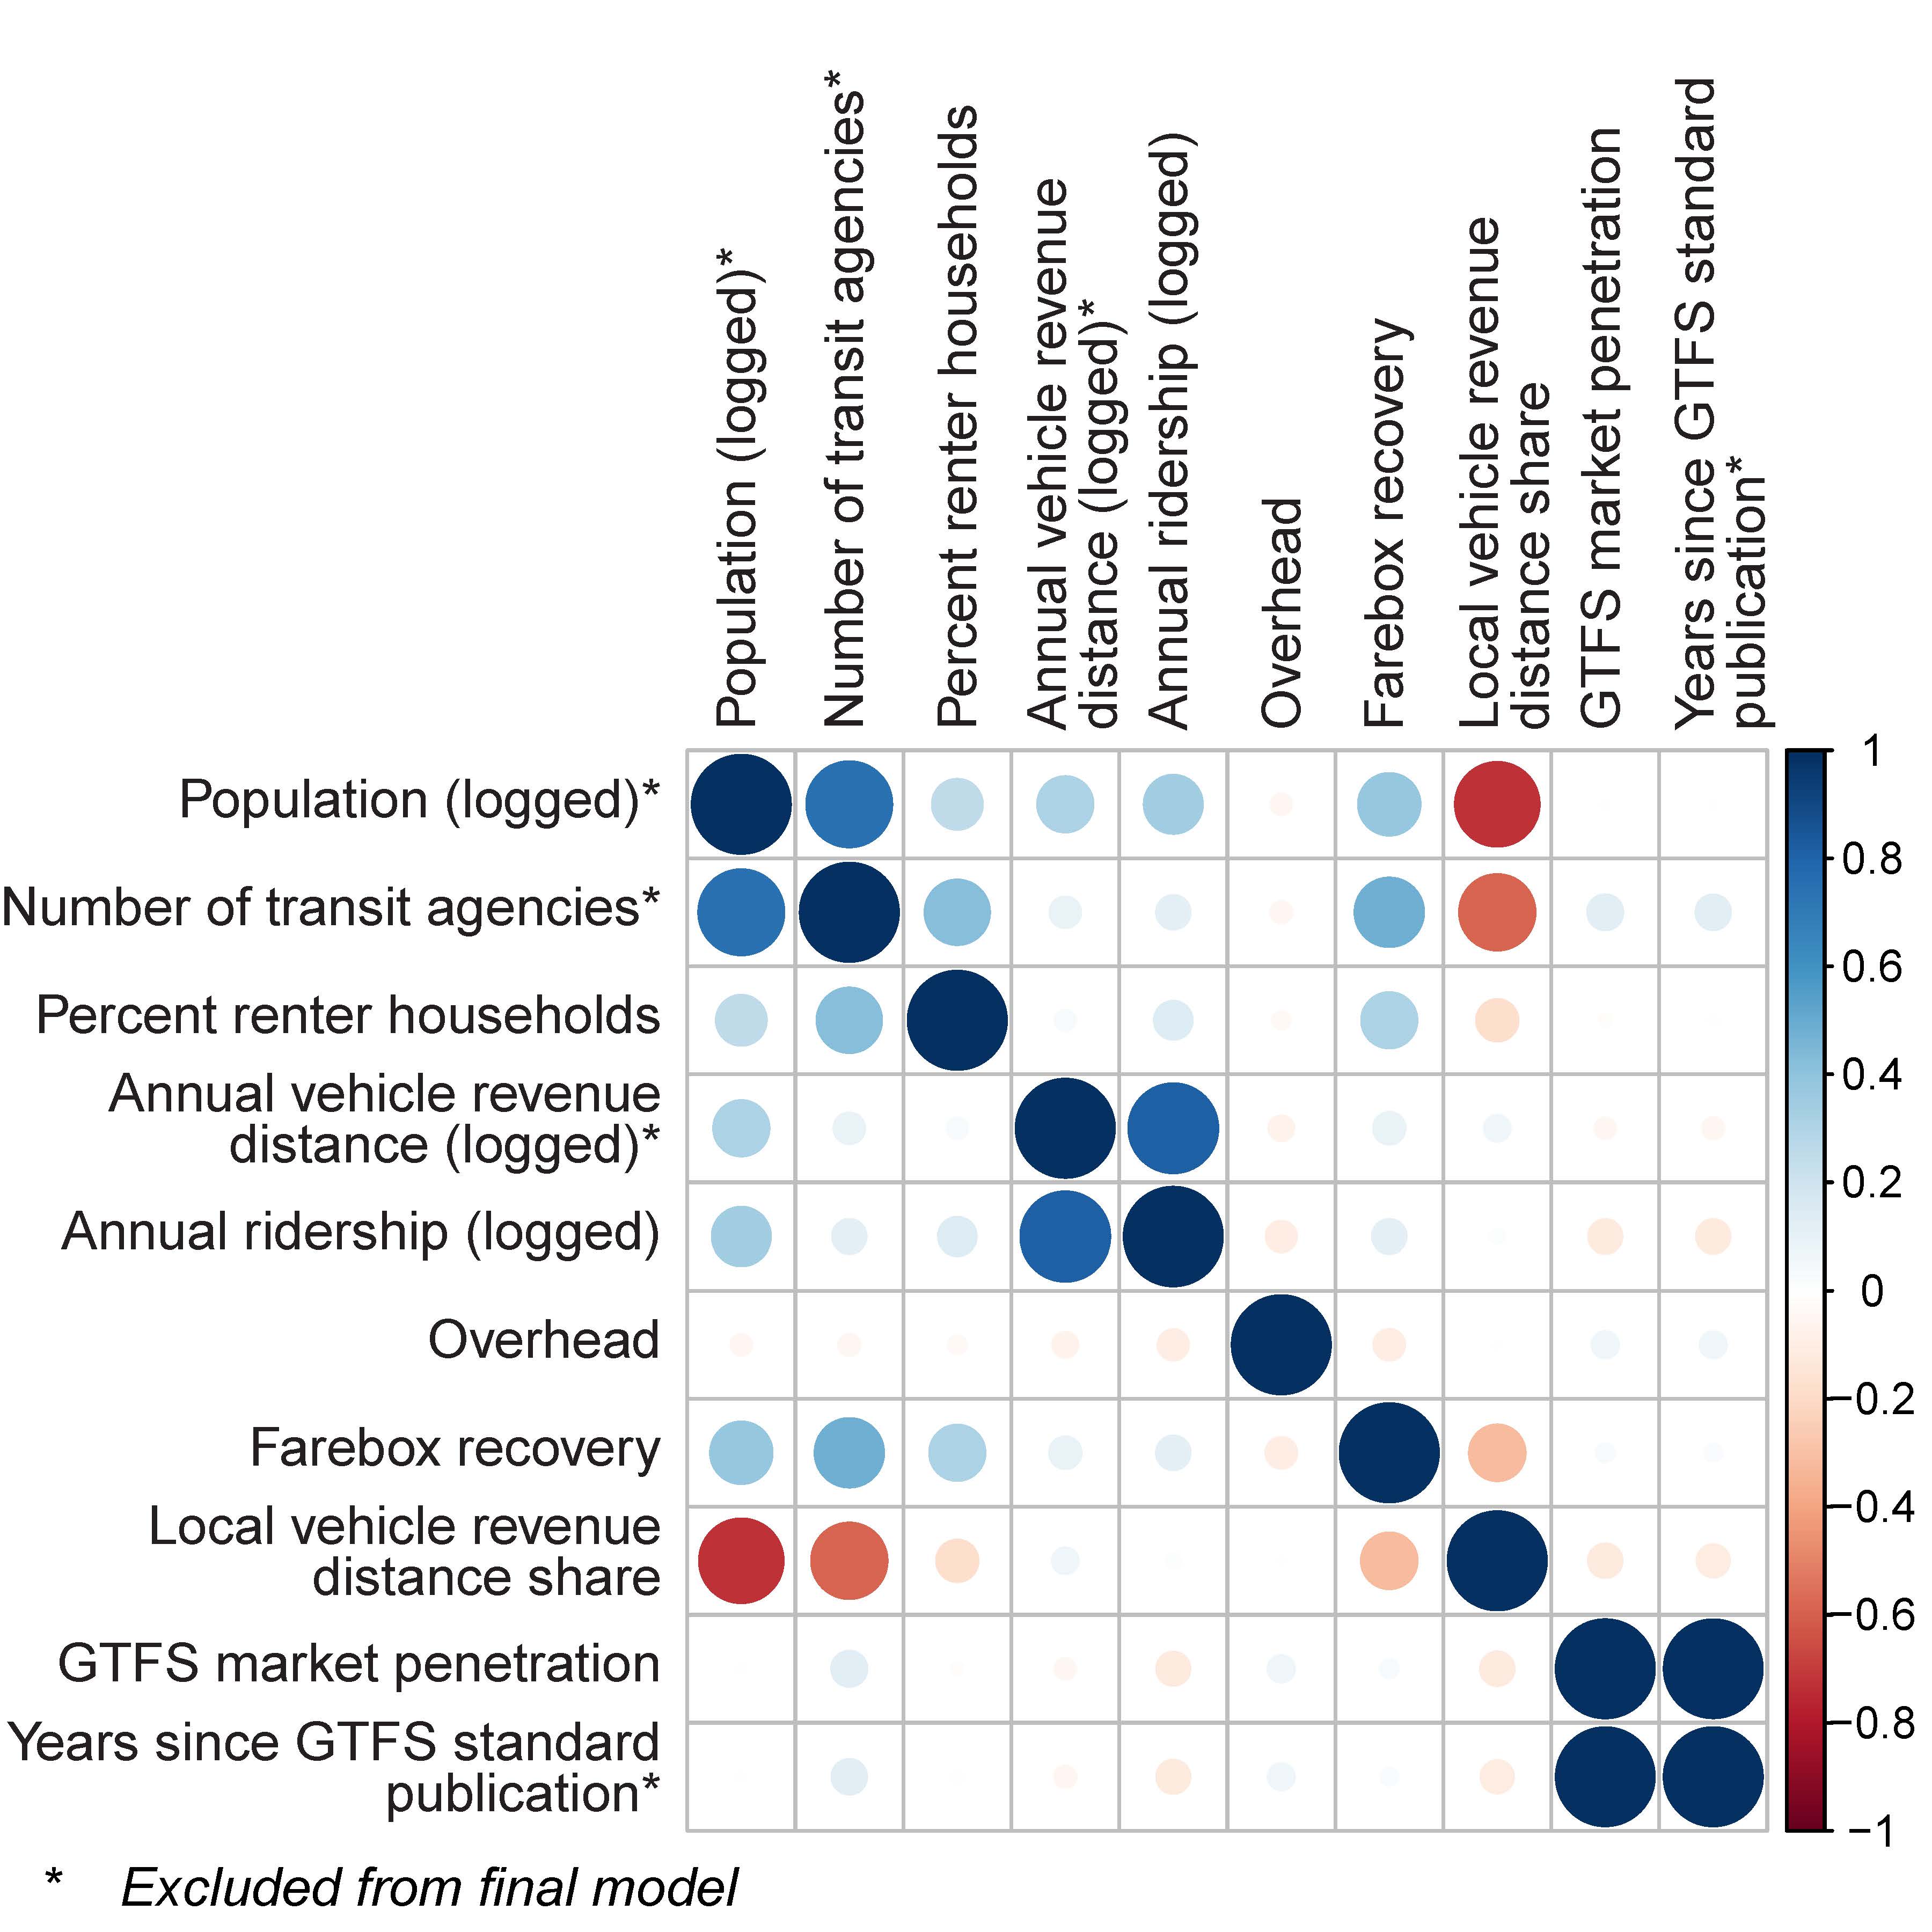
Figure 1 illustrates the correlations among all pairs of continuous independent variables. GTFS market penetration is almost perfectly correlated with the number of years since the publication of the standard. Service area population is highly correlated with the number of transit agencies in a region (r = 0.75) and with the share of a region’s total transit service an agency represents (r = -0.72). The number of transit agencies in a region is also highly correlated with the share of a region’s total transit service an agency represents (r = -0.59).

Figure 1
Figure 1.Correlations among continuous independent variables

We estimated three logistic regression models predicting the likelihood that an agency adopted the GTFS data standard in a given year, with standard errors clustered by agency. We estimated a null model with no predictors as a basis for comparison with the model fit statistics of the other two models, a full model including all variables listed in Table 1, and a final model that reduces multicollinearity by excluding population, number of transit agencies within a region, annual vehicle revenue distance, and years since GTFS publication.

3. Findings

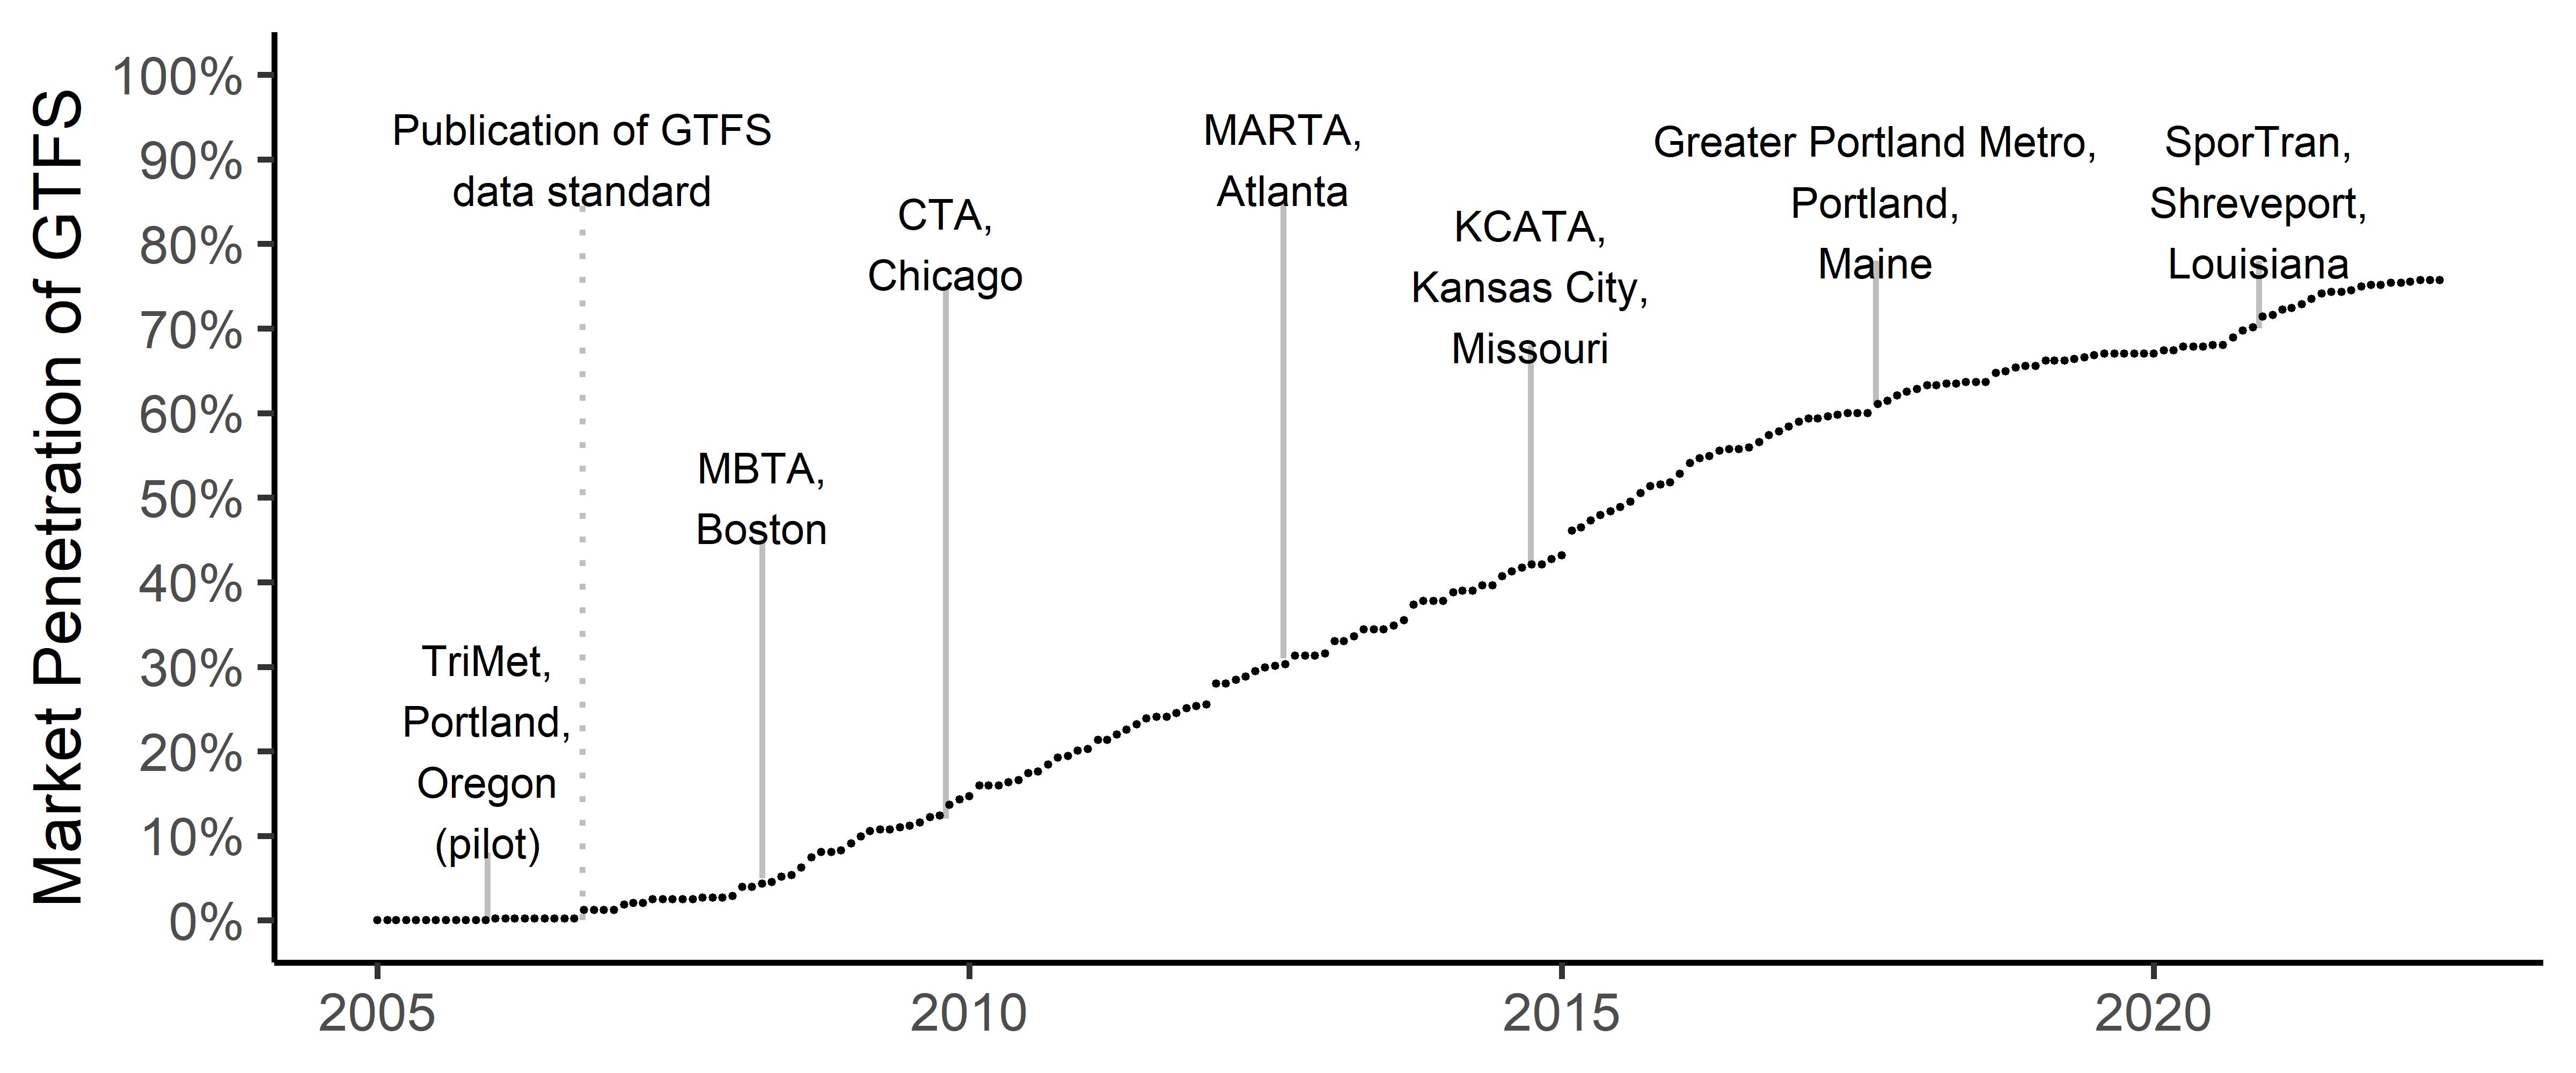
Figure 2 shows the increase in the market penetration of GTFS in the United States from January 2005 to June 2022. GTFS’s market penetration was zero until TriMet began using a version of GTFS in 2005. Five additional agencies piloted the standard and adopted it simultaneously with its publication in September 2006 (McHugh 2013). These initial six agencies are not included in our regression analysis, which only includes agencies that had not yet adopted GTFS when it was initially published publicly. After its publication in September 2006, the first agency to adopt GTFS was the San Francisco Bay Area Rapid Transit District (BART) in January 2007. By June 2022, just over 75 percent of transit agencies with scheduled transit service had adopted GTFS.

Figure 2
Figure 2.Market penetration of General Transit Feed Specification over time

Table 3 shows the results of all three logistic regression models. All continuous variables are mean-centered and scaled to have a standard deviation of one. Coefficient estimates represent the predicted change in the log-odds of adoption associated with a one-standard-deviation difference in the predictor variable.

Table 3.Logistic regression results
Null Model Full Model Final Model
Akaike Information Criterion (AIC) 2131.66 1911.21 1921.86
Bayesian Information Criterion (BIC) 2137.82 1991.35 1977.34
Pseudo R2 0.00 0.15 0.14
Estimate p-⁠value Estimate p-⁠value Estimate p-⁠value
Intercept -2.31 < 0.01* -2.74 < 0.01* -2.74 < 0.01*
Service area (urbanized area) characteristics
Population (log-transformed) -0.21 0.19
Number of transit agencies -0.06 0.61
Percent renter households 0.18 0.02* 0.12 0.10
Agency characteristics
Service provided and service consumed
Annual vehicle revenue kilometers (log transformed) 0.41 0.01*
Annual ridership (log transformed) 0.48 < 0.01* 0.73 < 0.01*
Agency type (relative to local government)
Independent agency or authority 0.18 0.29 0.31 0.08
Other -0.29 0.52 -0.29 0.48
Financial characteristics
Overhead -0.11 0.25 -0.12 0.19
Farebox recovery -0.20 0.14 -0.21 0.09
Interagency relationships
Local vehicle revenue distance share -0.36 < 0.01* -0.20 < 0.01*
Time and market penetration
Years since GTFS introduction -0.85 0.26
GTFS United States market penetration 1.47 0.06 0.63 < 0.01*

NOTES:
* Indicates variables are significant at a 95% confidence level.
All continuous variables are mean-centered and scaled to have a standard deviation of one.

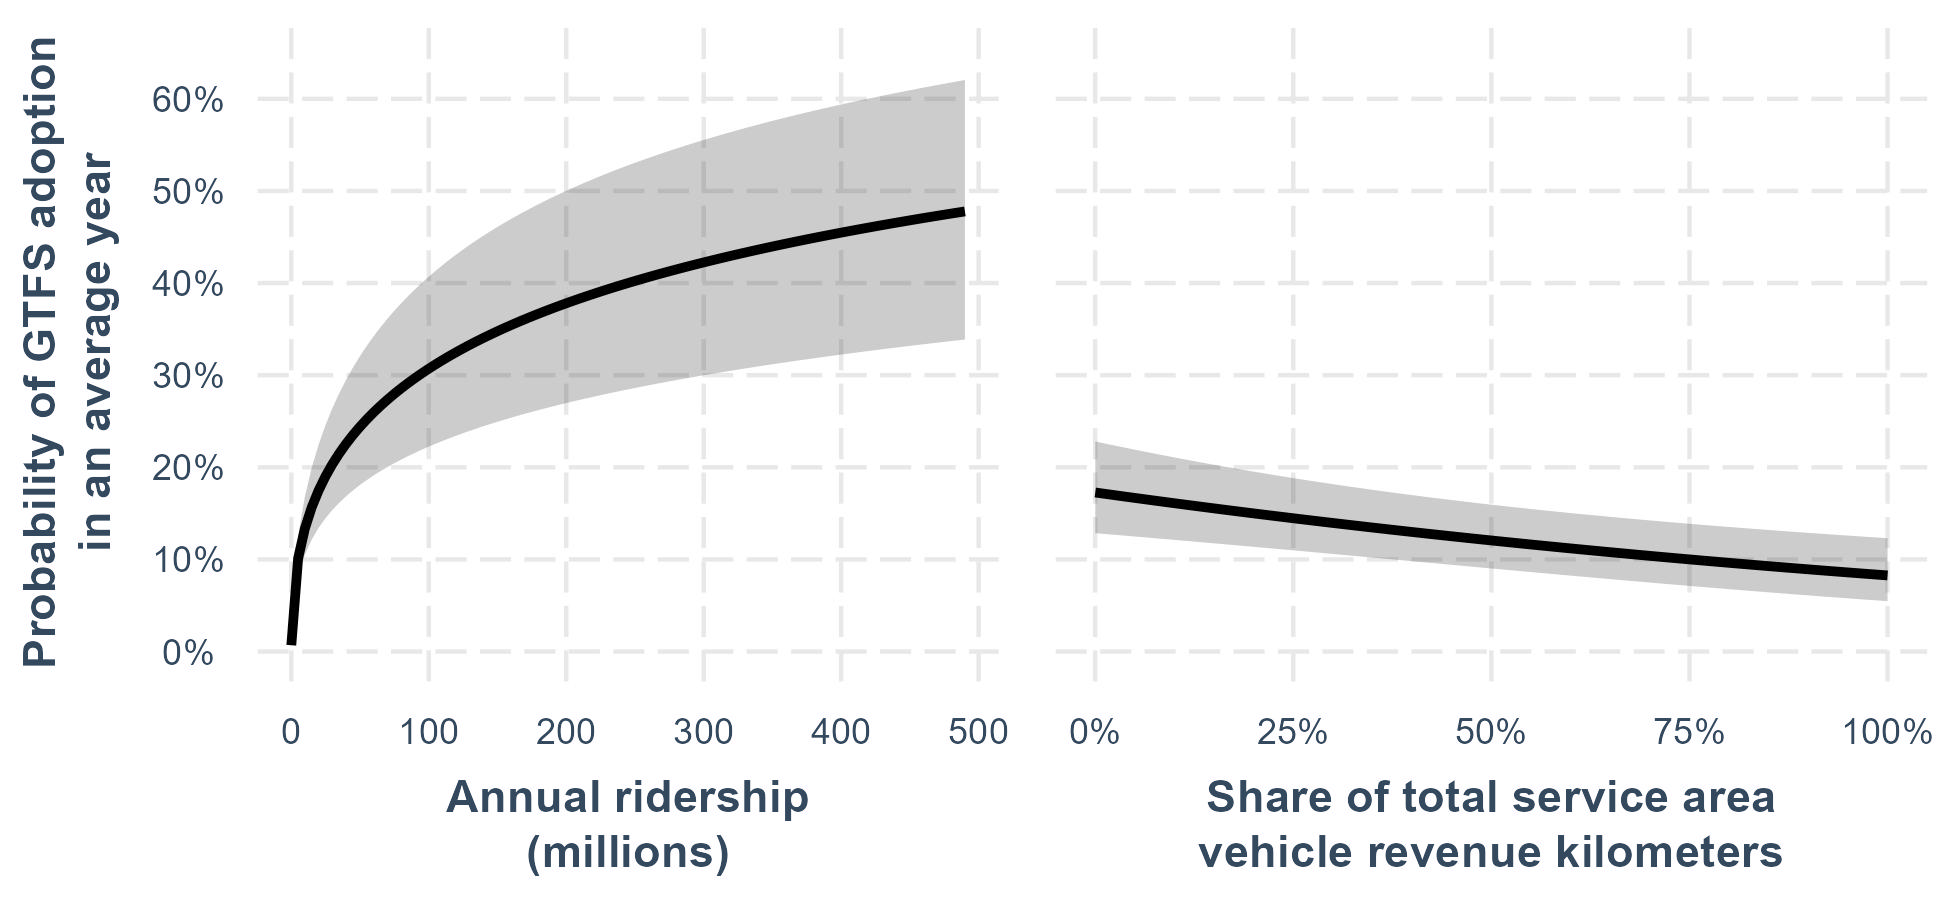
The final model fits the data approximately as well as the full model, but is more interpretable with the removal of highly correlated variables. The final model predicts that an agency will have adopted GTFS sooner if it serves more passenger trips and provides a smaller share of the total vehicle revenue distance in its service area. Figure 3 illustrates how the predicted probability of GTFS adoption in a given year would vary by annual ridership and an agency’s share of the total vehicle revenue distance in its urbanized area, based on the final model.

Figure 3
Figure 3.Modeled relationships between probability of GTFS adoption and significant predictors

ACKNOWLEDGMENTS

This research was funded by the Laboratory for Design Technology at the Harvard Graduate School of Design. The authors would like to thank Mengyao Li for her assistance in assembling data from the National Transit Database.


  1. The earliest GTFS feed for the City of Fairfax CUE bus listed a service date range from 2000 – 2099. Rather than list 2000 as the date of GTFS adoption, we used the date the feed was uploaded to the GTFS Data Exchange.

Submitted: October 07, 2022 AEST

Accepted: December 21, 2022 AEST

References

Czebotar, Jehiah. 2016. “GTFS Data Exchange.” http:/​/​www.gtfs-data-exchange.com/​.
Federal Transit Administration. 2007–2010. “National Transit Database.” National Transit Database. https:/​/​www.transit.dot.gov/​ntd/​ntd-data.
Frick, Karen Trapenberg, Tanu Kumar, and Alison Post. 2020. “Background Paper: The General Transit Feed Specification (GTFS) Makes Trip-Planning Easier—Especially During a Pandemic—Yet Its Use by California Agencies Is Uneven.” University of California, Institute of Transportation Studies. https:/​/​escholarship.org/​uc/​item/​1f29b7dk.
Interline Technologies. 2022. “Source Feeds: GTFS, GTFS Realtime, GBFS • Transitland.” https:/​/​www.transit.land/​feeds.
Iseki, Hiroyuki, Allison C. Yoh, and Brian D. Taylor. 2007. “Are Smart Cards the Smart Way to Go?: Examining Their Adoption by U.S. Transit Agencies.” Transportation Research Record: Journal of the Transportation Research Board 1992 (1): 44–53. https:/​/​doi.org/​10.3141/​1992-06.
Google Scholar
McHugh, Bibiana. 2013. “Pioneering Open Data Standards: The GTFS Story.” In Beyond Transparency: Open Data and the Future of Civic Innovation, edited by Brett Goldstein and Lauren Dyson, 1st ed., 125–36. San Francisco: Code for America Press.
Google Scholar
Mobility Data IO. 2021. “OpenMobilityData - Public Transit Feeds from around the World.” https:/​/​transitfeeds.com/​.
Rogers, Everett M. 2003. Diffusion of Innovations. 5th ed. New York: Free Press.
Google Scholar
Walker, Kyle, and Matt Herman. 2022. tidycensus: Load US Census Boundary and Attribute Data as “tidyverse” and ’sf’-Ready Data Frames. R package (version 1.2.). https:/​/​CRAN.R-project.org/​package=tidycensus.
Google Scholar

This website uses cookies

We use cookies to enhance your experience and support COUNTER Metrics for transparent reporting of readership statistics. Cookie data is not sold to third parties or used for marketing purposes.

Powered by Scholastica, the modern academic journal management system