Loading [MathJax]/jax/output/SVG/jax.js
Skip to main content
null
Findings
  • Menu
  • Articles
    • Energy Findings
    • Resilience Findings
    • Safety Findings
    • Transport Findings
    • Urban Findings
    • All
  • For Authors
  • Editorial Board
  • About
  • Blog
  • covid-19
  • search

RSS Feed

Enter the URL below into your favorite RSS reader.

http://localhost:22663/feed
Transport Findings
February 15, 2019 AEST

Pavement Condition and Crashes

David Levinson, Toshihiro Yokoo, Mihai Marasteanu,
weatherpavement conditiontraffic safety
Copyright Logoccby-nc-4.0 • https://doi.org/10.32866/5771
Findings
Levinson, David, Toshihiro Yokoo, and Mihai Marasteanu. 2019. “Pavement Condition and Crashes.” Findings, February. https:/​/​doi.org/​10.32866/​5771.
Save article as...▾
Download all (2)
  • Figure 1: Crash data (a) original and (b) after processing of Select by location
    Download
  • Figure 2: Road characteristics of crash location (Red line is one segment)
    Download

Sorry, something went wrong. Please try again.

If this problem reoccurs, please contact Scholastica Support

Error message:

undefined

View more stats

Abstract

This paper combines GIS data on crashes with a separate GIS database on pavement quality to test the relationship between pavement quality and crashes over 12 years. Poor road quality is associated with more property damage and injury crashes. The interaction of road quality and curves was surprising, indicating that good pavement quality on curves was associated with an increase in the fatal, injury, and property-damage crash rate.

1. Research Question and Hypotheses

It has been posited that poor pavement quality reduces the ability of roads to drain and reduces the ability of vehicles to resist skidding, and is thus associated with more crashes. Previous research has found that crash rate depends on both pavement type and pavement condition (Buddhavarapu, Banerjee, and Prozzi 2013; Al-Masaeid 1997; Abdel-Aty and Abdalla 2004; Lee, Nam, and Abdel-Aty 2015; Najafi, Flintsch, and Medina 2017; Merritt et al. 2015; Elghriany 2016; Vinayakamurthy, Mamlouk, and Underwood 2017; Chan et al. 2009).

Our research tests the relationship between number of crashes and road quality using data from Minnesota, while controlling for traffic data (annual average daily traffic (AADT) and percent truck), segment length, crash conditions (date, road characteristics, and road surface), and pavement type. We test the hypothesis that higher quality roads have fewer crashes.

2. Data and Methods

This research uses pavement quality data and crash data from the Minnesota Department of Transportation (MnDOT). Pavement quality data is available from 2000 to 2015, the crash data from 2003 to 2014. Therefore, we use the data from 2003 to 2014 in order to analyze the relationship between incident number and road quality. While MnDOT’s crash data is recorded for all road sections in Minnesota, pavement quality data is only available for selected road segments (state and county highways).

The crash data is a GIS shapefile and contains information about each crash including: location, crash date, severity of crash, crash type, road characteristics, road design, and weather condition.

The pavement quality data records pavement roughness and surface distress information for each year. AADT and percent truck on each segment are also collected. We also received an electronic highway map from MnDOT, which has highway segment information.

Several standard indicators of pavement quality (Surface Rating (SR), International Roughness Index (IRI), Pavement Quality Index (PQI)) are provided, but we focus on the Ride Quality Index (RQI). RQI ranges from 0-5 and indicates the smoothness of the pavement, with 5 indicating smoother. The correlation between the alternative pavement quality indices are high (RQI and SR: 0.55, PQI and SR: 0.89, PQI and RQI: 0.85, RQI and IRI: -0.97), so we use only RQI as an independent variable describing pavement quality.

To manage the data, we use QGIS version 2 (Sutton and Dassau 2015), an open source geographic information system. The crash data is recorded as points and the pavement quality data is recorded on mile-by-mile basis. We match these two data using QGIS.

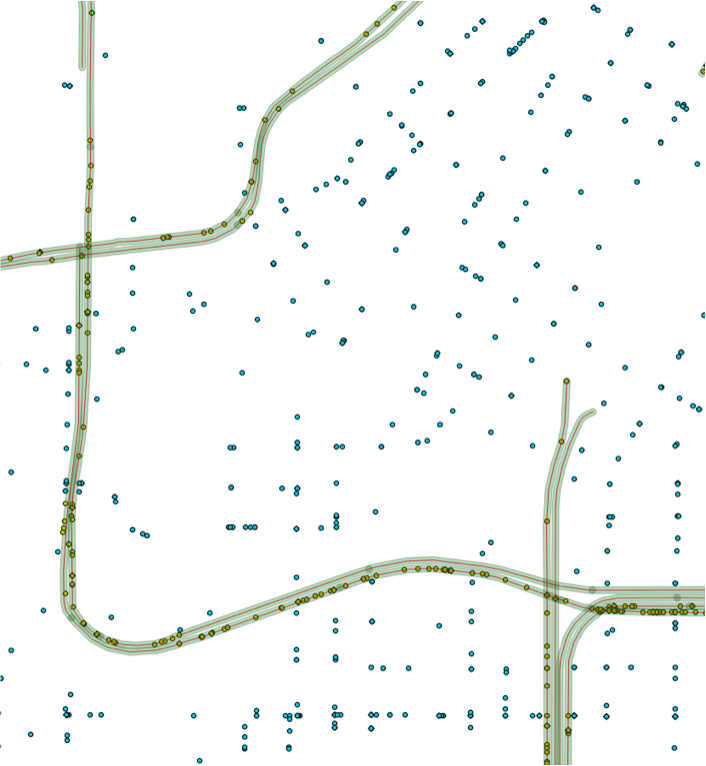
In brief, we select for crashes by year. There are around 15,900 crashes per year, 190,918 in total. We aim to select crashes only on state highways for which pavement quality data is available (Figure 1). We count the crashes on each segment by severity level (1: Incapacitating Injury, 2: Non-incapacitating Injury, 3: Possible Injury, 4: Fatal, 5: Property Damage, 6: No Value). The count depends on the GIS buffer around the road, tighter buffers remove crashes from the data set, (Table 1) ultimately we use a buffer of 0.00001m (i.e. only accepting crashes that were accurately geocoded), preferring elimination of false positives to the presence of false negatives. Then we merge the crash data with the pavement quality data.

Table 1:Accuracy of buffer size
Year Buffer size Total crash (A) Points in polygon (B) # of Error (B-A) Error rate
2004 10m 39,010 44,993 5,983 15.3%
2004 5m 38,465 43,224 4,759 12.4%
2004 3m 38,292 42,700 4,408 11.5%
2004 1m 38,129 41,900 3,771 9.9%
2004 0.1m 37,378 39,251 1,873 5.0%
2004 0.001m 36,388 37,143 755 2.1%
2004 0.0001m 32,303 32,343 40 0.1%
2004 0.00001m 29,581 29,581 0 0.0%
Figure 1
Figure 1:Crash data (a) original and (b) after processing of Select by location

We analyze RQI for each year on a mile-by-mile basis, and control for traffic, share of trucks, pavement type, highway geometry, weather conditions, day-of-week, month-of-year, and time-of-day. The dependent variable is the number of crashes on each segment in each year (distinguished for each severity level). Number of crashes by severity is given by (CrashS) where (S=Fatal, Injury, or Property damage). Many segments had no crashes in a given year. Injury is the sum of Incapacitating Injury, Non-incapacitating Injury, and Possible Injury. Table 2 lists the independent variables.

Figure 2
Figure 2:Road characteristics of crash location (Red line is one segment)

In order to avoid the dummy variable trap, we drop one category from the model for variables which would otherwise be determined, in this case, Year: 2014 and Pavement type: concrete.

We also add several independent variables about crash conditions (date, road characteristics, and road surface) to the model. To illustrate the coding, as shown in, horizontal alignment of crash location is both ‘straight’ and ‘curve’ in this segment, and vertical alignment of crash location is ‘level’, ‘grade’ and ‘hillcrest’. In this case, the value of ‘curve’, ‘grade’ and ‘hillcrest’ are 1 while the value of ‘sag’ is 0. We code for ‘Spring Load Restrictions’ (SLR) (March to May) when roads are weak during spring due to the spring thaw, therefore the local authority has begun Spring Load Weight Restrictions (SLR) to reduce road damage (MnDOT, n.d.). We code for peak travel periods, ‘Rush hour’ is defined as 6 am to 9 am and 3 pm to 7 pm (Brown 2013).

We analyze the relationship with a Negative Binomial Regression using the statistical package R version 3.

Table 2:List of Independent variables
Variables Definition
Trucks Percentage of truck volume among total traffic volume
Traffic Annual average daily traffic (AADT)
Length Segment length (miles)
Bituminous1 Indicator, 1= pavement type is BAB, BFD, or BOB, (BAB: Bituminous Aggregate Base, BFD: Bituminous Full Depth, BOB: Bituminous Over Bituminous)
0 = otherwise
Bituminous2 Indicator, 1= pavement type is BOC, (BOC: Bituminous Over Concrete)
0 = otherwise
Concrete Indicator, 1= pavement type is Concrete, (CD: Concrete Doweled, CRC: Continuously Reinforced Concrete, CU: Concrete Undoweled)
0 = otherwise
Year2003 - Year2014 Indicator, 1= crash year is each year (2003 to 2014),
0 = otherwise
Weekend Indicator, 1= crash date is Saturday or Sunday,
0 = otherwise
Curve Indicator, 1= horizontal alignment of crash location is curve,
0 = otherwise
Grade Indicator, 1= vertical alignment of crash location is grade,
0 = otherwise
Hillcrest Indicator, 1= vertical alignment of crash location is hillcrest,
0 = otherwise
Sag Indicator, 1= vertical alignment of crash location is sag,
0 = otherwise
Wet Indicator, 1= road surface of crash location is wet,
0 = otherwise
Snow Indicator, 1= road surface of crash location is snow,
0 = otherwise
SLR Indicator, 1= crash date is during Spring Load Restrictions,
0 = otherwise
Rushhour Indicator, 1= crash date is during rush hour,
0 = otherwise
XX : RQI Interaction term, RQI: Ride quality index

3. Findings

Table 3 shows regression results.

Table 3:Negative Binomial Regression: Number of crashes by type by year
Fatal Injury Property damage
Estimate z value Estimate z value Estimate z value
(Intercept) -6.398E+00 -39.368 *** -3.024E+00 -104.461 *** -2.336E+00 -105.923 ***
Trucks -1.836E-02 -3.492 *** -2.692E-02 -25.887 *** -1.721E-02 -22.090 ***
Traffic -1.636E-05 -5.938 *** 4.788E-06 11.105 *** 1.100E-05 32.570 ***
Traffic2 8.180E-11 4.106 *** 2.979E-12 0.985 -2.516E-11 -10.391 ***
Length 7.312E-01 6.918 *** 1.927E-01 10.644 *** 5.968E-02 4.251 ***
Bituminous1 6.024E-02 0.268 1.710E-01 4.036 *** 1.951E-01 5.946 ***
Bituminous2 -3.668E-01 -1.122 4.083E-01 7.687 *** 6.599E-01 16.297 ***
Year2003 2.462E-01 2.216 * 1.396E-01 6.566 *** 3.620E-02 2.208 *
Year2004 1.746E-01 1.551 1.772E-01 8.407 *** 1.171E-01 7.231 ***
Year2005 2.221E-01 1.987 * 1.255E-01 5.893 *** 6.115E-02 3.744 ***
Year2006 1.050E-01 0.904 1.679E-01 7.764 *** 1.040E-01 6.260 ***
Year2007 1.785E-01 1.561 1.355E-01 6.297 *** -1.400E-02 -0.838
Year2008 8.069E-02 0.691 9.398E-02 4.369 *** -3.147E-02 -1.901 .
Year2009 -2.950E-02 -0.242 7.359E-02 3.367 *** -4.565E-02 -2.716 **
Year2010 -1.403E-01 -1.125 1.107E-01 5.102 *** -1.350E-02 -0.808
Year2011 -1.817E-01 -1.444 5.851E-02 2.682 ** -4.176E-02 -2.497 *
Year2012 -1.850E-01 -1.455 1.264E-01 5.738 *** 3.719E-02 2.194 *
Year2013 -1.907E-01 -1.541 7.143E-03 0.330 -2.421E-02 -1.475
Weekend 6.966E-01 2.017 * 6.883E-01 11.784 *** 6.545E-01 15.061 ***
Curve -2.234E-01 -0.734 -1.131E-02 -0.221 -4.729E-02 -1.185
Grade 7.971E-01 2.451 * 1.809E-01 3.394 *** 3.014E-01 7.356 ***
Hillcrest 5.427E-01 1.219 2.991E-01 4.064 *** 3.445E-01 5.838 ***
Sag -8.215E-02 -0.170 3.390E-01 4.396 *** 3.498E-01 5.635 ***
Wet -3.373E-02 -0.104 7.134E-01 13.210 *** 6.567E-01 15.924 ***
Snow 6.920E-01 2.181 * 3.621E-01 6.799 *** 4.471E-01 10.944 ***
SLR 3.394E-02 0.102 7.174E-01 12.400 *** 7.906E-01 18.232 ***
Rushhour 8.613E-01 2.298 * 1.598E+00 23.750 *** 1.759E+00 35.188 ***
Bituminous1 : RQI 8.621E-03 0.125 -1.959E-02 -1.464 -5.980E-02 -5.780 ***
Bituminous2 : RQI 1.199E-01 1.185 -8.553E-02 -5.023 *** -1.597E-01 -12.326 ***
RQI : Weekend 5.779E-02 0.547 3.565E-02 1.939 . 2.473E-02 1.800 .
RQI : Curve 2.784E-01 2.951 ** 6.980E-02 4.268 *** 6.846E-02 5.368 ***
RQI : Grade -1.873E-01 -1.861 . 6.308E-03 0.371 -6.614E-03 -0.505
RQI : Hillcrest -1.118E-01 -0.777 -4.066E-02 -1.672 . -5.272E-02 -2.704 **
RQI : Sag 9.596E-02 0.623 -5.401E-02 -2.126 * -5.011E-02 -2.448 *
RQI : Wet 5.531E-02 0.554 -3.886E-02 -2.270 * -1.769E-02 -1.346
RQI : Snow -2.395E-01 -2.449 * 2.036E-02 1.202 8.254E-02 6.331 ***
RQI : SLR 1.436E-01 1.406 -2.290E-02 -1.260 -5.142E-02 -3.758 ***
RQI : Rushhour 1.082E-01 0.948 -5.638E-02 -2.698 ** -1.114E-01 -7.139 ***
AIC 17,311 191,321 260,910

Legend: . p<0.1; * p<0.05; **p<0.01; *** p<0.001

Good pavement quality is associated with lower crash rates in several conditions:

  • Snow (RQI:Snow) for fatal crashes,
  • Asphalt over concrete (Bituminous2:RQI) and sags (RQI:Sag) for injury and property damage crashes,
  • Wet roads (RQI:Wet) for injury crashes, and
  • Crests (RQI:Hillcrest), and spring load restrictions (RQI:SLR) for property damage crashes.

The z-value from the model indicates that there are significant differences across pavement type.

However, counter-intuitively perhaps, for all three crash types, good pavement quality on curves (RQI:Curve) increases number of crashes compared with curves in general or good pavement quality in general. Perhaps poor pavement quality on curves positively affects driver alertness. Speed limit, speed compliance, and curve geometry play important role in these types of crashes.

Similarly for property damage crashes, good pavement quality in snow (RQI:Snow) is associated with an increase in crashes.

Bituminous pavement material (Bituminous1 and Bituminous2) is associated with a higher number of injury and property damage crashes. The causality might not be that bituminous pavement causes crashes, rather it could be that concrete surfaced roads, which are fewer in number and tend to serve higher levels of traffic, are built to a different or more modern standard. However there is no evidence to support or refute this speculation. Future research can try to disentangle this question by examining otherwise identical road sections that changed pavement material. In winter conditions, ice (black ice) conditions occur, and the effects of de-icing chemicals on different surfaces might also factor.

Our other findings are as follows:

  • As would be expected, in all cases segment length is positive, longer segments have more opportunities for crashes.
  • For all cases, percentage trucks is negative, indicating number of crashes drop on facilities with a higher share of trucks. Roads serving a higher share of trucks may be built to a higher standard than other roads, so the causality might not be that trucks reduce crashes.
  • The relationship between traffic and crashes is more complex. We modeled this parabolically, including both Traffic and Traffic2. For fatal crashes, at lower levels of traffic, crashes decline with increasing traffic, but beyond a threshold they increase. In contrast for property damage crashes, the relationship is the reverse, and for injury crashes, crashes increase with number of vehicles on the road.
  • During rush hour periods crashes of all types increase due to the increased opportunity for vehicular interaction.
  • Injury and property damage crashes generally decrease over time (compared with 2014).
  • Crashes of all types increase on weekends, on grades, and in snow.
  • Injury and property damage crashes increase on hillcrests, sags, wet conditions, and during the Spring Load Restrictions period.

References

Abdel-Aty, Mohamed, and Fathy Abdalla. 2004. “Linking Roadway Geometrics and Real-Time Traffic Characteristics to Model Daytime Freeway Crashes: Generalized Estimating Equations for Correlated Data.” Transportation Research Record: Journal of the Transportation Research Board, no. 1897, 106–15.
Google Scholar
Al-Masaeid, Hashem R. 1997. “Impact of Pavement Condition on Rural Road Accidents.” Canadian Journal of Civil Engineering 24 (4): 523–31.
Google Scholar
Brown, Heather. 2013. “Good Question: When Is Rush Hour?” 2013. http:/​/​minnesota.cbslocal.com/​2013/​07/​29/​good-question-when-is-rush-hour.
Buddhavarapu, Prasad, Ambarish Banerjee, and Jorge A Prozzi. 2013. “Influence of Pavement Condition on Horizontal Curve Safety.” Accident Analysis & Prevention 52:9–18.
Google Scholar
Chan, Chun Yip, Baoshan Huang, Xuedong Yan, and Stephen Richards. 2009. “Relationship Between Highway Pavement Condition, Crash Frequency, and Crash Type.” Journal of Transportation Safety & Security 1 (4): 268–81.
Google Scholar
Elghriany, Ahmed F. 2016. “Investigating Correlations of Pavement Conditions with Crash Rates on In-Service US Highways.” PhD thesis, University of Akron.
Lee, Jaeyoung, BooHyun Nam, and Mohamed Abdel-Aty. 2015. “Effects of Pavement Surface Conditions on Traffic Crash Severity.” Journal of Transportation Engineering 141 (10): 04015020.
Google Scholar
Merritt, David K, Craig Lyon, Bhagwant Persaud, and others. 2015. “Evaluation of Pavement Safety Performance.” United States. Federal Highway Administration.
MnDOT. n.d. “Spring Load Restrictions.” Accessed May 3, 2016. http:/​/​dotapp7.dot.state.mn.us/​research/​seasonal_load_limits/​thawindex/​slr_introduction.pdf.
Najafi, Shahriar, Gerardo W Flintsch, and Alejandra Medina. 2017. “Linking Roadway Crashes and Tire--Pavement Friction: A Case Study.” International Journal of Pavement Engineering 18 (2): 119–27.
Google Scholar
Sutton, Tim, and Otto Dassau. 2015. “QGIS.” http:/​/​www.qgis.org/​en/​site/​index.html.
Vinayakamurthy, Mounica, Michael Mamlouk, and PE Shane Underwood. 2017. “Effect of Pavement Condition on Accident Rate.” Master of Science, Arizona State 452.
Google Scholar

This website uses cookies

We use cookies to enhance your experience and support COUNTER Metrics for transparent reporting of readership statistics. Cookie data is not sold to third parties or used for marketing purposes.

Powered by Scholastica, the modern academic journal management system