

1. QUESTIONS
A trip chain consists of a sequence of trips individuals make. These trip chains can be simple or complex with different levels of complexity. An analysis of trip chains with different and informal modes from a megacity in the Global South can reveal interesting travel behaviors and modality patterns. These trip-level analyses are important for developing sustainable transport policies in the Global South, especially in achieving emission reduction goals from the transport sector (Ashik, Rahman, and Kamruzzaman 2022). In this study, we use trip chain data collected from the residents of Dhaka to examine two research questions:
What different modality groups exist in Dhaka?
How do different modes contribute to the complex trip chains of an individual?
2. METHODS
Data collection
As part of the Dhaka Urban Transport Network Development Study (DHUTS), 2010, and the Revised Strategic Transport Plan (RSTP) for Dhaka (2015-2035), Household Interview Survey (HIS) was conducted in the Rajdhani Unnayan Kartripakkha (RAJUK[1]) area of Dhaka. Combined HIS data of the DHUTS and RSTP is the most recent and complete database of travel behaviors in Dhaka used for travel behavior analysis in most recent studies (Ashik et al. 2022; Nakshi and Debnath 2020). The Dhaka metro area is currently the sixth largest in the world: home to 22.4 million people with a population density of 23,234 persons per square kilometer (World Population Review 2022). The HIS employed a systematic random sampling technique (with a 0.75% sample rate) to select a sample of 29,112 households from 192 Traffic Analysis Zones (TAZs) in the Dhaka Metropolitan Development Plan (DMDP) area under RAJUK, consists of around 1,18,026 individuals and 2,01,589 trips (Dhaka Transport Coordination Authority 2015). This may not be fully representative of the study area. However, the study also provided weight for each observation. So, after weighting the observations, a representative summary of the findings of the survey can be achieved that can be used for further population-level analysis. The survey was conducted during 2010-2014. Each household member older than 10 years old was asked about their trip records (trip origin and destination, departure and arrival time, trip purpose, trip expense, transport modes, transfers, etc.) made on the day before the survey date.
Data Preprocessing and Analysis
From the one-day travel diary data of the survey respondents, we constructed trip chains for each individual. We produced the trip chains based on the sequence of activities that start and end at home. Following the definition of Primerano et al. (2008) & Schneider et al. (2021), we defined that a trip chain starts when an individual leaves home and ends when that individual return home. This gives an impression of the individuals’ travel patterns for an entire day. The majority of the individual both start and end their trips at home found in the records of the HIS survey. Entire day travel requires an individual to make some preliminary decisions about how the travel pattern of that individual will unfold during the entire day. Studies show that the trip chain precedes mode choice (Li et al. 2013; Yang, Shen, and Li 2016; Ye, Pendyala, and Gottardi 2007). So, the entire day’s journey should be considered totally by considering the activity framework rather than just traveling between activities while defining the trip chain (Primerano et al. 2008).
From our data, we only keep those observations that start and end at home and dropped others. After analyzing the trip records, we extracted 77,807 one-day travel diaries of individuals from a total of 2,01, 589 trips for final analyses. After dropping those chains that did not start or end at home (about 6,888 cases) we end up with 70,919 one-day trip chains. The complexity of the chain was determined by the number of activity purposes associated with the chain (Primerano et al. 2008). If an individual reports two or fewer purposes for a day, the trip is coded as a “simple” chain, between three to five purposes for a day were coded as a “complex” chain, and more than five purposes for a day were coded as a “super complex” chain. Then, we assigned mode in the trip chains. Although multimodality is defined in various ways in the transport literature (Heinen and Mattioli 2019), we used the simplest approach. Individuals who reported using one mode were coded as “Unimodal”, using two to four modes as “Multimodal (2 to 4 modes)”, and using more than four modes were coded as “Multimodal (more than 4 modes)”.
We then analyzed the combination of the different modes used in different types of trip chains. We also analyzed what proportion of travelers falls into different multimodality groups.
3. FINDINGS
Modal share for different trip purposes
Our analysis shows that walking and the use of a rickshaw (a pedaled three-wheeler, mostly nonmotorized but can be motorized by an electric battery) are dominant primary modes (i.e., a mode used to cover the largest distance for an activity) for performing different activities. However, for performing non-home-based business trips, along with rickshaws, individuals generally use buses and cars at higher proportions (Figure 1).
Descriptive statistics on trip chain characteristics
We found individuals make simple to different types of complex chains based on the number of activities associated with the chains (Table 1). The median number of activities and stops associated with trip chains is two and the median use of unique mode in the chain is one. The median daily travel time for an individual is sixty minutes.
Modal configuration in trip chains
We found that the most common trip chain patterns involve walking and using a rickshaw (Table 2). Walking is an important component of the first and last mile (Mohiuddin 2021) that is found in this study also. Individuals who used public transport (i.e., bus) covered their first and last mile transit connections mainly by walking.
Modal contribution in trip chains
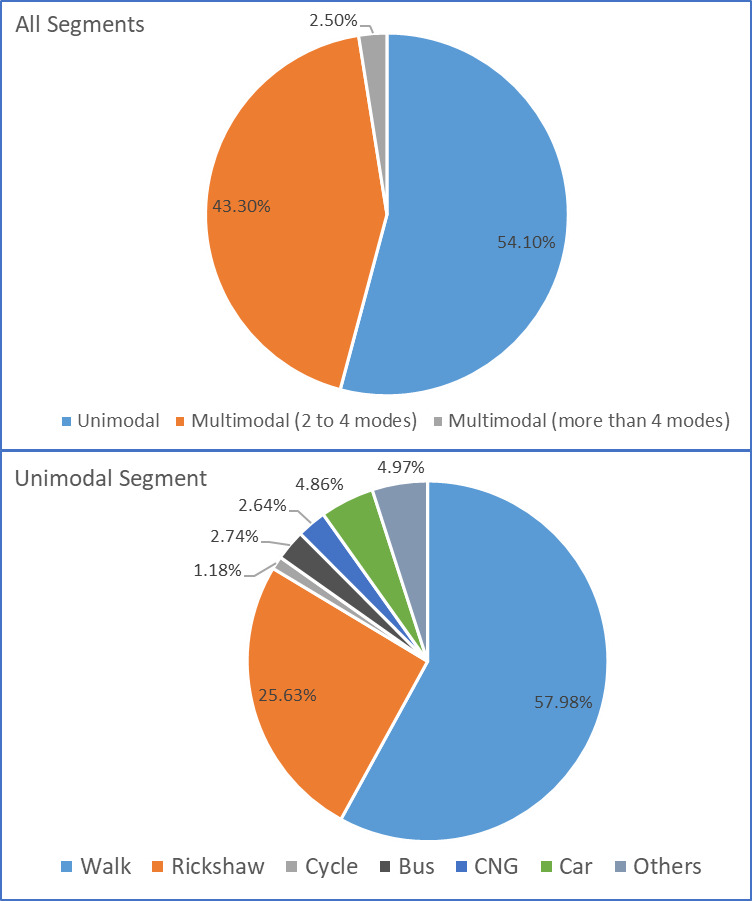
Based on the one-day trip and mode use data, we can observe that the majority of individuals are unimodal (Figure 2). Among the unimodal segment, the majority portion only walks, and a considerable portion also uses rickshaws. The third highest mode of the unimodal segment is by car. The use of a cycle is minimal in the unimodal segment. This lower rate of cycling may be due to limited infrastructure and perceptions of the built environment (Jamal, Mohiuddin, and Paez 2020; Jamal and Mohiuddin 2020; Mohiuddin, Jamal, and Rahman Bhuiya 2022). However, this finding has to be used with caution as we are relying on the one-day travel diary that may not capture the entire travel patterns and mode choice behavior at the individual level.

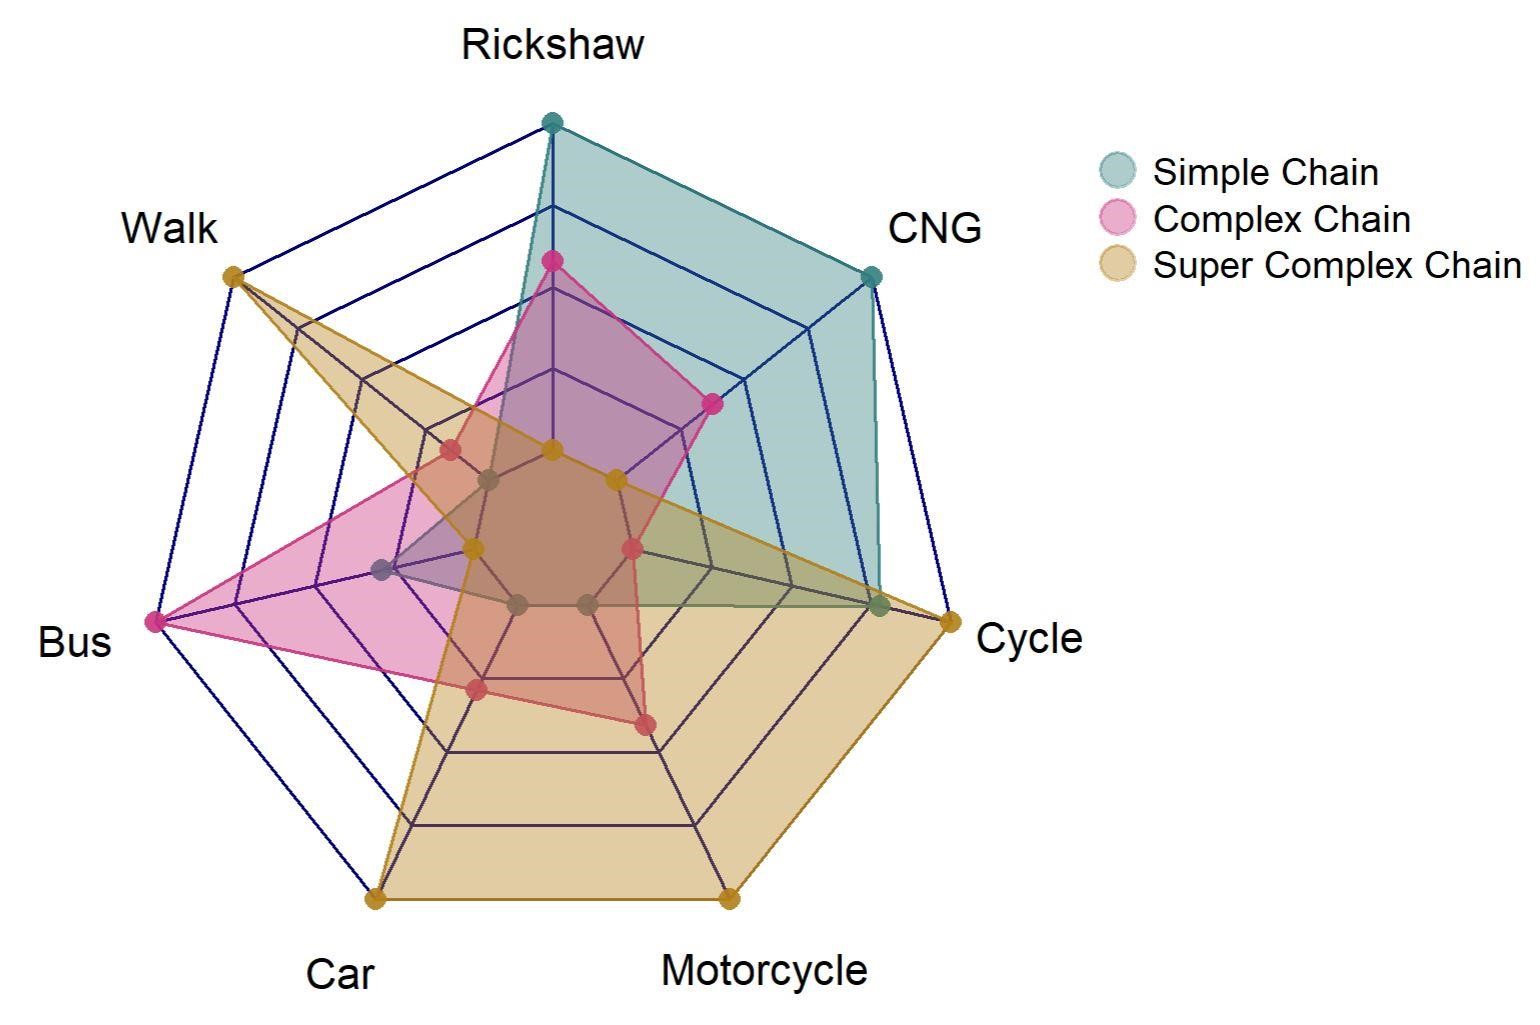
Among the trip chain types, 71.2% were simple, 27.2% were complex, and 1.6% were classified as super complex. We produced a radar plot to illustrate the relative position of each mode with respect to different types of trip chain categories (Figure 3). For a given mode, if the color of a trip chain type extends towards the border of the radar, that indicates that the chain segment has the highest value for that mode, and if the color of a chain type is located in the center for a mode, that indicates that the chain type has the lowest value for that mode. Personal vehicles either motorized or non-motorized have a higher proportion in super complex trip chains than in simple and complex chains. Although the contribution of cars is low in the overall trip chain, they are likely to be present in high proportions in the super complex chains. Interestingly, this is also evident for cycles as their contribution is higher in the super complex trip chains than other chains. The same is true for motorcycles.

Individuals tend to use public transport buses at a higher proportion in complex trip chains than simple and super complex chains. Rickshaws and CNGs are used in a high proportion in simple and complex chains than in super complex chains.
Research shows that trip making behavior of the individual is becoming complex as the individual becomes busy (Currie and Delbosc 2011). Research also shows that a personalized mode is appropriate for performing complex chains (Hensher and Reyes 2000). Studies show that the trip chain precedes mode choice (Li et al. 2013; Yang, Shen, and Li 2016; Ye, Pendyala, and Gottardi 2007). With the increase in trip complexity, the individual will be more likely to rely on cars. This may have several environmental consequences (Currie and Delbosc 2011). Trip chain studies mainly focus on the use of cars, public transit, and ridehailing. However, in the developing world, the proportion of personalized vehicles is still low and a variety of other different types of modes are available to travelers. Therefore, substantial research is required to comprehend the function of mode availability in facilitating complicated trip chains in the developing world. That will help the policymakers to capitalize on the potential of those modes to cater to the needs of travelers.
According to the conclusions of this study, planners and policymakers in developing nations will find that travelers with complex itineraries are more likely to use private automobiles in addition to walking and cycling. Therefore, there is a need to formulate policies that facilitate multi-modal facilities so that travelers with complex daily itineraries can transfer to public transport instead of relying on private modes.
Future studies can analyze different types of trip chains and mode use combinations with respect to trip purposes and socio-demographics of the trip makers.
ACKNOWLEDGEMENTS
The authors are grateful to the Dhaka Transport Coordination Authority (DTCA) for supplying Household Interview Survey (HIS) data for the Revised Strategic Transport Plan (RSTP). The author would like to convey special thanks to Zhi Chen for his kind suggestions and for proofreading the article.
It is a government agency in Bangladesh that is in charge of urban development in Dhaka. Its name means “Capital Development Authority of the Government of Bangladesh.”