Processing math: 100%
Skip to main content
null
Findings
  • Menu
  • Articles
    • Energy Findings
    • Resilience Findings
    • Safety Findings
    • Transport Findings
    • Urban Findings
    • All
  • For Authors
  • Editorial Board
  • About
  • Blog
  • covid-19
  • search

RSS Feed

Enter the URL below into your favorite RSS reader.

http://localhost:5959/feed
Transport Findings
December 02, 2022 AEST

Computational Desire Line Analysis of Cyclists on the Dybbølsbro Intersection in Copenhagen

Simon Martin Breum, Bojan Kostic, Michael Szell,
urban data sciencecyclingtraffic behaviorintersection designhuman-centric planning
Copyright Logoccby-sa-4.0 • https://doi.org/10.32866/001c.56683
Findings
Breum, Simon Martin, Bojan Kostic, and Michael Szell. 2022. “Computational Desire Line Analysis of Cyclists on the Dybbølsbro Intersection in Copenhagen.” Findings, December. https:/​/​doi.org/​10.32866/​001c.56683.
Save article as...▾
Download all (4)
  • Figure 1. The study area is the Dybbølsbro intersection in Copenhagen (June 2021).
    Download
  • Figure 2. Traversal of the 12 origin-destination (OD) pairs by the cyclists, which yields 12 OD-clusters of trajectories.
    Download
  • Figure 3. Investigation of OD-cluster N→S and some of its path-clusters.
    Download
  • Supplementary Information.
    Download

Sorry, something went wrong. Please try again.

If this problem reoccurs, please contact Scholastica Support

Error message:

undefined

View more stats

Abstract

Contemporary street design prioritizes vehicular traffic flow and assumes compliant road users. However, actual human behavior is typically neglected, especially of cyclists, leading to streets with inadequate wayfinding and protection from vehicular traffic. To improve planning, here we develop a computational method to detect cyclist trajectories from video recordings and apply it to the Dybbølsbro intersection in Copenhagen, Denmark. In one hour of footage we find hundreds of trajectories that contradict the design, explainable by the desire for straightforward, uninterrupted travel largely not provided by the intersection. This neglect and the prioritization of vehicular traffic highlight opportunities for improving Danish intersection design.

1. Questions

Safe and functional cycling infrastructure is necessary to support the uptake of cycling in cities (Winters, Buehler, and Götschi 2017). Especially street intersections are important conflict points where cars and bicycles meet, causing a large fraction of road deaths and injuries (Götschi et al. 2018; Dozza and Werneke 2014; Ling et al. 2020; Bahrololoom, Young, and Logan 2020), and must therefore be planned with human behavior in mind. The intersection at Dybbølsbro, Copenhagen, is a notorious example which has been criticized for confusing cyclists due to its difficulty to navigate, and is currently scheduled for a second major redesign (Hunter 2021; Therkildsen 2021; WSP DANMARK A/S 2021). To understand to which extent intersection designs are adequate for cyclists, some studies have begun tracing and recording cyclist trajectories and behavior (Colville-Andersen et al. 2013; te Brömmelstroet 2014; Lind, Honey-Rosés, and Corbera 2020; Nabavi Niaki, Saunier, and Miranda-Moreno 2019; Casello et al. 2017). However, these methods are manual, therefore costly and not scalable.

Here we first ask: How can we use computational methods to automatize the analysis of cyclist trajectories? Focusing on Dybbølsbro, we then ask: How much do cyclist trajectories deviate from the design’s intended paths and why? Finally: What are the implications for the design of the Dybbølsbro intersection and of Danish intersections in general?

2. Methods

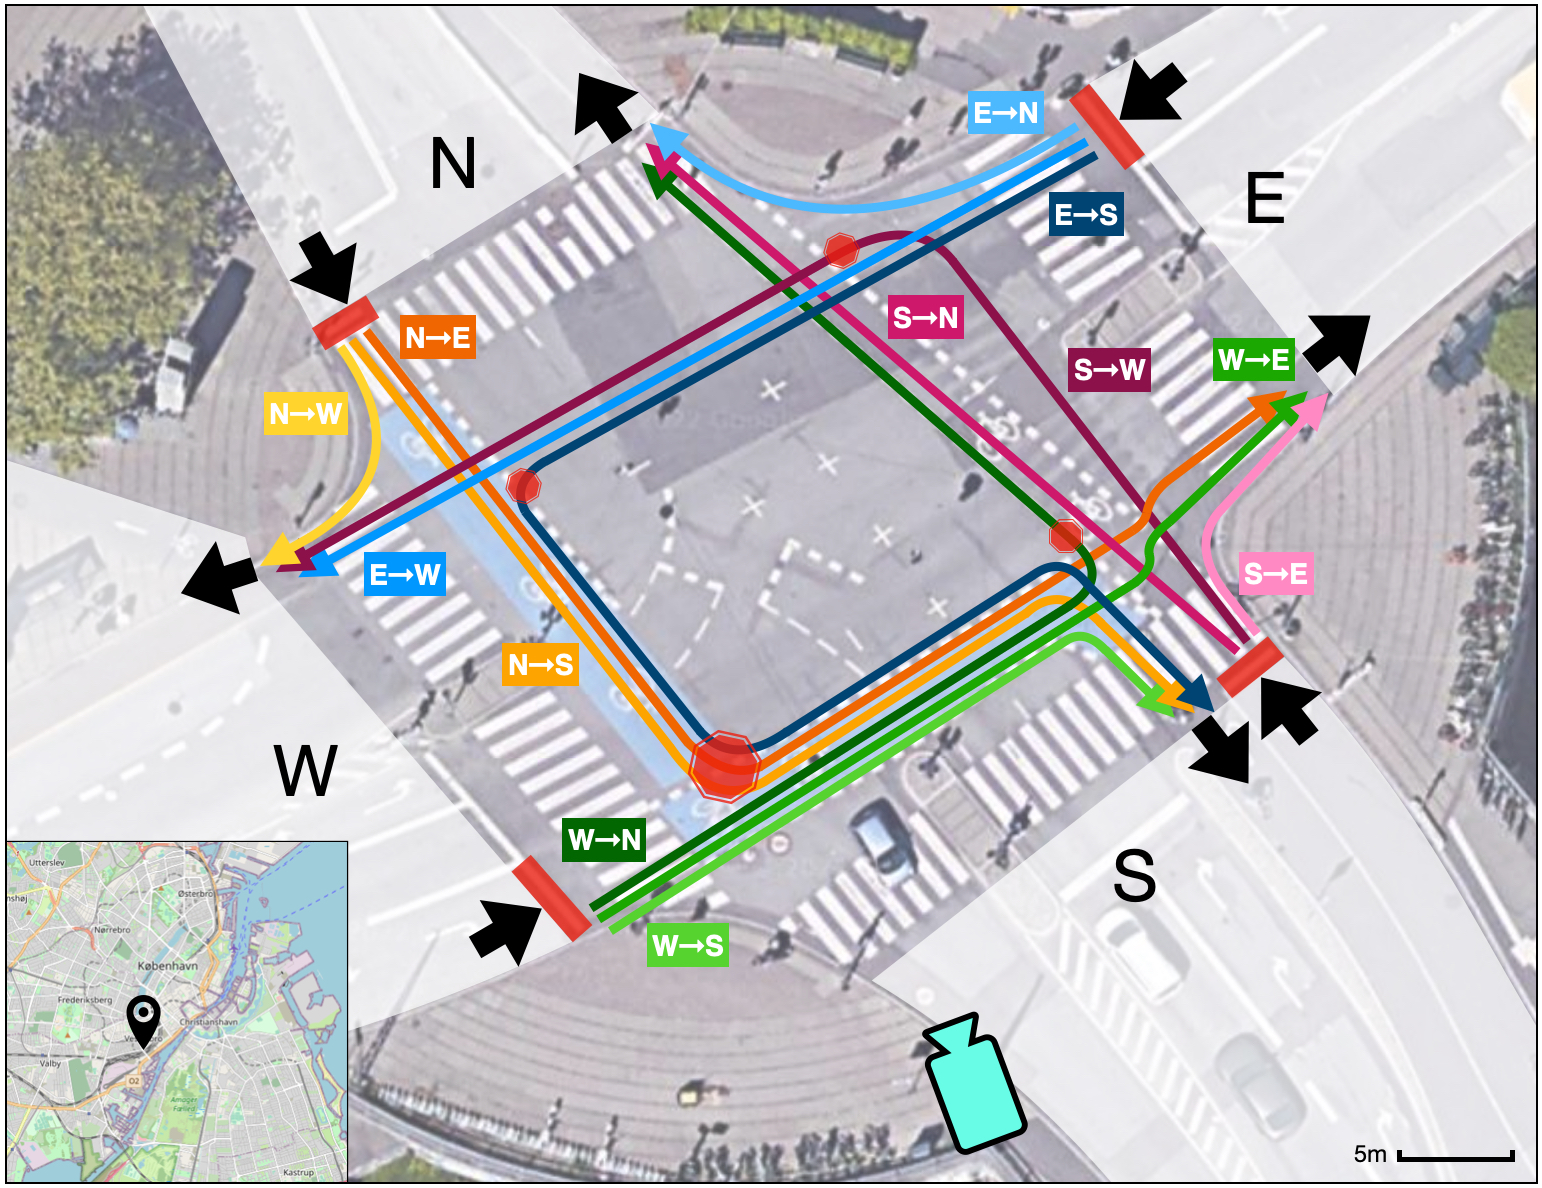
All data and code to reproduce our findings are available at: github.com/SimonBreum/desirelines Our starting point is a set of 11,553 cyclist trajectories, which had been extracted via custom-trained YOLOv5 model (see Supplementary Information Section S1) from a high-resolution 1h video from 2021-06-09 07:00-08:00 (Wednesday) of the Dybbølsbro intersection, see Fig. 1 This intersection has been redesigned in 2019 with a bidirectional bicycle track on the south side (S), which has made it difficult for cyclists to navigate due to the need to switch sides when coming from north (N) (WSP DANMARK A/S 2021). See Fig. 1 for all possible designed paths (simplifying one additional street in the northwest). Apart from the unconventional N→S path, the left turns S→N, N→E, W→N require one additional stop, and the left turn E→S requires two, due to general Danish intersection design (the “Copenhagen left”) (Larsen and Funk 2017).

Figure 1
Figure 1.The study area is the Dybbølsbro intersection in Copenhagen (June 2021).

There are 12 possible designed origin-destination paths (colored arrows) between the four sides N, W, S, E, connecting 8 legal entry and exit points for cyclists (black arrows). Before entering the intersection, cyclists on every side have to wait behind a signal line at red (red lines). Cyclists going from N to S (N→S) must in practice take an additional stop (stop symbol) due to the switch to a bidirectional cycle track on the S side. Left turning cyclists are technically allowed to turn left straightaway against red like vehicular traffic (Larsen and Funk 2017), but this is uncommon practice; in practice, cyclists must include one additional stop at a red traffic light in the corner when traveling S→W, N→E, W→N and two stops when traveling E→S. The camera symbol depicts the camera mounting at 10m height. Map data: ©2022 Google / Aerodata International Surveys, Maxar Technologies, and ©OpenStreetMap contributors.

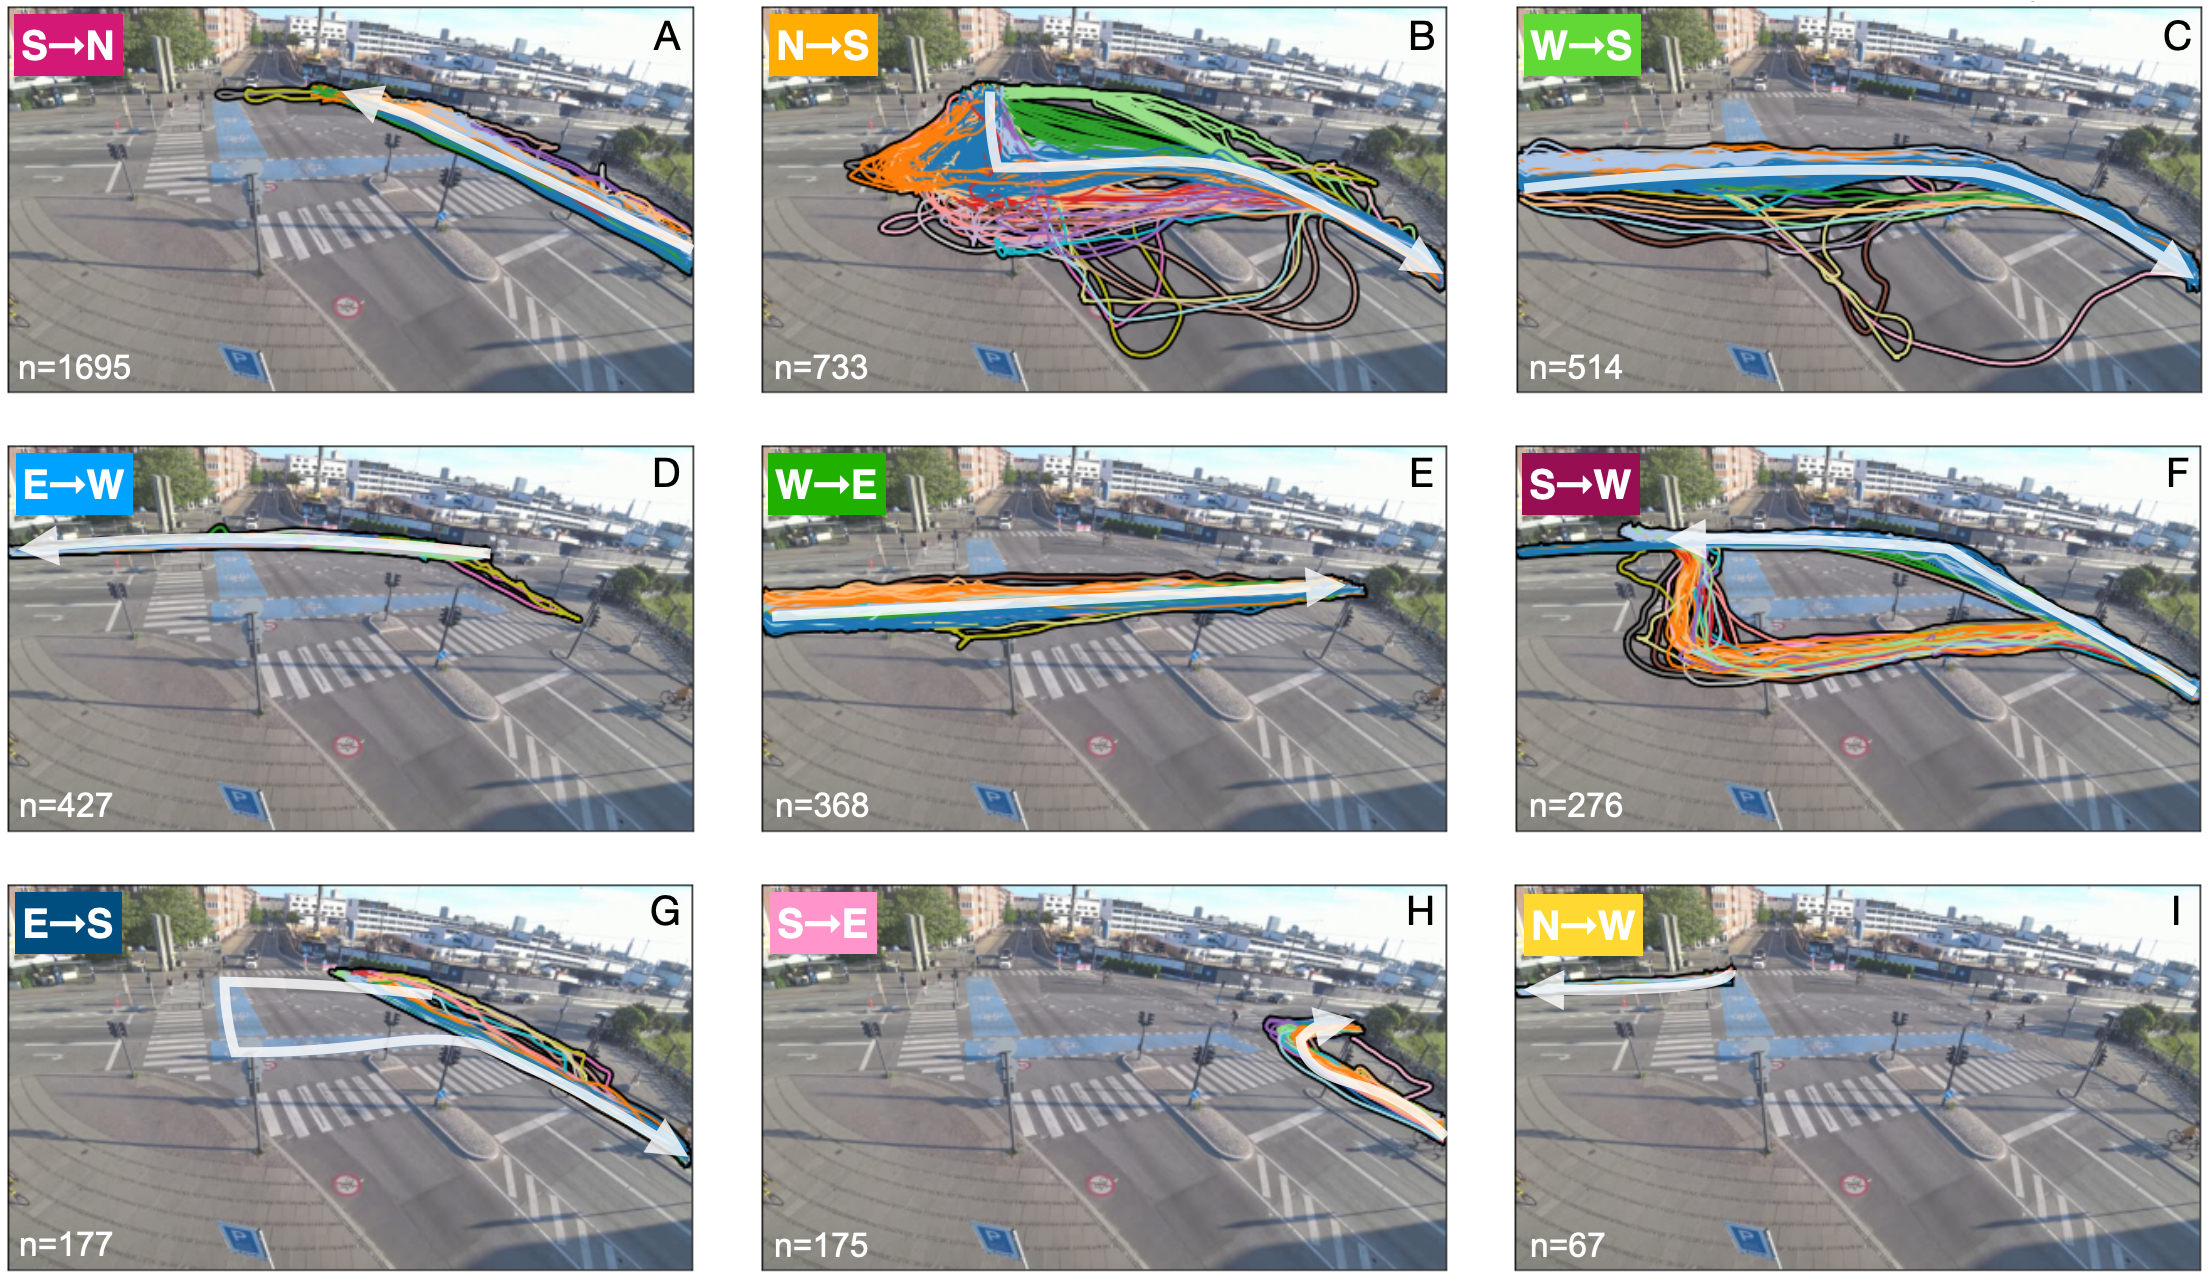
We applied DBSCAN to origin-destination pairs with ε=8 pixels (at a 640×360 resolution) and minPts=25, which yielded 4888 trajectories distributed among 16 origin-destination (OD) clusters. We discarded the remaining 6665 trajectories which are mostly broken trajectories, for example due to occlusion by traffic signs or vehicles. After manual inspection we merged two pairs of OD-clusters that each had the same origin and destination. We also discarded three other clusters of broken trajectories. In total this yielded 9 OD-clusters with 4432 trajectories, see Fig. 2, matching the 12 possible designed paths from Fig. 1 except for N→E, W→N, and E→N where not enough trajectories were found.

Figure 2
Figure 2.Traversal of the 12 origin-destination (OD) pairs by the cyclists, which yields 12 OD-clusters of trajectories.

White arrows denote the intended paths. Many trajectories deviate substantially from the intended paths. Colors within each OD-cluster depict different path clusters. For the three OD pairs N→E, W→N and E→N there are not enough trajectories to detect an OD-cluster.

To each of the OD-clusters we applied dynamic time warping (see Supplementary Information Section S2), generating 20 additional path-clusters respectively, denoted by different trajectory colors in Fig. 2. Finally, we contrasted these path-clusters with the designed paths to study how cyclists are actually moving from each origin to each destination versus how it was intended by the planners.

3. Findings

We found that at least 11% (495 out of 4432) trajectories are not following the designed paths. The effect is particularly strong in two specific OD-clusters:
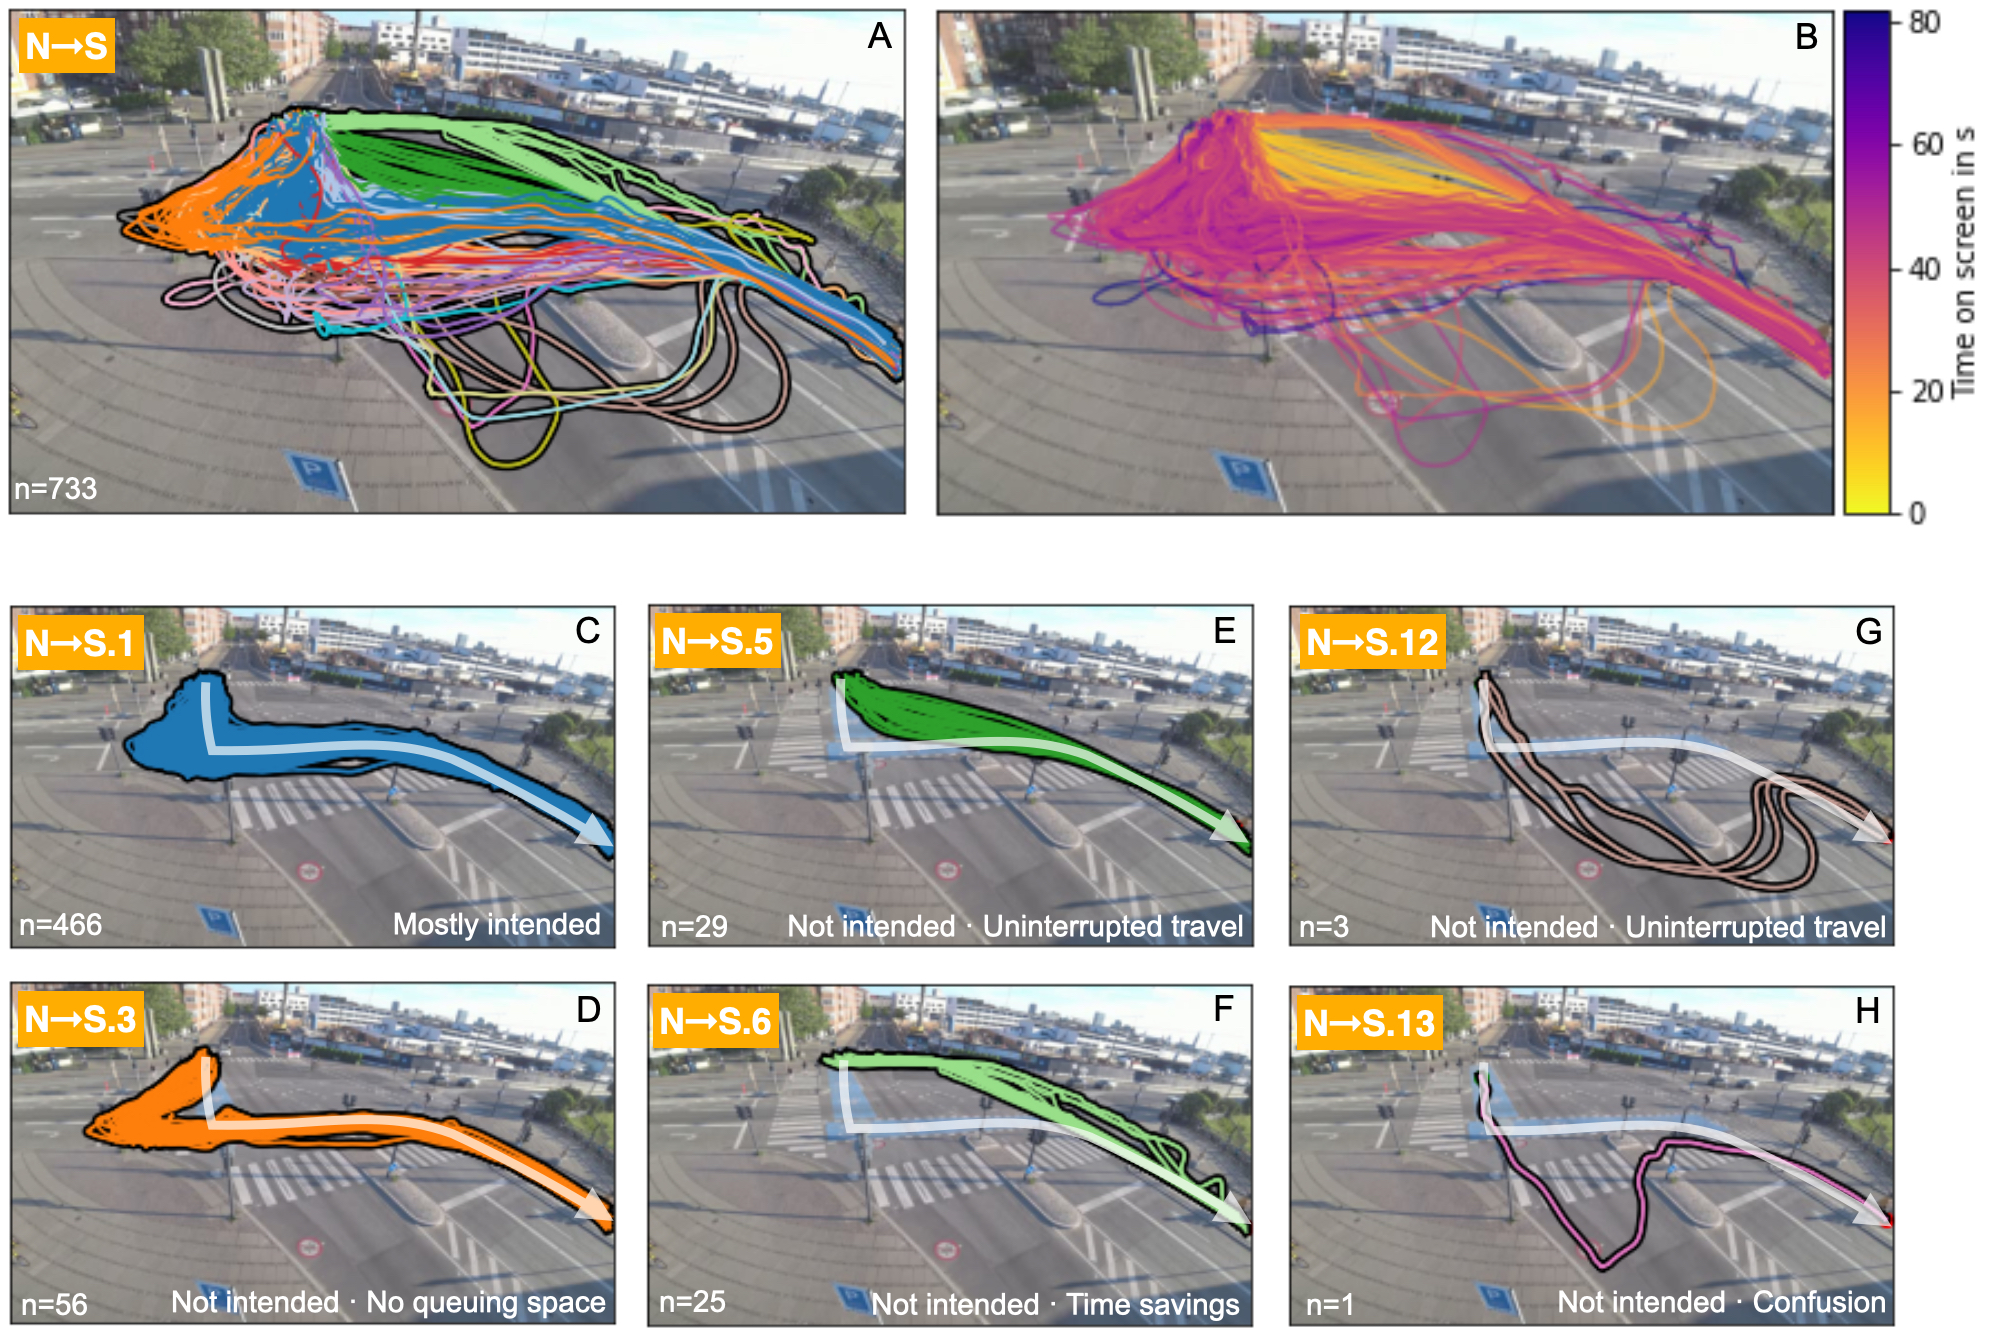
  • OD-cluster N→S (Fig. 3). Path-cluster N→S.1 (Fig. 3C): Only 466 out of 733 cyclists follow mostly intended behavior, implying a mismatch between design and reality of at least 36%. Path-cluster N→S.3 (Fig. 3D): Due to lack of queuing space, many cyclists cannot wait in front of the pedestrian crossing but are forced to enter it. Path-cluster N→S.5 (Fig. 3F): 29 cyclists crossed the intersection diagonally. Path-cluster N→S.6 (Fig. 3E): 25 cyclists crossed via the NE corner instead of the SW corner. Analysis of trajectory durations reveals the likely cause (Fig. 3B): On average, diagonally crossing cyclists spend only 13s, and cyclists crossing via the NE corner spend 32s. Contrast these values to 43s, which is the time spent by cyclists who follow the designed path with the additional stop. Further path-clusters (Fig. 3G,H): Uninterrupted, fast travel (3 cyclists), and confusion (1 cyclist).

  • OD-cluster E→S. Here we found 0 out of 177 empirical trajectories following the intended path, implying a mismatch between design and reality of 100%, explainable with the two additional stops that are considerably more convoluted than the direct path, Fig. 2G. To double-check, we selected from all 11,553 trajectories those going E→S irrespective of clustering, and found 9 out of 518 taking the two additional stops, lowering the mismatch to 98%.

Figure 3
Figure 3.Investigation of OD-cluster N→S and some of its path-clusters.

A) OD-cluster N→S and its 733 trajectories. B) Time on screen demonstrates that crossing the intersection diagonally, while illegal and not intended by the planners, provides substantially shorter crossing time (13s on average) than following the intended path (43s on average). Crossing via the NE corner is also faster (32s on average) than the intended path. C) Path-cluster N→S.1 shows mostly intended behavior (466 trajectories). D) Path-cluster N→S.3 shows not intended behavior because cyclists move onto the cross-walk, presumably due to lack of queuing space (56 trajectories). E) Path-cluster N→S.5 shows not intended behavior, crossing diagonally (29 trajectories). F) Path-cluster N→S.6 shows not intended behavior, crossing via the NE corner instead of the SW corner (25 trajectories). G-H) Path-clusters N→S.13 and N→S.12 show not intended behavior, entering street space that is intended for cars only, possibly due to uninterrupted travel or confusion (3 and 1 trajectories, respectively).

Apart from OD-cluster-specific issues, we also counted 12 trajectories from several OD-clusters that enter the wrong – vehicles-only – side on the southern street like in Fig. 3G,H. Although the fraction of these trajectories is small, they represent potentially dangerous situations where cyclists are traversing three vehicular lanes.

We have shown that our mostly automated method can well support the behavioral analysis of a large number of cyclists, and it has quantified a non-negligible number of at least 495 not intended, potentially life-threatening trajectories – all happening in just one hour. It is an open question whether our method can be generalized and fully automatized, and how the quality of analysis compares to manual methods. In the future, every step of our computational pipeline should be scrutinized to ensure high trajectory quality. In particular, bias could have been introduced by lost trajectories from occlusion or tracking errors in specific parts of the study area. In any case, we expect our method to scale better and to be less costly.

For the upcoming re-design of the Dybbølsbro intersection, consultants have considered traffic counts from video analysis and qualitative assessment of behavior, but without quantifying desire lines (WSP DANMARK A/S 2021). A repeated evaluation with our method after implementation could provide an assessment of the re-design’s success rate, and whether a more profound analysis or re-design is called for. Our results confirm the intentions of the re-design (WSP DANMARK A/S 2021) that intersection complexity should be lowered and the momentum and smooth wayfinding for cyclists should be respected, as also found in previous research from Spain (Lind, Honey-Rosés, and Corbera 2020), the Netherlands (Hahn and te Brömmelstroet 2021), Canada (Nabavi Niaki, Saunier, and Miranda-Moreno 2019), and Denmark (Colville-Andersen et al. 2013). However, the mixing of a bidirectional lane with unidirectional lanes remains particularly problematic (Lind, Honey-Rosés, and Corbera 2020), as does the lack of queuing space and protection for cyclists (Gemeente Amsterdam 2018; NACTO 2014).

The underlying issue is the prioritization of vehicular traffic flow in Danish street design, which persists despite successful efforts at improving cycling (Nielsen, Skov-Petersen, and Agervig Carstensen 2013; Colville-Andersen 2017; Colville-Andersen et al. 2013; Szell 2018). As we have shown, this priority leads to additional interruptions for cyclists, forcing traffic violations and competition with pedestrian space. Due to the skewed threat posed by vehicular traffic (Verkade and te Brömmelstroet 2019; Klanjčić et al. 2022), such violations are most hazardous to the cyclists themselves. Following research and best practices in road safety (Aldred et al. 2018; Marshall and Ferenchak 2019; Hartmann and Abel 2020; Branion-Calles et al. 2020; Nieuwenhuijsen 2020; WHO 2022), the acceptable level of vehicular traffic flow should be well justified. If this level is above zero, known effective solutions can include transformation of vehicular space into more queuing space, drastic speed reductions with possible removal of traffic lights, or similar improvements (Hahn and te Brömmelstroet 2021; NACTO 2014; Gemeente Amsterdam 2018). However, such considerations are not part of the upcoming re-design where car traffic cannot be obstructed (WSP DANMARK A/S 2021). It is an open research question why that is the case (Mattioli et al. 2020; Gössling 2020), given the projected increase of cycling (WSP DANMARK A/S 2021), and that the private car is the most hazardous (Cantuaria et al. 2021; Klanjčić et al. 2022), unsustainable (Banister 2005), and societally uneconomic (Gössling et al. 2019) mode of urban transport.


Acknowledgments

This study was supported by the Danish Ministry of Transport. We thank RAW Mobility for video capture, the NERDS group (especially Ane Rahbek Vierø and Anastassia Vybornova) and Marco te Brömmelstroet for helpful discussions, and ITU’s HPC for computational support.

Submitted: November 05, 2022 AEST

Accepted: November 26, 2022 AEST

References

Aldred, Rachel, Anna Goodman, John Gulliver, and James Woodcock. 2018. “Cycling Injury Risk in London: A Case-Control Study Exploring the Impact of Cycle Volumes, Motor Vehicle Volumes, and Road Characteristics Including Speed Limits.” Accident Analysis & Prevention 117 (August):75–84. https:/​/​doi.org/​10.1016/​j.aap.2018.03.003.
Google ScholarPubMed CentralPubMed
Bahrololoom, Sareh, William Young, and David Logan. 2020. “Modelling Injury Severity of Bicyclists in Bicycle-Car Crashes at Intersections.” Accident Analysis & Prevention 144 (September):105597. https:/​/​doi.org/​10.1016/​j.aap.2020.105597.
Google Scholar
Banister, David. 2005. Unsustainable Transport: City Transport in the New Century. Routledge. https:/​/​doi.org/​10.4324/​9780203003886.
Google Scholar
Branion-Calles, Michael, Thomas Götschi, Trisalyn Nelson, Esther Anaya-Boig, Ione Avila-Palencia, Alberto Castro, Tom Cole-Hunter, et al. 2020. “Cyclist Crash Rates and Risk Factors in a Prospective Cohort in Seven European Cities.” Accident Analysis & Prevention 141 (June):105540. https:/​/​doi.org/​10.1016/​j.aap.2020.105540.
Google Scholar
Cantuaria, Manuella Lech, Frans Boch Waldorff, Lene Wermuth, Ellen Raben Pedersen, Aslak Harbo Poulsen, Jesse Daniel Thacher, Ole Raaschou-Nielsen, et al. 2021. “Residential Exposure to Transportation Noise in Denmark and Incidence of Dementia: National Cohort Study.” Bmj 374 (September):n1954. https:/​/​doi.org/​10.1136/​bmj.n1954.
Google ScholarPubMed CentralPubMed
Casello, Jeffrey M., Adam Fraser, Alex Mereu, and Pedram Fard. 2017. “Enhancing Cycling Safety at Signalized Intersections: Analysis of Observed Behavior.” Transportation Research Record: Journal of the Transportation Research Board 2662 (1): 59–66. https:/​/​doi.org/​10.3141/​2662-07.
Google Scholar
Colville-Andersen, M. 2017. “Arrogance of Space - Copenhagen - Hans Christian Andersen Boulevard [Copenhagenize].” 2017. http:/​/​www.copenhagenize.com/​2017/​05/​arrogance-ofspace-copenhagen-hans.html.
Colville-Andersen, M., P. Madruga, R. Kjuanpää, and K. Maddox. 2013. “The Bicycle Choreography of an Urban Intersection.” In Desire Lines & Behaviour of Copenhagen Bicycle Users. Frederiksberg, Denmark: Copenhagenize Design Co.
Google Scholar
Dozza, Marco, and Julia Werneke. 2014. “Introducing Naturalistic Cycling Data: What Factors Influence Bicyclists’ Safety in the Real World?” Transportation Research Part F: Traffic Psychology and Behaviour 24 (May):83–91. https:/​/​doi.org/​10.1016/​j.trf.2014.04.001.
Google Scholar
Gemeente Amsterdam. 2018. “Plan Amsterdam - Giving Way to Cyclists.” (Tech. rep.). https:/​/​handshakecycling.eu/​resources/​plan-amsterdam-giving-way-cyclists.
Gössling, Stefan. 2020. “Why Cities Need to Take Road Space from Cars - and How This Could Be Done.” Journal of Urban Design 25 (4): 443–48. https:/​/​doi.org/​10.1080/​13574809.2020.1727318.
Google Scholar
Gössling, Stefan, Andy Choi, Kaely Dekker, and Daniel Metzler. 2019. “The Social Cost of Automobility, Cycling and Walking in the European Union.” Ecological Economics 158 (April):65–74. https:/​/​doi.org/​10.1016/​j.ecolecon.2018.12.016.
Google Scholar
Götschi, Thomas, Alberto Castro, Manja Deforth, Luis Miranda-Moreno, and Sohail Zangenehpour. 2018. “Towards a Comprehensive Safety Evaluation of Cycling Infrastructure Including Objective and Subjective Measures.” Journal of Transport & Health 8 (March):44–54. https:/​/​doi.org/​10.1016/​j.jth.2017.12.003.
Google Scholar
Hahn, Trey, and Marco te Brömmelstroet. 2021. “Collaboration, Experimentation, Continuous Improvement: Exploring an Iterative Way of Working in the Municipality of Amsterdam’s Bicycle Program.” Transportation Research Interdisciplinary Perspectives 9 (March):100289. https:/​/​doi.org/​10.1016/​j.trip.2020.100289.
Google Scholar
Hartmann, A., and S. Abel. 2020. “How Oslo Achieved Zero.” Ite Journal, 32–38.
Google Scholar
Hunter, L. 2021. “Local Round-up: City Planners Rethink Problematic Fisketorvet Junction – Again! CPH Post.” 2021. https:/​/​cphpost.dk/​?p=123482.
Klanjčić, Marina, Laetitia Gauvin, Michele Tizzoni, and Michael Szell. 2022. “Identifying Urban Features for Vulnerable Road User Safety in Europe.” EPJ Data Science 11 (1). https:/​/​doi.org/​10.1140/​epjds/​s13688-022-00339-5.
Google Scholar
Larsen, Jonas, and Oskar Funk. 2017. “Inhabiting Infrastructures: The Case of Cycling in Copenhagen.” Experiencing Networked Urban Mobilities, October, 129–34. https:/​/​doi.org/​10.4324/​9781315200255-23.
Google Scholar
Lind, Adam, Jordi Honey-Rosés, and Esteve Corbera. 2020. “Rule Compliance and Desire Lines in Barcelona’s Cycling Network.” Transportation Letters 13 (10): 728–37. https:/​/​doi.org/​10.1080/​19427867.2020.1803542.
Google Scholar
Ling, Rebecca, Linda Rothman, Marie-Soleil Cloutier, Colin Macarthur, and Andrew Howard. 2020. “Cyclist-Motor Vehicle Collisions before and after Implementation of Cycle Tracks in Toronto, Canada.” Accident Analysis & Prevention 135 (February):105360. https:/​/​doi.org/​10.1016/​j.aap.2019.105360.
Google Scholar
Marshall, Wesley E., and Nicholas N. Ferenchak. 2019. “Why Cities with High Bicycling Rates Are Safer for All Road Users.” Journal of Transport & Health 13 (June):100539. https:/​/​doi.org/​10.1016/​j.jth.2019.03.004.
Google Scholar
Mattioli, Giulio, Cameron Roberts, Julia K. Steinberger, and Andrew Brown. 2020. “The Political Economy of Car Dependence: A Systems of Provision Approach.” Energy Research & Social Science 66 (August):101486. https:/​/​doi.org/​10.1016/​j.erss.2020.101486.
Google Scholar
Nabavi Niaki, Matin S., Nicolas Saunier, and Luis F. Miranda-Moreno. 2019. “Is That Move Safe? Case Study of Cyclist Movements at Intersections with Cycling Discontinuities.” Accident Analysis & Prevention 131 (October):239–47. https:/​/​doi.org/​10.1016/​j.aap.2019.07.006.
Google Scholar
NACTO. 2014. Urban Bikeway Design Guide. Island Press.
Google Scholar
Nielsen, Thomas A. Sick, Hans Skov-Petersen, and Trine Agervig Carstensen. 2013. “Urban Planning Practices for Bikeable Cities – the Case of Copenhagen.” Urban Research & Practice 6 (1): 110–15. https:/​/​doi.org/​10.1080/​17535069.2013.765108.
Google Scholar
Nieuwenhuijsen, Mark J. 2020. “Urban and Transport Planning Pathways to Carbon Neutral, Liveable and Healthy Cities; a Review of the Current Evidence.” Environment International 140 (July):105661. https:/​/​doi.org/​10.1016/​j.envint.2020.105661.
Google Scholar
Szell, Michael. 2018. “Crowdsourced Quantification and Visualization of Urban Mobility Space Inequality.” Urban Planning 3 (1): 1–20. https:/​/​doi.org/​10.17645/​up.v3i1.1209.
Google Scholar
te Brömmelstroet, M. 2014. De choreografie van een kruispunt: Naar een gebruiksgeorienteerde ontwerplogica voor kruispunten. Colloquium Vervoersplanologisch Speurwerk.
Google Scholar
Therkildsen, C. 2021. “Omstridt og berygtet lyskryds f ̊ar løsning, der aldrig før er set i danmark.” TV 2 Lorry. 2021. https:/​/​www.tv2lorry.dk/​koebenhavn/​omstridt-og-berygtet-lyskryds-faar-loesning-der-aldrig-foer-er-set-i-danmark.
Verkade, T., and M. te Brömmelstroet. 2019. “Het grootste taboe in het verkeer: We kunnen elkaar doodrijden.” De Correspondent. https:/​/​decorrespondent.nl/​9156/​het-grootstetaboe-in-het-verkeer-we-kunnen-elkaar-doodrijden/​3738007565292-e9168246.
Google Scholar
WHO. 2022. Walking and Cycling: Latest Evidence to Support Policy-Making and Practice.
Google Scholar
Winters, Meghan, Ralph Buehler, and Thomas Götschi. 2017. “Policies to Promote Active Travel: Evidence from Reviews of the Literature.” Current Environmental Health Reports 4 (3): 278–85. https:/​/​doi.org/​10.1007/​s40572-017-0148-x.
Google Scholar
WSP DANMARK A/S. 2021. “Dobbeltrettet cykelsti i krydset ingerslevsgade-dybbølsbro, dispositionsforslag.” (Tech. rep.). https:/​/​vesterbrolokaludvalg.kk.dk/​sites/​default/​files/​2022-05/​DispositionsforslagNo.pdf.

This website uses cookies

We use cookies to enhance your experience and support COUNTER Metrics for transparent reporting of readership statistics. Cookie data is not sold to third parties or used for marketing purposes.

Powered by Scholastica, the modern academic journal management system