Loading [Contrib]/a11y/accessibility-menu.js
Skip to main content
null
Findings
  • Menu
  • Articles
    • Energy Findings
    • Resilience Findings
    • Safety Findings
    • Transport Findings
    • Urban Findings
    • All
  • For Authors
  • Editorial Board
  • About
  • Blog
  • covid-19
  • search

RSS Feed

Enter the URL below into your favorite RSS reader.

http://localhost:24995/feed
Transport Findings
November 16, 2022 AEST

Exploring Key Correlates of Trail Satisfaction and their Nonlinear Relationships in Suburban Areas

Jasmine Cao, Chun Yin,
trail planningsatisfaction surveymachine learningthree-factor theoryimportance-performance analysis
Copyright Logoccby-sa-4.0 • https://doi.org/10.32866/001c.53105
Findings
Cao, Jasmine, and Chun Yin. 2022. “Exploring Key Correlates of Trail Satisfaction and Their Nonlinear Relationships in Suburban Areas.” Findings, November. https:/​/​doi.org/​10.32866/​001c.53105.
Save article as...▾
Download all (2)
  • Figure 1. The predicted relationships between trail elements and overall satisfaction
    Download
  • Figure 2. Importance-Performance (Perception) Analysis
    Download

Sorry, something went wrong. Please try again.

If this problem reoccurs, please contact Scholastica Support

Error message:

undefined

View more stats

Abstract

Using data collected from trail users in Woodbury, MN, this study applies gradient-boosting decision trees to explore the nonlinear associations between trail elements and user overall satisfaction. Scenery, personal safety, and connection are the most important contributors to overall satisfaction. Several trail elements show nonlinear effects on overall satisfaction. Specifically, bumps and lighting greatly affect overall satisfaction when their performance is poor, whereas personal safety, home access to trails, and shade improve overall satisfaction when performing well. The results also showed that the city should prioritize improvements on bumps, lighting, roadway crossing, safety, and access to enhance user satisfaction effectively.

1. Questions

Planning practitioners are interested in identifying influential contributors to user satisfaction with trails and improvement priorities to satisfy trail users. Due to the risk of COVID-19 exposure in gyms and fitness centers, there has been an influx of people on city trails and sidewalks (Ma et al. 2022), particularly in low-density areas (Zhang and Fricker 2021). This behavioral change is positively associated with people’s mental health and community cohesion (Ma et al. 2022). To attract more users to trails, the city must eliminate or decrease the influence of key disturbing elements on user satisfaction. Therefore, exploring the factors driving user satisfaction is essential to trail planning.

From a theoretical perspective, previous studies often assume that transportation infrastructure attributes have a linear relationship with satisfaction with the infrastructure, and apply linear models to examine the correlates of infrastructure satisfaction (Figler et al. 2011; Wan et al. 2016). However, recent studies have shown that the relationship could be nonlinear (Abenoza, Cats, and Susilo 2019; Dong et al. 2019). If true, the linear assumption may bias the results and offer a flawed understanding of the relationships.

This study employs the gradient boosting decision trees (GBDT) approach to examine the relationships between users’ perceptions of trail elements and their overall satisfaction with trails, using data from Woodbury, Minnesota. It aims to address the following questions:

  1. Which elements of the trails contribute the most to overall satisfaction?

  2. Do the elements have nonlinear associations with overall satisfaction?

  3. Which elements should be prioritized for improvement?

2. Methods

The data come from a self-administered survey conducted in Woodbury in August 2022. The suburban city is in the east of the Minneapolis-St. Paul metropolitan area, USA. It is one of the higher-income cities in the metropolitan area. The key components of the survey include trail elements and overall satisfaction with trails. An initial list of trail elements was developed by reviewing literature (e.g., Lukoseviciute, Pereira, and Panagopoulos 2021; Oktaviani and Saudi 2020), taking field interviews of trail users, and referencing the Woodbury Bicycle and Pedestrian Plan (City of Woodbury 2022). The list was then reviewed by Tony Kutzke, City Engineer, and narrowed down to ten elements. The survey was offered in a paper-based format for an immediate in-person response and an electronic format for users unavailable at the time of encounter. The first author led a team of six students to conduct intercept surveys on several types of trails throughout Woodbury, including principal corridors, local connectors, neighborhood streets, commercial areas, and parks. We recruited respondents from 6 am to 9 pm on both weekdays and weekends. Most of the respondents were recruited in the evenings when the trails were frequently used. No incentives were used. The response rate was at about 70-80%.

The sample includes 413 respondents. Table 1 shows that about 2/3 of the respondents used the trails at least once per week. Recreation was the dominant trip purpose, consistent with the finding in the Woodbury Bicycle and Pedestrian Plan. Among the ten trail elements, respondents perceived vegetation/scenery and connection the best, and perceived bumps/cracks/water collection (i.e., puddles) and lighting the worst (Table 2).

Table 1.Summary of trail user behavior
Variables   # observations Shares
Trail use frequency 413  
Less than once per month 15.5
1-3 times per month 16.7
Once per week 9.0
2-4 times per week 28.8
  5 or more time per week   30.0
Trail use purpose 404
Recreation 93.6
Commuting to work/school 2.2
Shopping and other destinations 4.2
Trail use mode 402  
Walking 85.6
Jogging/running 6.7
  Biking   7.7
Table 2.Perceptions of trail elements and overall satisfaction
Variables Statements Mean* Ranking
Scenery The trails have plenty of vegetation and good scenery. 4.13 1
Connection The trails connect me to where I want to go. 4.05 2
Crossing I feel comfortable crossing intersections. 3.89 3
Access** The trails are not easy to access from my home. 3.76 4
Safety** I worry about my personal safety. 3.73 5
Shade There is enough shade along the trails. 3.73 6
Garbage** I can see garbage and animal feces or smell unpleasant scents. 3.59 7
Signage There are effective signs I can use to find my routes between the trails. 3.36 8
Bump** There are noticeable bumps, cracks, and water collection on the trail. 2.59 9
Lighting** Trails are lacking lighting at night. 2.39 10
Overall Overall, I am satisfied with the trail system in Woodbury. 4.10  

* In the survey, respondents were asked to indicate the extent to which they agree or disagree with each of the statements on a five-point scale from “strongly disagree” (1) to “strongly agree” (5).
** These statements were asked in a negative tone. Their scores have been reversed to represent positive perceptions.

The GBDT approach in the R-based “gbm” package (Ridgeway 2020) was used to explore the associations of perceived trail elements with overall satisfaction. It is superior to linear regression when dealing with satisfaction data (Cao and Wu 2019). First, data are not required to follow a certain distribution, a useful feature because the histograms of satisfaction variables often have a long left-hand tail. Second, the approach can efficiently uncover nonlinear relationships between variables, providing nuanced implications for trail planning.

3. Findings

The model results in Table 3 show that among the ten trail elements, scenery is the most important predictor of overall satisfaction. This variable accounts for almost a quarter of all the predictive power. This makes sense because of the recreational purpose of trail users. Personal safety and connection are also crucial to overall satisfaction. By contrast, signage and trail sanitation are the least important ones. Accordingly, they are omitted from the remaining discussion.

Table 3.The importance of trail elements in predicting overall satisfaction
Variables Relative Importance Ranking
Scenery 24.8 1
Safety*  17.9 2
Connection 13.4 3
Access* 10.6 4
Crossing 9.8 5
Bump* 7.4 6
Shade 5.9 7
Lighting*  5.6 8
Signage 2.4 9
Garbage* 2.2 10
Pseudo R2 0.47  
Number of trees 2553
# observations 406  

Notes: Key parameters: Distribution: Gaussian; Learning rate =0.01; Depth = 5; Minimum number of observations in a node = 5; 5-fold cross-validation.
The relative importance of a variable measures its contribution to reducing the loss function, relative to all other variables in the model. All the relative importance adds up to 100%.
* These variables were derived from negatively framed statements (See Table 2). Their scores have been reversed to represent positive perceptions.

Figure 1 presents partial dependent plots (PDPs) of the remaining eight trail elements, i.e., their associations with predicted overall satisfaction. Some elements show nonlinear relationships with overall satisfaction. In general, the shapes of the associations can be grouped into three types. First, Figure 1 (a) and (b) show that when bumps and lighting perform poorly (lower than the neutral scale 3), they have a substantial effect on overall satisfaction, but when they perform well, their impacts are diminishing. According to the three-factor theory of consumer satisfaction (Matzler, Sauerwein, and Heischmidt 2003), service elements can be classified into basic, excitement, and performance factors. Basic factors cause dissatisfaction if their performance is low, but their contributions to satisfaction are marginal if their performance is high. Therefore, bumps and lighting should be regarded as basic factors. Second, Figure 1 (c), (d), and (e) illustrate that when safety, access, and shade perform poorly, they have limited adverse effects on overall satisfaction, but when they perform well (Scales 4 and/or 5), user satisfaction experiences an exponential increase. Because excitement factors will not reduce satisfaction when their performance is low but will improve satisfaction substantially if their performance is high, the three elements should be regarded as excitement factors. Third, as scenery, connection, and crossing perceptions grow, user satisfaction has a roughly linear increase (Figure 1 (f), (g), and (h)). Because performance factors are linearly related to satisfaction, the three elements should be classified as performance factors.

Figure 1
Figure 1.The predicted relationships between trail elements and overall satisfaction

Notes: a. the nonlinearity in (g) and (h) may be due to the inadequate number of observations at Scale 1.
b. bump, lighting, safety, and access were derived from negatively framed statements (See Table 2). Their scores have been reversed to represent positive perceptions.

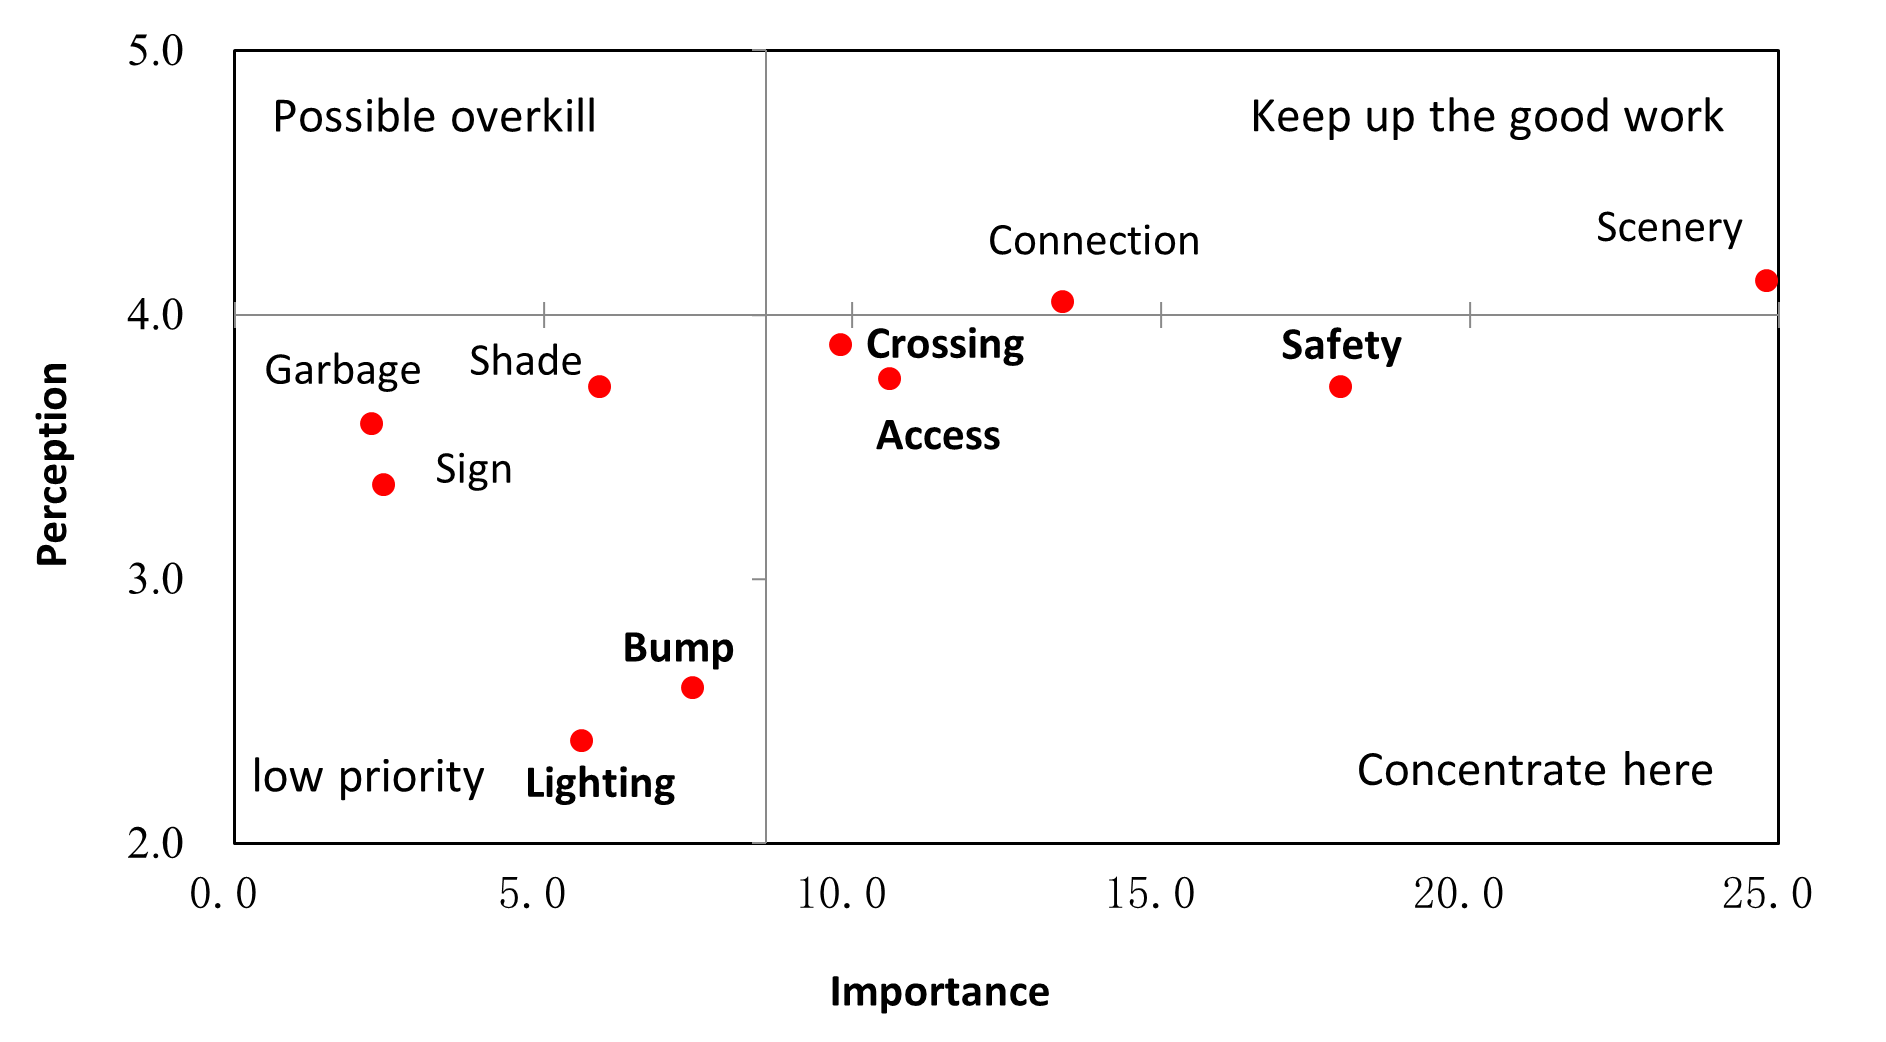
Figure 2 presents the results of an importance-performance analysis. Safety, home access to trails, and roadway crossing fall into Quadrant IV, where the attributes are important to the formation of overall satisfaction, but their performance is mediocre (Azzopardi and Nash 2013). Therefore, they need to be considered for improvement. Furthermore, the perceptions of bumps and lighting are lower than the neutral scale. That is, they have sub-standard performance. More importantly, they are poorly performed basic factors that are detrimental to overall satisfaction. Therefore, they should be prioritized for enhancement (Matzler, Sauerwein, and Heischmidt 2003). These findings are congruent with respondents’ open-ended comments, in which more lights, better paved roads, and safer crosswalks were the most frequently mentioned.

Figure 2
Figure 2.Importance-Performance (Perception) Analysis

Notes: a. the median of all the relative importance was used as the importance threshold. Because the trail system is a featured characteristic of Woodbury, city engineers regard Scale 4 as the acceptable level. Therefore, the scale was used as the performance threshold.
b. bump, lighting, garage, safety, and access were derived from negatively framed statements (See Table 2). Their scores have been reversed to represent positive perceptions.

The nonlinear factor structure shown in Figure 1 has implications for trail improvement. Because when performing well, bumps and lighting have limited effects on overall satisfaction, it is more efficient to enhance them to the neutral level (3). By contrast, safety and access improve overall satisfaction when performing well. It is desirable to let them far exceed user expectation. These nuances on trail element improvement differ from what a linear relationship implies.


Acknowledgements

Mr. Tony Kutzke, City Engineer of Woodbury, offered critical suggestions and feedback to study design and research findings. He invited the research team to present this study to the staff of Woodbury Department of Public Works. Dr. Jason Cao, University of Minnesota, Twin Cities, offered suggestions on research design. Data collection was administered by Jasmine Cao (team lead), Pilar Andruet, Tessa Campbell, Paige Lecuyer, Jesseree Reyes, and Anika Tripathi of Woodbury High School.

Submitted: September 19, 2022 AEST

Accepted: November 08, 2022 AEST

References

Abenoza, Roberto F., Oded Cats, and Yusak O. Susilo. 2019. “Determinants of Traveler Satisfaction: Evidence for Non-Linear and Asymmetric Effects.” Transportation Research Part F: Traffic Psychology and Behaviour 66:339–56. https:/​/​doi.org/​10.1016/​j.trf.2019.09.009.
Google Scholar
Azzopardi, Ernest, and Robert Nash. 2013. “A Critical Evaluation of Importance–Performance Analysis.” Tourism Management 35:222–33. https:/​/​doi.org/​10.1016/​j.tourman.2012.07.007.
Google Scholar
Cao, Jason, and Xinyi Wu. 2019. “Exploring the Importance of Transportation Infrastructure and Accessibility to Satisfaction with Urban and Suburban Neighborhoods: An Application of Gradient Boosting Decision Trees.” Transport Findings February:1–7. https:/​/​doi.org/​10.32866/​7209.
Google Scholar
City of Woodbury. 2022. “Bicycle and Pedestrian Plan.” https:/​/​www.woodburymn.gov/​233/​Bicycle-and-Pedestrian-Plan.
Dong, Wei, Xinyu Cao, Xinyi Wu, and Yu Dong. 2019. “Examining Pedestrian Satisfaction in Gated and Open Communities: An Integration of Gradient Boosting Decision Trees and Impact-Asymmetry Analysis.” Landscape and Urban Planning 185:246–57. https:/​/​doi.org/​10.1016/​j.landurbplan.2019.02.012.
Google Scholar
Figler, Scott A., P. S. Sriraj, Eric W. Welch, and Nilay Yavuz. 2011. “Customer Loyalty and Chicago, Illinois, Transit Authority Buses: Results from 2008 Customer Satisfaction Survey.” Transportation Research Record: Journal of the Transportation Research Board 2216 (1): 148–56. https:/​/​doi.org/​10.3141/​2216-16.
Google Scholar
Lukoseviciute, Goda, Luís Nobre Pereira, and Thomas Panagopoulos. 2021. “Sustainable Recreational Trail Design from the Recreational Opportunity Spectrum and Trail User Perception: A Case Study of the Seven Hanging Valleys.” Journal of Ecotourism, 1–22. https:/​/​doi.org/​10.1080/​14724049.2021.2004153.
Google Scholar
Ma, Liang, Yage Liu, Jason Cao, and Runing Ye. 2022. “The Impact of Perceived Racism on Walking Behavior during the COVID-19 Lockdown.” Transportation Research Part D: Transport and Environment 109:103335. https:/​/​doi.org/​10.1016/​j.trd.2022.103335.
Google ScholarPubMed CentralPubMed
Matzler, Kurt, Elmar Sauerwein, and Kenneth Heischmidt. 2003. “Importance-Performance Analysis Revisited: The Role of the Factor Structure of Customer Satisfaction.” The Service Industries Journal 23 (2): 112–29. https:/​/​doi.org/​10.1080/​02642060412331300912.
Google Scholar
Oktaviani, Desy, and Mohd Haizam Saudi. 2020. “Analysis of Tourism Perception Using the Importance Performance Analysis Method Toward Jayagiri Hiking Trail Bandung.” Solid State Technology 63 (3): 4009–18.
Google Scholar
Ridgeway, Greg. 2020. Generalized Boosted Models: A guide to the gbm package. https:/​/​cran.r-project.org/​web/​packages/​gbm/​vignettes/​gbm.pdf.
Google Scholar
Wan, Dan, Camille Kamga, Jun Liu, Aaron Sugiura, and Eric B. Beaton. 2016. “Rider Perception of a ‘Light’ Bus Rapid Transit System - The New York City Select Bus Service.” Transport Policy 49:41–55. https:/​/​doi.org/​10.1016/​j.tranpol.2016.04.001.
Google Scholar
Zhang, Yunchang, and Jon D. Fricker. 2021. “Quantifying the Impact of COVID-19 on Non-Motorized Transportation: A Bayesian Structural Time Series Model.” Transport Policy 103:11–20. https:/​/​doi.org/​10.1016/​j.tranpol.2021.01.013.
Google Scholar

This website uses cookies

We use cookies to enhance your experience and support COUNTER Metrics for transparent reporting of readership statistics. Cookie data is not sold to third parties or used for marketing purposes.

Powered by Scholastica, the modern academic journal management system