

1. Questions
Transportation network is a critical infrastructure and a community lifeline in the U.S. that is essential for keeping cities operational at all times (Platt 1991; FEMA, n.d.). However, disruptions caused by catastrophic events like hurricanes and floods, the frequency of which have increased owing to climate change, to these networks can impact economic activities (Coronese et al. 2019) and social well-being of any location. The resilience of a transportation network depends on its ability to recover from a disruption to its pre-disruption operational level in a timely manner (Pinzan et al. 2018). A resilient network should also be composed of more connections enabling the use of alternative routes to enable faster recovery of communities following an extreme event, (Rodrigue, Comtois, and Slack 2016). Using Hurricane Sandy (2012) as a case study, we examined how trip times varied based on social vulnerability index (SVI) (Flanagan et al. 2011) before and after Hurricane Sandy made landfall on October 29th, 2012, along the New Jersey coast which contributed to the shutting down of public transit systems due to flooding and heavy wind. Using taxi trajectory data, we examined the relationship between socioeconomic characteristics of populations within Origin-Destination (OD) zones and corresponding mobility patterns. We hypothesize that areas which have high vulnerability owing to social disadvantage experienced longer trip times during hurricane Sandy owing to disruptions to existing transportation networks as a consequence of flooding.
2. Methods
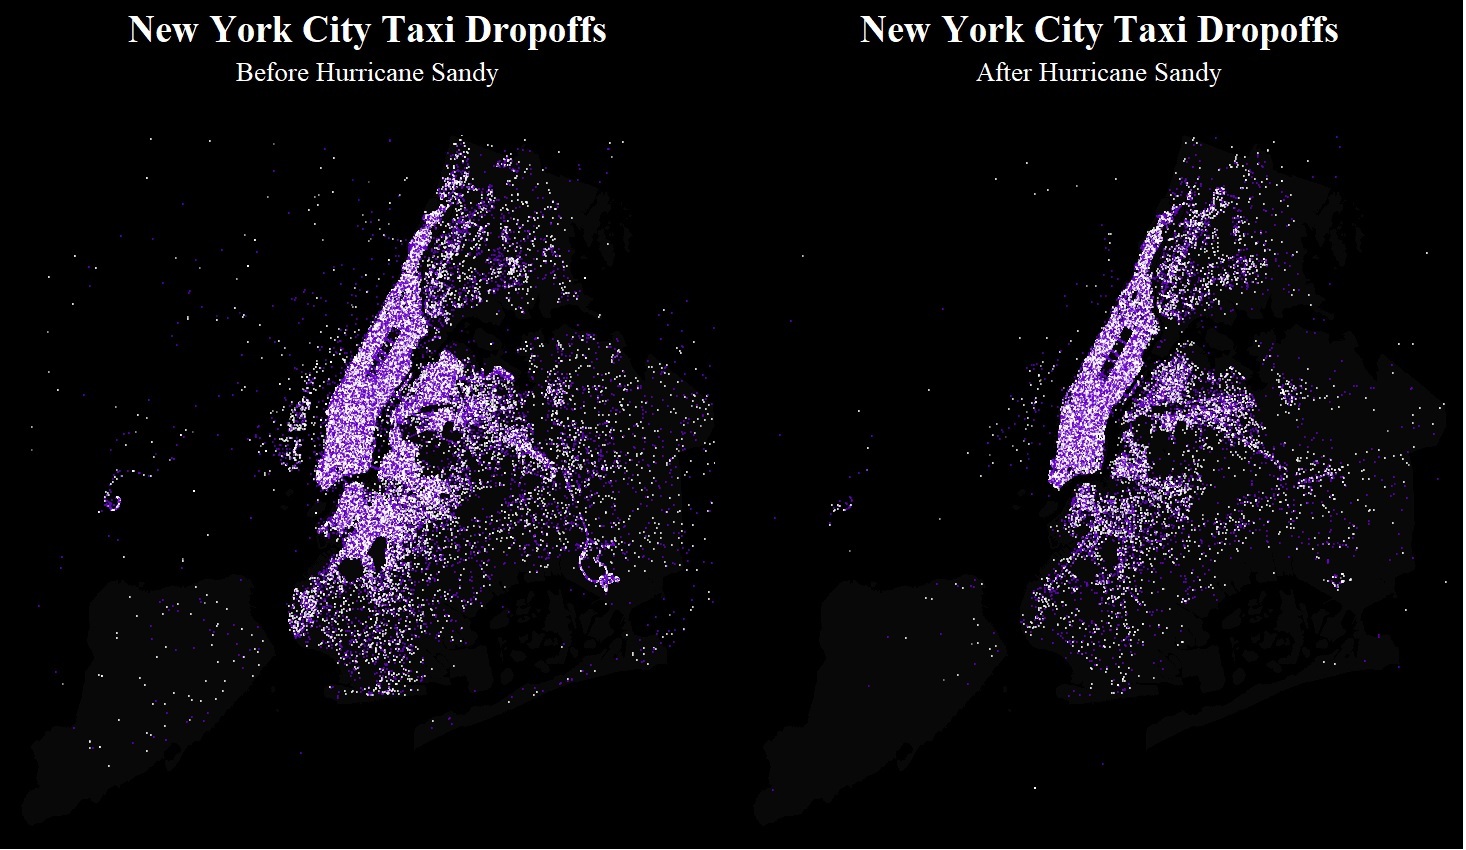
We acquired taxi trajectory data containing 14.5 million taxi trips (Figure 1) two weeks before and after Hurricane Sandy (NYC Open Data 2012) along with 263 taxi zones in NYC which served as origin and destination zones. The taxi trajectories were grouped into OD pairs based on pickup and drop-off locations falling within a specific taxi zone. Figure 1 depicts the spatial distribution of drop-off locations within NYC before and after Hurricane Sandy. We aggregated total trip times between OD zones to determine the spatial distribution of travel times per taxi zone and extracted the number of trips and average trip distances within the OD zones. Finally, we examined the relationship between trip characteristics and social vulnerability index (Flanagan et al. 2011) using geographically weighted regression (GWR) (Brunsdon, Fotheringham, and Charlton 1998). The difference between trip times in minutes (before and after the hurricane) was used as the dependent variable to quantify high or low overall mobility in the study area w.r.t social vulnerability of the resident populations in addition to overall population density and median household income in each OD zone.
3. Findings
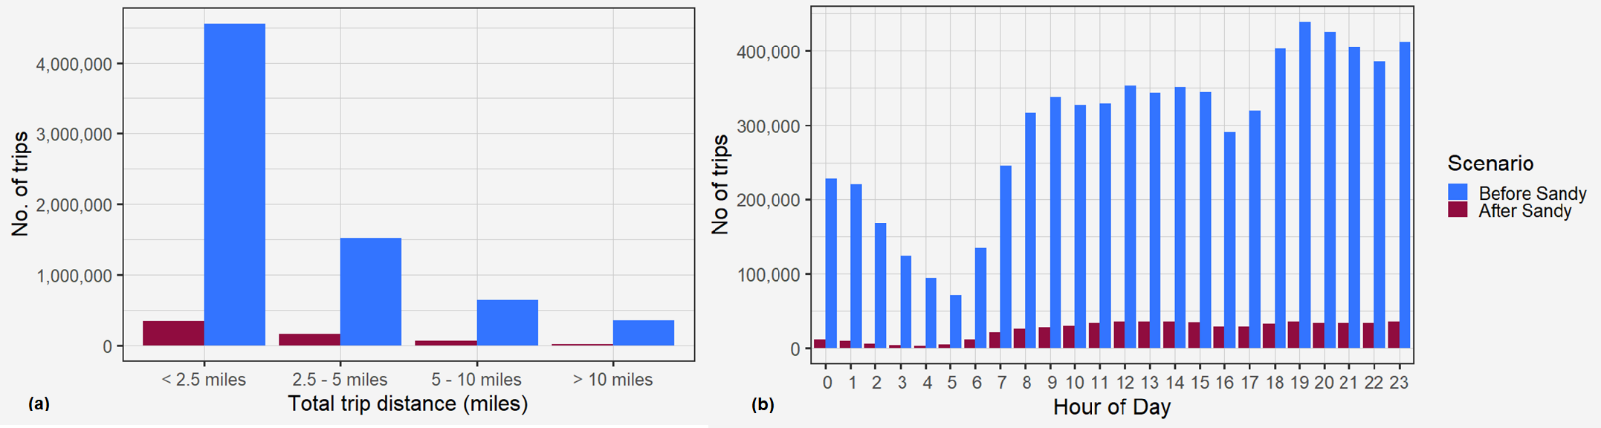
While the trips were distributed across the city before the hurricane, there was a sharp decline in trip distance following the hurricane (Figure 2a), In comparison to Figure 1, it appears that longer trips dropped in and around the city where the flooding was high. Before the hurricane, the trip distances across the city ranged between 3 - 5 miles from the city center during the period of the study (Figure 2a), but the distances dropped to 1 mile after landfall. The total number of trips reduced by nearly 67% after the hurricane (Figure 2b) over a period of 24 hours, and the longer trips (5 -10 miles) were reduced by 89.7% (Figure 2a), possibly due to the reduced transportation access because of flooding (Chen et al. 2015). Although Hurricane Sandy influenced trip characteristics, the social vulnerability was also found to influence mobility patterns (Table 1). GWR predictions were used to examine the local variability of the relationship between trip characteristics and SVI for each OD zone (Figure 3).
_total_distance_and_(b)_no._of_taxi_trips_before_and_after_hurricane_s.png)

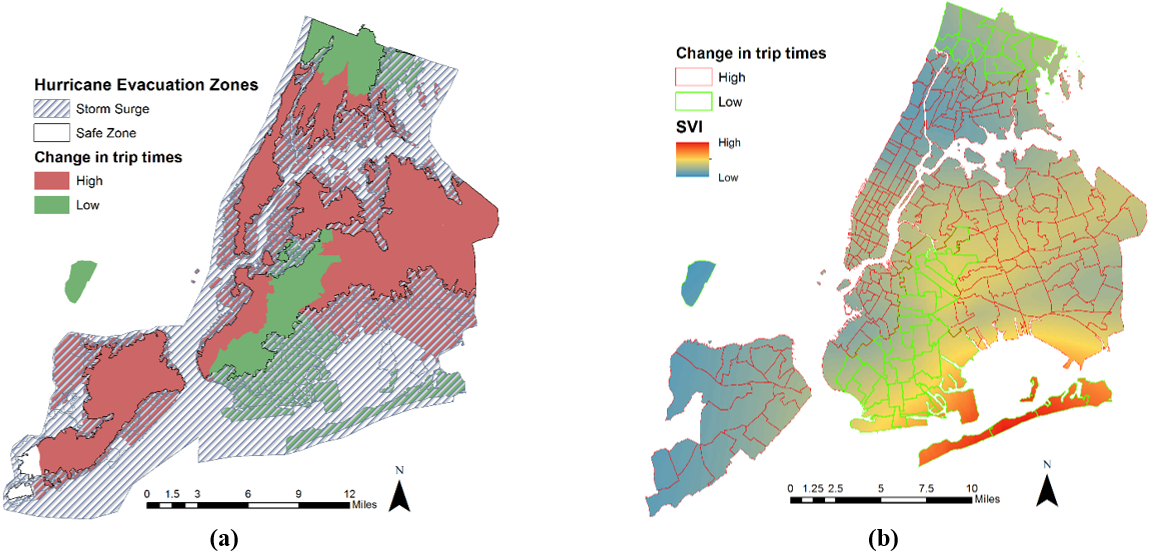
Independent variables were tested for multicollinearity and used to predict travel times using GWR (Table 1). Based on the change in standard residuals predicted by GWR before and after Hurricane Sandy occurred, the OD zones in New York City were classified into two categories (Figure 4). OD zones where the change in trip times was high (Figure 3) also had a higher proportion of low income areas contributing to increased vulnerability with low income and overlapped with the storm surge area (Figure 4).
_storm_surge_areas_.png)
These zones also have a high percentage of elderly population, low percent of rented households and high percent of very low-income population groups which contributed to an overall high social vulnerability index (SVI) value. The change in trip time is reduced significantly in areas with high SVI (Figure 4b) that lie in the storm surge zone (Figure 4a). Trip time increased in very few zones that are also present both in storm surge and safer zones, and these zones have medium to very low vulnerability.
The spatial distribution of changes in trip time aligns with low population density and high SVI in the southern part of the city around Queens (Figure 3). Low SVI areas have high changes in trip times also experience some increased trip times (Figure 4), but the eastern part of the city in and around the Queens area experienced increased trip times as the income in the area is quite low.
Lower income neighborhoods with high population density still showed either no change or a slight decrease as the trips in those zones were only within 2.5 miles. Overall, results indicate that OD zones with high density of populations that experience the burden of high vulnerability did not display any change in travel behavior as opposed to OD zones with low density of populations who were vulnerable where travel time decreased. The continuation of travel in low income neighborhoods could be because of their needs to commute to work-places, which continued after the hurricane as reported by Kaufman et al. (2012). The hurricane made some people stay at home. This reduced congestion in more affluent areas, and taxis moved faster which was not observed in more vulnerable neighborhoods. Such information about trips along with the methodology deployed here could be used by decision-makers for resource planning (e.g., evacuation, restoration and supply of food/water) as well as to assess vulnerability of transportation networks from usability and connectivity perspective.
Acknowledgments
This manuscript was supported in part by an appointment with the National Science Foundation (NSF) Mathematical Sciences Graduate Internship (MSGI) Program sponsored by the NSF Division of Mathematical Sciences. This program is administered by the Oak Ridge Institute for Science and Education (ORISE) through an interagency agreement between the U.S. Department of Energy (DOE) and NSF. ORISE is managed for DOE by ORAU. The work was completed during Bandana Kar’s tenure at Oak Ridge National Laboratory. The conclusions and opinions expressed in this article are those of the authors and do not reflect the policies or opinions of NSF, Oak Ridge National Laboratory, UT-Battelle, ORAU/ORISE, the U.S. Department of Energy, or the U.S. Government.