Loading [Contrib]/a11y/accessibility-menu.js
Findings
  • Menu
  • Articles
    • Resilience Findings
    • Transport Findings
    • Urban Findings
    • All
  • For Authors
  • Editorial Board
  • About
  • Blog
  • search

    Sorry, something went wrong. Please try your search again.
    ×

    • Articles
    • Blog posts

RSS Feed

Enter the URL below into your favorite RSS reader.

https://findingspress.org/feed
×
Transport Findings
February 15, 2019 AEST

Measuring the Effect of Private Transport Job Accessibility on Rents: The Case of San Francisco’s Tech Shuttles

Matthew Palm, Deb Niemeier,
rents commuter shuttles job accessibility
Copyright Logoccby-nc-4.0 • https://doi.org/10.32866/5100
Photo by Anthony DELANOIX on Unsplash
Findings
Palm, Matthew, and Deb Niemeier. 2019. “Measuring the Effect of Private Transport Job Accessibility on Rents: The Case of San Francisco’s Tech Shuttles.” Findings, February. https://doi.org/10.32866/5100.
Save article as...▾
  • PDF
  • XML
  • Citation (BibTeX)
Data Sets/Files (3)
Download all (3)
  • Table 1: Summary Statistics
    Download
  • Table 2: Regression Model Results Predicting Log Rent
    Download
  • Figure 1: Kernel Density Estimations by Sigma, Overlaid with Shuttle Stops
    Download

Sorry, something went wrong. Please try again.

If this problem reoccurs, please contact Scholastica Support

Error message:

undefined
×

View more stats

Abstract

We measure the effect of San Francisco’s technology firm commuter shuttles on rents utilizing a kernel density estimation approach. To model the effects of job accessibility improvements that the shuttles provide, we capture the influence of each shuttle stop in terms of the number of jobs that shuttle connects to in Silicon Valley and the market capitalization of the companies served. We compare these results to baseline models with simple distance measures. Our models identify a strong correlation between commuter shuttles and rents, suggesting that the effects of private shuttles can be anticipated without measuring the job accessibility gains they provide.

1. RESEARCH QUESTION AND HYPOTHESES

Public transportation infrastructure raises land values, as well as housing prices and rents (Mohammad et al. 2013; Zuk et al. 2015; Wardrip 2011). Most of this literature only considers light and heavy rail. Researchers typically operationalize the price effect of proximity to rail by measuring walking distance to the nearest station (Hess and Almeida 2007) or by taking into account the number of jobs accessible to a home within a given travel time by public transport (Kok, Monkkonen, and Quigley 2014). The effect of public bus systems on prices or rents is less clear (Zuk et al. 2015), although bus rapid transit is associated with rising rents (Brown 2016). Our research investigates whether a private shuttle system using public bus stops significantly affects rents.

We test this question on a case study of private commuter shuttle systems established by technology firms in San Francisco. Activists and researchers have linked the shuttles with rental evictions (Anti-Eviction Mapping Project 2013), but some regional leaders characterize the shuttles as mere symbols of public discontent with gentrification that cannot be linked directly to neighborhood rent increases (Metcalf 2013). We approach the problem by measuring the influence of the shuttles in terms of the employment accessibility they provide. If the effects of our job accessibility models are strongly positive, this would suggest private commuter shuttle systems’ effects on rents can be anticipated by considering the employment characteristics of the firms they serve. Our modeling will help clarify the extent to which the shuttles serve as causal drivers of rent increases due to their ability to increase job accessibility for tech firm employees.

Specifically, we hypothesize that:

  1. Proximity to a private commuter shuttle system is significantly and positively associated with rents, and

  2. Proximity measures that weigh the effect of commuter shuttles by tech company attributes, such as the jobs accessible through the shuttles and the market capitalization of the companies they serve, will provide greater explanatory power of predicted rents than unweighted measures.

2. METHODS AND DATA

We specify a hedonic regression model using rental listings data procured from Rent Jungle, Inc. Our unit of measurement is the shuttle stop. We identify the commuter shuttles’ stops using data from Stamen (Stamen Design 2012). Using public records on tech sector growth, we capture the number of jobs on corporate campuses accessible via each shuttle as well as the market capitalization of the companies the shuttles serve. We also assembled relevant building and neighborhood covariates, including jobs accessible within 45 minutes by public transport from the US Environmental Protection Agency’s Smart Location Database. We developed a set of “gentrification priors” to control for neighborhood changes underway between Census 2000 and the 2010–2014 American Community Survey wave. These variables include the change in the number of tech workers residing in the block group, median income, and the number of non-Hispanic, Caucasian residents (Table 1).

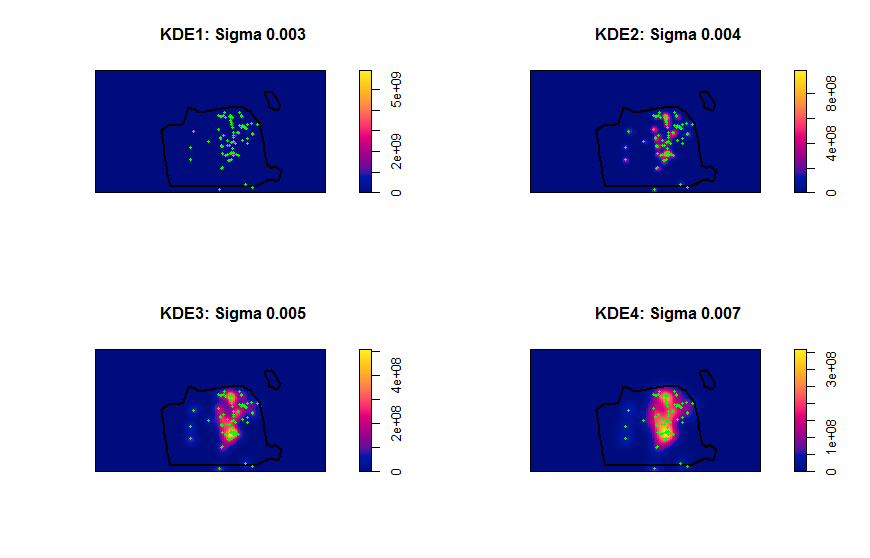
The shuttle stops used by the buses clustered together such that 44% of the rental listings within a kilometer of a shuttle stop were also within a kilometer of up to seven other shuttle stops. To account for the overlapping effects of these stops, we derived kernel density estimations (KDEs) of shuttle stop concentration. For robustness, we specified KDEs at four different bandwidths (Figure 1). For the jobs- and capital-weighted measures, we reproduced our KDEs at identical bandwidths, weighting each stop by the jobs accessible or market capital value represented by the companies.

3. FINDINGS

Our KDE estimates of commuter shuttle stop proximity are strongly associated with rents, whether they are unweighted or weighted by access to jobs or capital values. The R2 are slightly higher for models utilizing the jobs- and capital-weighted KDEs relative to our unweighted KDEs. Our fourth KDE model, which weights shuttle stops by company market capital value, delivers the highest explanatory power in terms of R-squared. Yet the model using a simple distance measure to the nearest shuttle stop achieves an almost identical adjusted R2. We conducted ANOVA tests comparing the models and found no significant differences between or across models. This means our models are effectively the same. We present full regression model results in Table 2.

We find that a unit’s rent is negatively associated with distance to the nearest shuttle stop, with rents declining an average of 1.8% for every additional 100 meters in distance away from a shuttle. The number of jobs within a 45-min transit trip is significantly and positively associated with rents; jobs within 45 min by automobile are not significant. The other model covariates are generally significant and in the anticipated directions of their influence on rents.

We reject the null for our first hypothesis. Our models show a positive and significant association between proximity to shuttle stop and rents. We fail to reject the null for our second hypothesis that the specification using employment-weighted shuttle proximity would have higher explanatory power than a simple distance measure. We found insignificant differences between our models with respect to predicting rents.

Table 1:Summary Statistics
Variable Minimum Median Mean Max Effect (Hypth.)
Log Monthly Rent ($) 6.21 7.99 8.02 9.90
Beds 0.00 2.00 1.79 7.00 +
Baths 0.00 1.00 1.30 6.00 +
Distance to Highway (km) 0.04 1.60 1.71 5.31 +
Unit Is Rent Controlled 0.00 1.00 0.87 1.00 -
Year Unit Built 1875 1927 1937 2014 +
Distance to Nearest Park (km) 0.01 0.64 0.68 2.21 +
Financial Quarters 15.00 18.00 17.78 20.00 -
Distance to Coast or Shore (km) 0.04 2.45 2.46 5.19 +
Block Group Median Income ($10,000s) 1.18 8.38 8.55 21.59 +
Number of Building Code Violations 0.00 0.00 0.66 44.00 -
Percent Change in Block Group White Population (2000–2014) -27.40 -7.70 -7.77 17.70 +
Change in Number of Professional, Technical, Scientific Resident workers (100s) -11.58 -0.80 -1.49 5.11 +
Change in Median Income 2000–2014 (1000s) -0.02 0.59 0.57 1.12 +
Jobs within a 45-min car commute (10,000s) 0.00 3.17 3.50 7.61 +
Jobs within a 45-min transit commute (10,000s) 1.33 4.69 5.17 11.85 +
Distance to nearest commuter shuttle stop (100 m) 0.08 5.37 7.02 34.69 +
Table 2:Regression Model Results Predicting Log Rent
Distance Model KDE Specification 1 Models KDE Specification 2 Models KDE Specification 3 Models KDE Specification 4 Models
Intercept 7.68*** 7.85*** 7.67*** 7.67*** 7.72*** 7.44*** 7.42*** 7.59*** 7.24*** 7.19*** 7.37*** 6.95*** 6.86***
Beds 0.31*** 0.31*** 0.31*** 0.31*** 0.31*** 0.31*** 0.31*** 0.31*** 0.31*** 0.31*** 0.31*** 0.31*** 0.31***
Baths 0.05*** 0.04*** 0.05*** 0.05*** 0.04*** 0.05*** 0.05*** 0.04*** 0.04*** 0.05*** 0.04*** 0.04*** 0.04***
Distance to Highway (km) 0.01* 0 0 0 0 0 0 0 0.01 0.01 0.01 0.01 0.01
Unit Is Rent Controlled -0.1*** -0.1*** -0.1*** -0.1*** -0.1*** -0.09*** -0.09*** -0.09*** -0.08** -0.08** -0.09** -0.08** -0.07**
Year Unit Built 0^ 0* 0* 0* 0* 0^ 0^ 0* 0 0 0 0 0
Distance to Nearest Park (km) -0.07*** -0.07*** -0.07*** -0.07*** -0.07*** -0.07*** -0.07*** -0.07*** -0.07*** -0.07*** -0.07*** -0.07*** -0.07***
Financial Quarters 0.03*** 0.03*** 0.03*** 0.03*** 0.03*** 0.03*** 0.03*** 0.03*** 0.03*** 0.03*** 0.03*** 0.03*** 0.03***
Distance to Coast or Shore (km) -0.04*** -0.03*** -0.03*** -0.03*** -0.03*** -0.03*** -0.03*** -0.02*** -0.03*** -0.03*** -0.02*** -0.03*** -0.04***
Block Group Median Income ($10,000s) 0.02*** 0.03*** 0.03*** 0.03*** 0.03*** 0.03*** 0.03*** 0.03*** 0.02*** 0.02*** 0.02*** 0.02*** 0.02***
Number of Building Code Violations -0.01*** -0.01*** -0.01*** -0.01*** -0.01*** -0.01*** -0.01*** -0.01*** -0.01*** -0.01*** -0.01*** -0.01*** -0.01***
Percent Change in Block Group White Population (2000-2014) 0*** 0*** 0** 0** 0*** 0** 0** 0*** 0*** 0** 0*** 0*** 0***
Change in Number of Professional, Technical, Scientific Resident workers (100s) -0.01*** -0.01*** -0.02*** -0.01*** -0.02*** -0.02*** -0.02*** -0.02*** -0.02*** -0.02*** -0.02*** -0.02*** -0.02***
Change in Median Income 2000-14 (1000s) 0.07^ 0.07^ 0.07^ 0.07^ 0.06^ 0.06 0.06 0.05 0.05 0.05 0.04 0.04 0.04
Jobs Within a 45 minute car commute (10,000s) 0 0 0 0 0 0 0 0 0 0 0 0 0
Jobs Within a 45 minute transit commute (10,000s) 0.03*** 0.04*** 0.04*** 0.05*** 0.04*** 0.04*** 0.04*** 0.03*** 0.04*** 0.04*** 0.03*** 0.03*** 0.04***
Distance to nearest commuter shuttle stop (100m) -0.01***
Unweighted Kernal Density Estimate 0.01*** 0.02*** 0.03*** 0.05***
Jobs-Weighted Kernal Density Estimate 0*** 0*** 0*** 0***
Capital-Weighted Kernal Density Estimate 0*** 0*** 0*** 0***
R-Squared 0.6363 0.6249 0.6264 0.626 0.6267 0.6295 0.5993 0.6282 0.632 0.6318 0.6311 0.6358 0.6363
Adjusted R-Squared 0.6337 0.6223 0.6238 0.6234 0.6241 0.6269 0.5965 0.6256 0.6294 0.6293 0.6285 0.6333 0.6338

***p < .001, ** p< .01, * p< .05, ^ p< .1

Figure 1
Figure 1:Kernel Density Estimations by Sigma, Overlaid with Shuttle Stops

References

Anti-Eviction Mapping Project. 2013. “Eviction Newar Shuttle Stops 2011--2013.” 2013. https://www.antievictionmap.com/tech.
Brown, A.E. 2016. “Rubber Tires for Residents.” Transportation Research Record: Journal of the Transportation Research Board 2539: 1–10.
Google Scholar
Hess, Daniel Baldwin, and Tangerine Maria Almeida. 2007. “Impact of Proximity to Light Rail Rapid Transit on Station-Area Property Values in Buffalo, New York.” Urban Studies 44 (5–6): 1041–68. https://doi.org/10.1080/00420980701256005.
Google Scholar
Kok, Nils, Paavo Monkkonen, and John M. Quigley. 2014. “Land Use Regulations and the Value of Land and Housing: An Intra-Metropolitan Analysis.” Journal of Urban Economics 81 (May): 136–48. https://doi.org/10.1016/j.jue.2014.03.004.
Google Scholar
Metcalf, G. 2013. “The San Francisco Exodus.” Citylab. 2013. http://www.citylab.com/housing/2013/10/san-francisco-exodus/7205/.
Mohammad, Sara I., Daniel J. Graham, Patricia C. Melo, and Richard J. Anderson. 2013. “A Meta-Analysis of the Impact of Rail Projects on Land and Property Values.” Transportation Research Part A: Policy and Practice 50 (April): 158–70. https://doi.org/10.1016/j.tra.2013.01.013.
Google Scholar
Stamen Design. 2012. “The City from the Valley.” 2012. https://hi.stamen.com/the-city-from-the-valley-57e835ee3dc6.
Wardrip, Keith. 2011. Public Transit’s Impact on Housing Costs. Washington, D.C: Insights From Housing Policy Research.
Google Scholar
Zuk, M., A. Bierbaum, K Chapple, A. Loukaitou-Sideris, P. Ong, and T. Thomas. 2015. “Gentrification, Displacement and the Role of Public Investment: A Literature Review.”

Powered by Scholastica, the modern academic journal management system